Zip Codes with the Highest Percentage of Population with a Degree in Liberal Arts and History in Richmond, TX
RELATED REPORTS & OPTIONS
Liberal Arts and History
Richmond
Compare Zip Codes
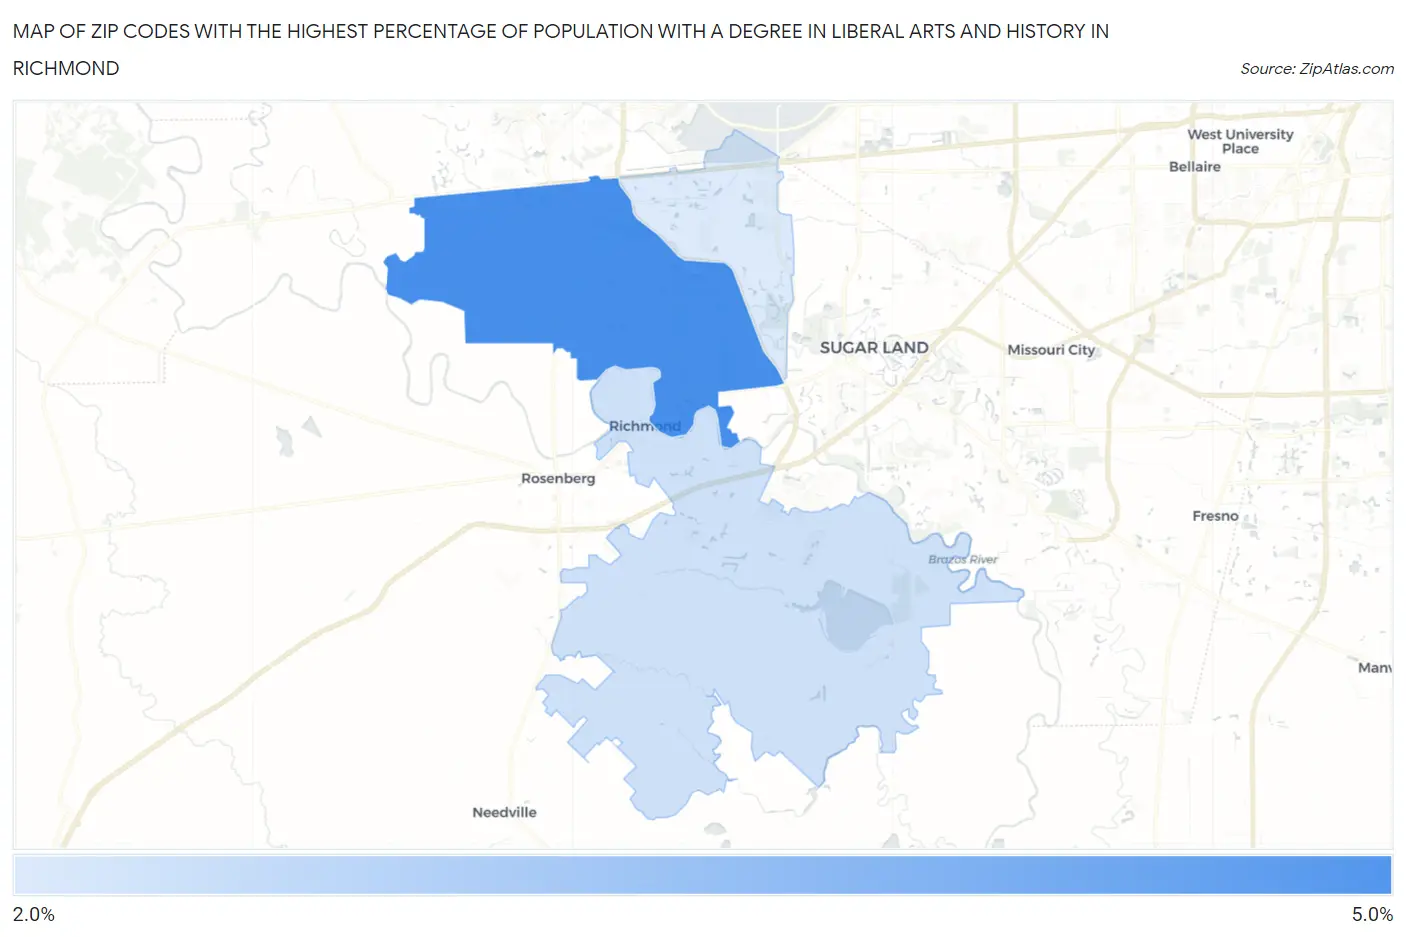
Map of Zip Codes with the Highest Percentage of Population with a Degree in Liberal Arts and History in Richmond
2.5%
4.7%
Zip Codes with the Highest Percentage of Population with a Degree in Liberal Arts and History in Richmond, TX
| Zip Code | % Graduates | vs State | vs National | |
| 1. | 77406 | 4.7% | 4.2%(+0.545)#629 | 4.9%(-0.176)#12,331 |
| 2. | 77469 | 2.7% | 4.2%(-1.49)#1,092 | 4.9%(-2.21)#19,465 |
| 3. | 77407 | 2.5% | 4.2%(-1.69)#1,147 | 4.9%(-2.41)#20,106 |
1
Common Questions
What are the Top Zip Codes with the Highest Percentage of Population with a Degree in Liberal Arts and History in Richmond, TX?
Top Zip Codes with the Highest Percentage of Population with a Degree in Liberal Arts and History in Richmond, TX are:
What zip code has the Highest Percentage of Population with a Degree in Liberal Arts and History in Richmond, TX?
77406 has the Highest Percentage of Population with a Degree in Liberal Arts and History in Richmond, TX with 4.7%.
What is the Percentage of Population with a Degree in Liberal Arts and History in Richmond, TX?
Percentage of Population with a Degree in Liberal Arts and History in Richmond is 8.4%.
What is the Percentage of Population with a Degree in Liberal Arts and History in Texas?
Percentage of Population with a Degree in Liberal Arts and History in Texas is 4.2%.
What is the Percentage of Population with a Degree in Liberal Arts and History in the United States?
Percentage of Population with a Degree in Liberal Arts and History in the United States is 4.9%.