Zip Codes with the Highest Percentage of Population Employed in Accommodation & Food Services in Carrollton, TX
RELATED REPORTS & OPTIONS
Accommodation & Food Services
Carrollton
Compare Zip Codes
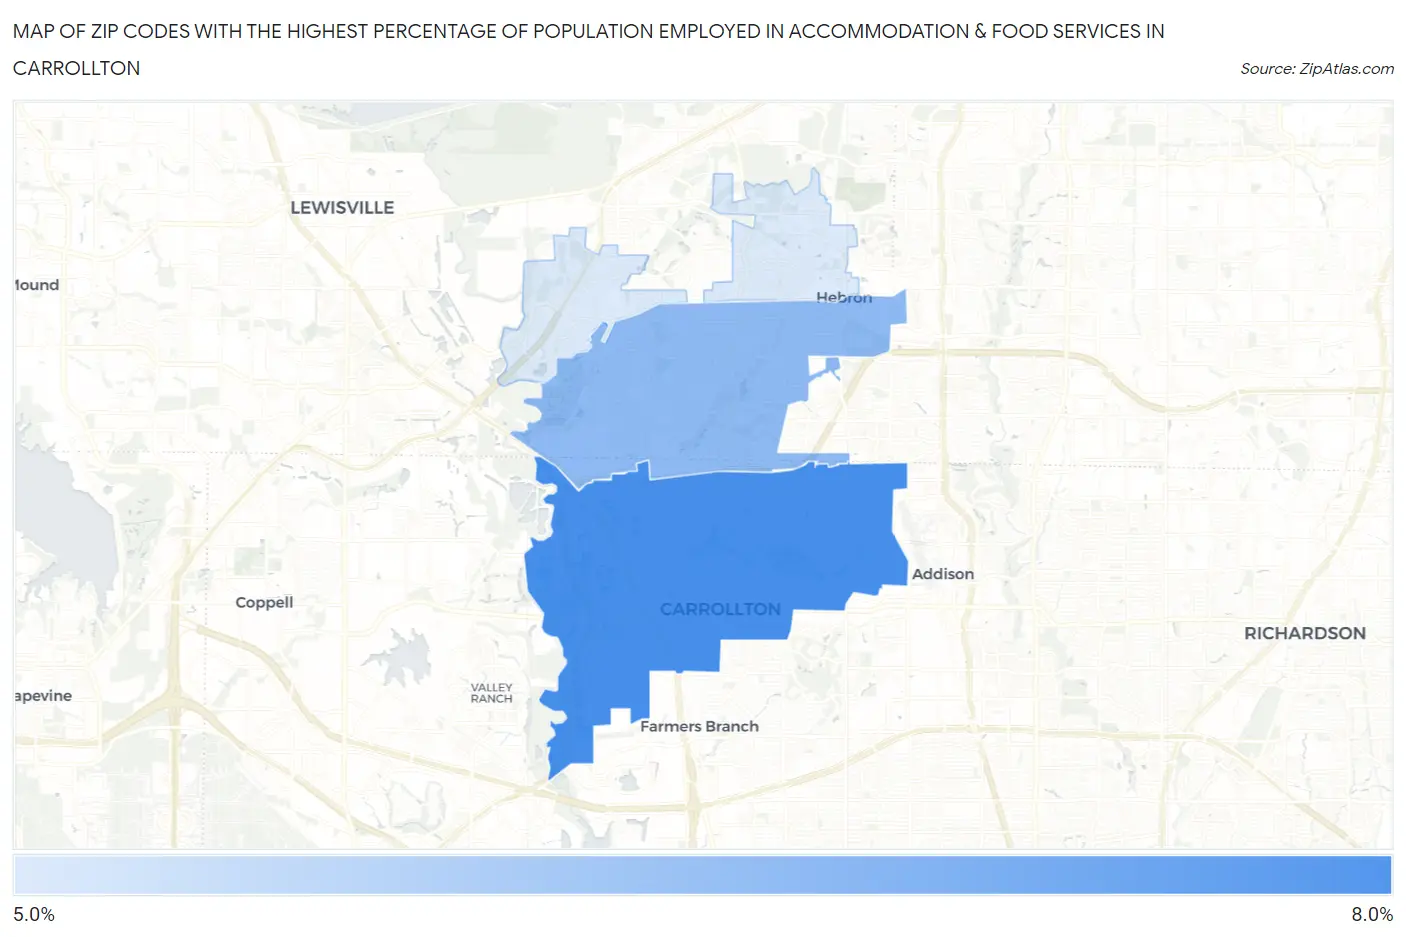
Map of Zip Codes with the Highest Percentage of Population Employed in Accommodation & Food Services in Carrollton
5.5%
7.3%
Zip Codes with the Highest Percentage of Population Employed in Accommodation & Food Services in Carrollton, TX
| Zip Code | % Employed | vs State | vs National | |
| 1. | 75006 | 7.3% | 7.2%(+0.046)#683 | 6.9%(+0.371)#9,669 |
| 2. | 75007 | 6.4% | 7.2%(-0.773)#833 | 6.9%(-0.448)#12,054 |
| 3. | 75010 | 5.5% | 7.2%(-1.66)#1,000 | 6.9%(-1.34)#14,911 |
1
Common Questions
What are the Top Zip Codes with the Highest Percentage of Population Employed in Accommodation & Food Services in Carrollton, TX?
Top Zip Codes with the Highest Percentage of Population Employed in Accommodation & Food Services in Carrollton, TX are:
What zip code has the Highest Percentage of Population Employed in Accommodation & Food Services in Carrollton, TX?
75006 has the Highest Percentage of Population Employed in Accommodation & Food Services in Carrollton, TX with 7.3%.
What is the Percentage of Population Employed in Accommodation & Food Services in Carrollton, TX?
Percentage of Population Employed in Accommodation & Food Services in Carrollton is 6.5%.
What is the Percentage of Population Employed in Accommodation & Food Services in Texas?
Percentage of Population Employed in Accommodation & Food Services in Texas is 7.2%.
What is the Percentage of Population Employed in Accommodation & Food Services in the United States?
Percentage of Population Employed in Accommodation & Food Services in the United States is 6.9%.