Zip Codes with the Highest Percentage of Population Employed in Accommodation & Food Services in Pasadena, TX
RELATED REPORTS & OPTIONS
Accommodation & Food Services
Pasadena
Compare Zip Codes
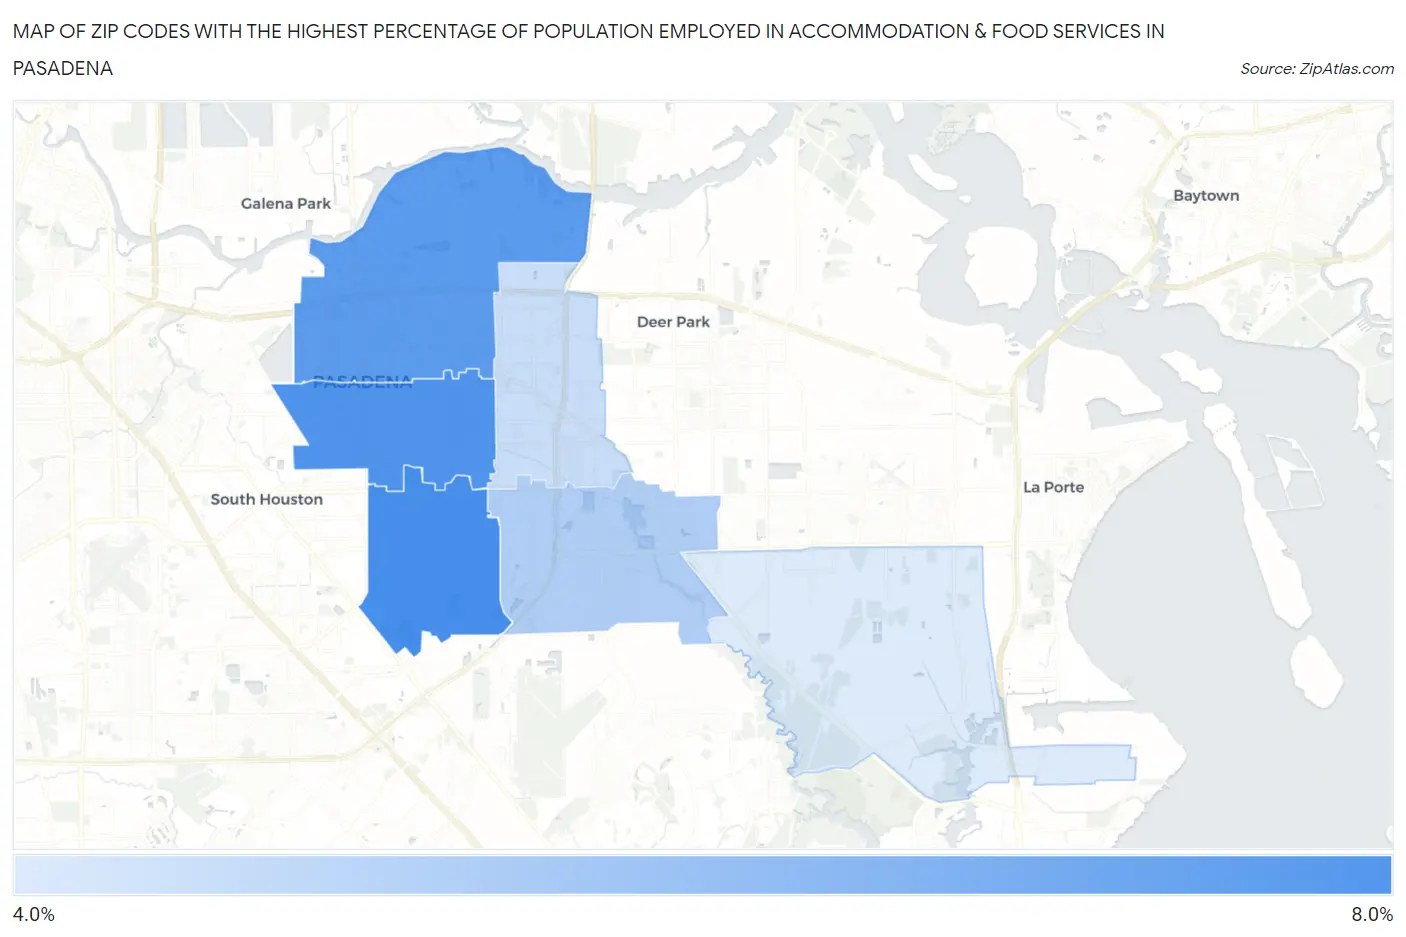
Map of Zip Codes with the Highest Percentage of Population Employed in Accommodation & Food Services in Pasadena
4.9%
7.4%
Zip Codes with the Highest Percentage of Population Employed in Accommodation & Food Services in Pasadena, TX
| Zip Code | % Employed | vs State | vs National | |
| 1. | 77504 | 7.4% | 7.2%(+0.198)#648 | 6.9%(+0.523)#9,248 |
| 2. | 77502 | 7.3% | 7.2%(+0.087)#670 | 6.9%(+0.411)#9,554 |
| 3. | 77506 | 7.1% | 7.2%(-0.133)#706 | 6.9%(+0.192)#10,121 |
| 4. | 77505 | 5.6% | 7.2%(-1.59)#981 | 6.9%(-1.26)#14,640 |
| 5. | 77503 | 5.2% | 7.2%(-1.99)#1,046 | 6.9%(-1.67)#16,071 |
| 6. | 77507 | 4.9% | 7.2%(-2.35)#1,120 | 6.9%(-2.02)#17,293 |
1
Common Questions
What are the Top 5 Zip Codes with the Highest Percentage of Population Employed in Accommodation & Food Services in Pasadena, TX?
Top 5 Zip Codes with the Highest Percentage of Population Employed in Accommodation & Food Services in Pasadena, TX are:
What zip code has the Highest Percentage of Population Employed in Accommodation & Food Services in Pasadena, TX?
77504 has the Highest Percentage of Population Employed in Accommodation & Food Services in Pasadena, TX with 7.4%.
What is the Percentage of Population Employed in Accommodation & Food Services in Pasadena, TX?
Percentage of Population Employed in Accommodation & Food Services in Pasadena is 6.4%.
What is the Percentage of Population Employed in Accommodation & Food Services in Texas?
Percentage of Population Employed in Accommodation & Food Services in Texas is 7.2%.
What is the Percentage of Population Employed in Accommodation & Food Services in the United States?
Percentage of Population Employed in Accommodation & Food Services in the United States is 6.9%.