Zip Codes with the Highest Percentage of Population Employed in Accommodation & Food Services in Flower Mound, TX
RELATED REPORTS & OPTIONS
Accommodation & Food Services
Flower Mound
Compare Zip Codes
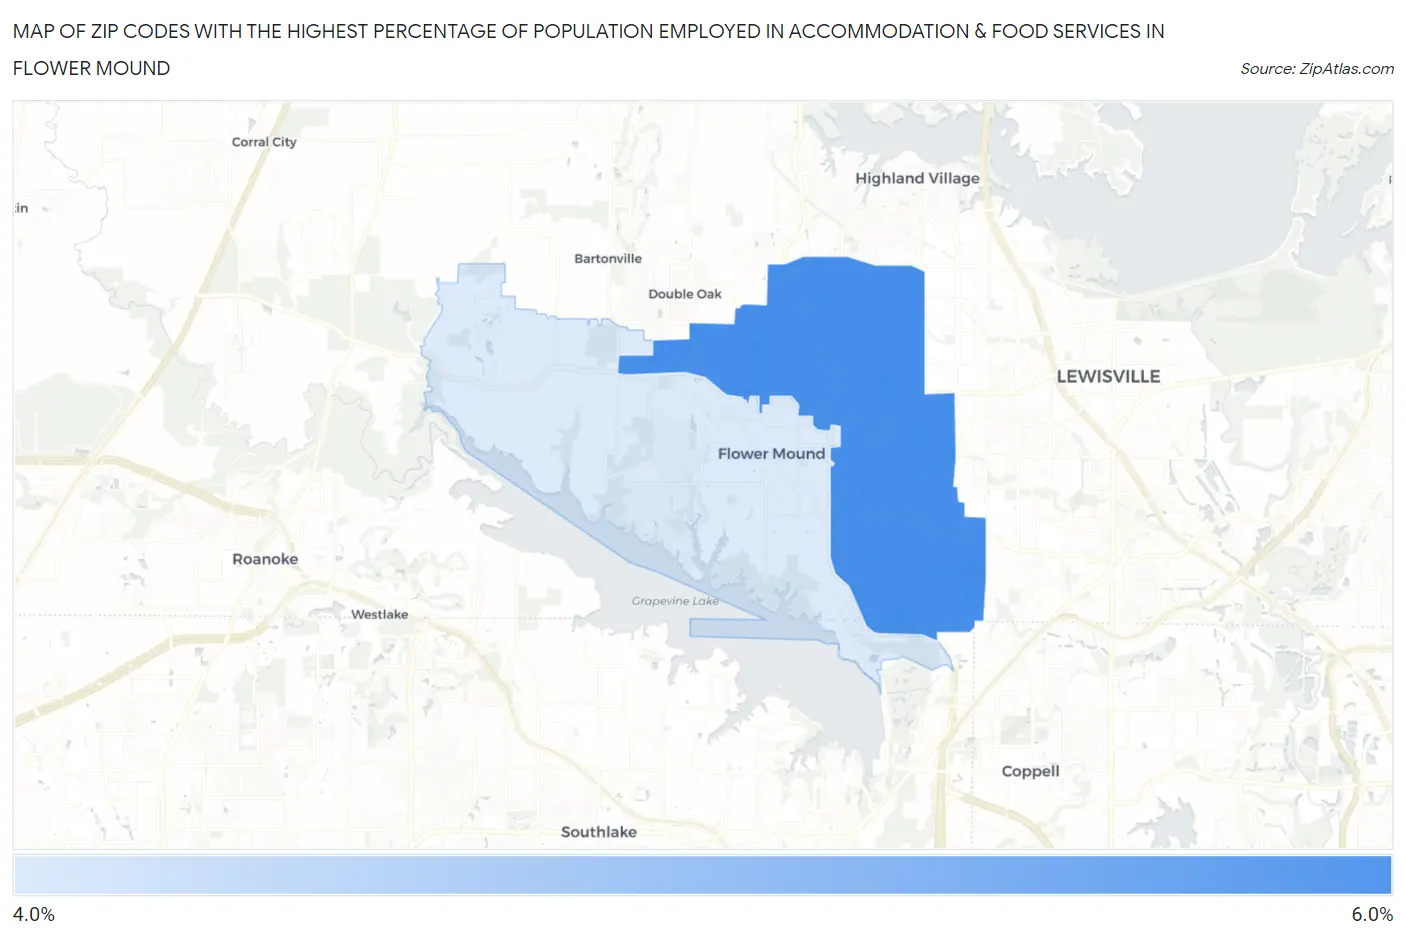
Map of Zip Codes with the Highest Percentage of Population Employed in Accommodation & Food Services in Flower Mound
4.9%
5.2%
Zip Codes with the Highest Percentage of Population Employed in Accommodation & Food Services in Flower Mound, TX
| Zip Code | % Employed | vs State | vs National | |
| 1. | 75028 | 5.2% | 7.2%(-2.04)#1,049 | 6.9%(-1.71)#16,205 |
| 2. | 75022 | 4.9% | 7.2%(-2.31)#1,110 | 6.9%(-1.98)#17,167 |
1
Common Questions
What are the Top Zip Codes with the Highest Percentage of Population Employed in Accommodation & Food Services in Flower Mound, TX?
Top Zip Codes with the Highest Percentage of Population Employed in Accommodation & Food Services in Flower Mound, TX are:
What zip code has the Highest Percentage of Population Employed in Accommodation & Food Services in Flower Mound, TX?
75028 has the Highest Percentage of Population Employed in Accommodation & Food Services in Flower Mound, TX with 5.2%.
What is the Percentage of Population Employed in Accommodation & Food Services in Flower Mound, TX?
Percentage of Population Employed in Accommodation & Food Services in Flower Mound is 5.1%.
What is the Percentage of Population Employed in Accommodation & Food Services in Texas?
Percentage of Population Employed in Accommodation & Food Services in Texas is 7.2%.
What is the Percentage of Population Employed in Accommodation & Food Services in the United States?
Percentage of Population Employed in Accommodation & Food Services in the United States is 6.9%.