Zip Codes with the Highest Percentage of Population Employed in Accommodation & Food Services in Mission, TX
RELATED REPORTS & OPTIONS
Accommodation & Food Services
Mission
Compare Zip Codes
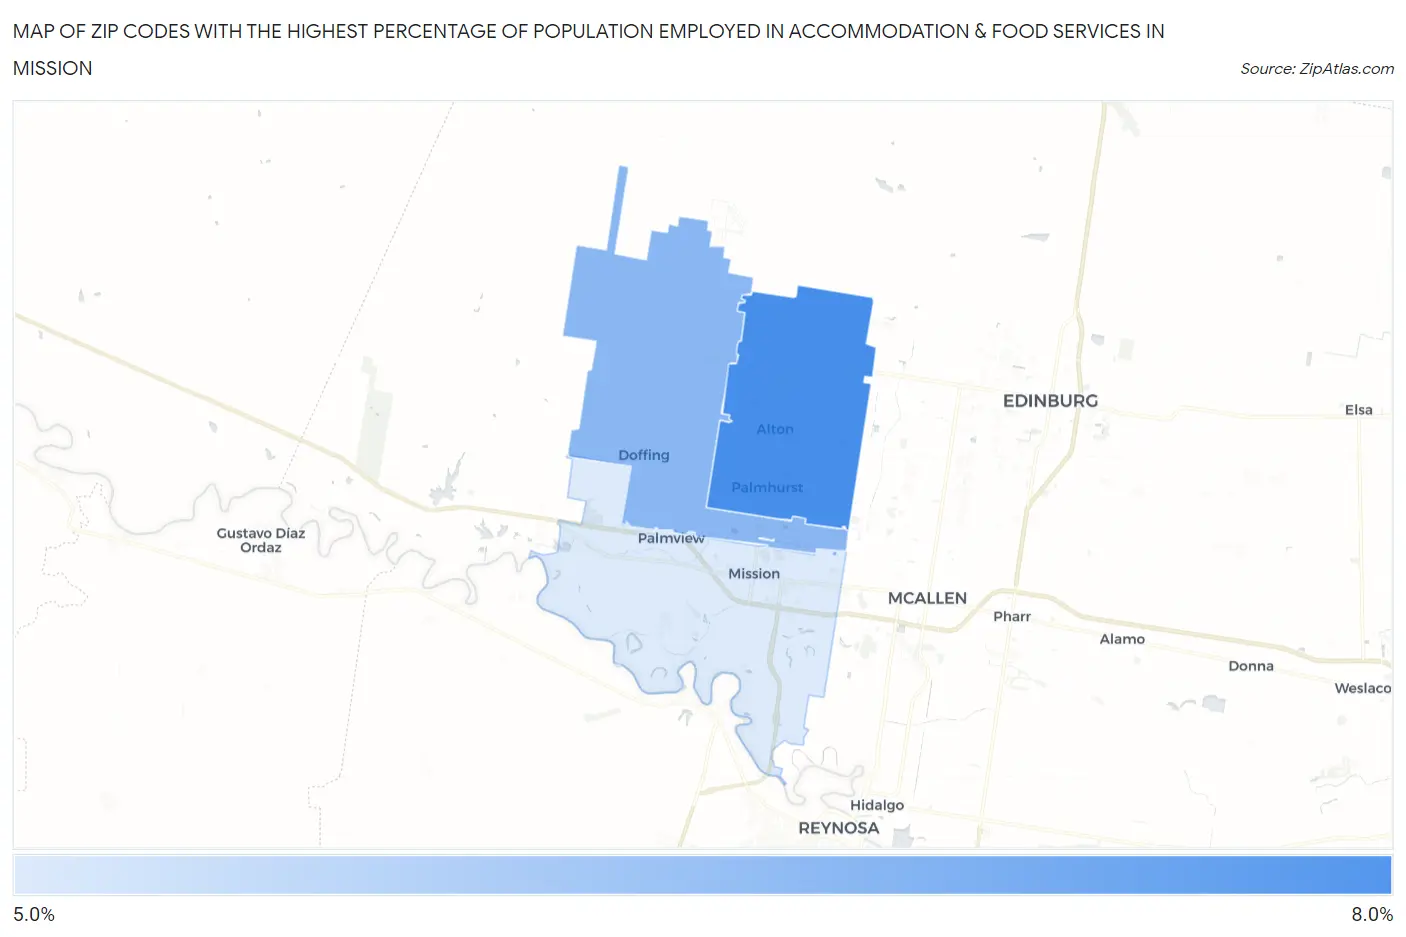
Map of Zip Codes with the Highest Percentage of Population Employed in Accommodation & Food Services in Mission
5.2%
7.7%
Zip Codes with the Highest Percentage of Population Employed in Accommodation & Food Services in Mission, TX
| Zip Code | % Employed | vs State | vs National | |
| 1. | 78573 | 7.7% | 7.2%(+0.513)#596 | 6.9%(+0.838)#8,443 |
| 2. | 78574 | 6.6% | 7.2%(-0.644)#808 | 6.9%(-0.319)#11,648 |
| 3. | 78572 | 5.2% | 7.2%(-2.04)#1,050 | 6.9%(-1.71)#16,206 |
1
Common Questions
What are the Top Zip Codes with the Highest Percentage of Population Employed in Accommodation & Food Services in Mission, TX?
Top Zip Codes with the Highest Percentage of Population Employed in Accommodation & Food Services in Mission, TX are:
What zip code has the Highest Percentage of Population Employed in Accommodation & Food Services in Mission, TX?
78573 has the Highest Percentage of Population Employed in Accommodation & Food Services in Mission, TX with 7.7%.
What is the Percentage of Population Employed in Accommodation & Food Services in Mission, TX?
Percentage of Population Employed in Accommodation & Food Services in Mission is 5.6%.
What is the Percentage of Population Employed in Accommodation & Food Services in Texas?
Percentage of Population Employed in Accommodation & Food Services in Texas is 7.2%.
What is the Percentage of Population Employed in Accommodation & Food Services in the United States?
Percentage of Population Employed in Accommodation & Food Services in the United States is 6.9%.