Zip Codes with the Highest Percentage of Population Employed in Accommodation & Food Services in Missouri City, TX
RELATED REPORTS & OPTIONS
Accommodation & Food Services
Missouri City
Compare Zip Codes
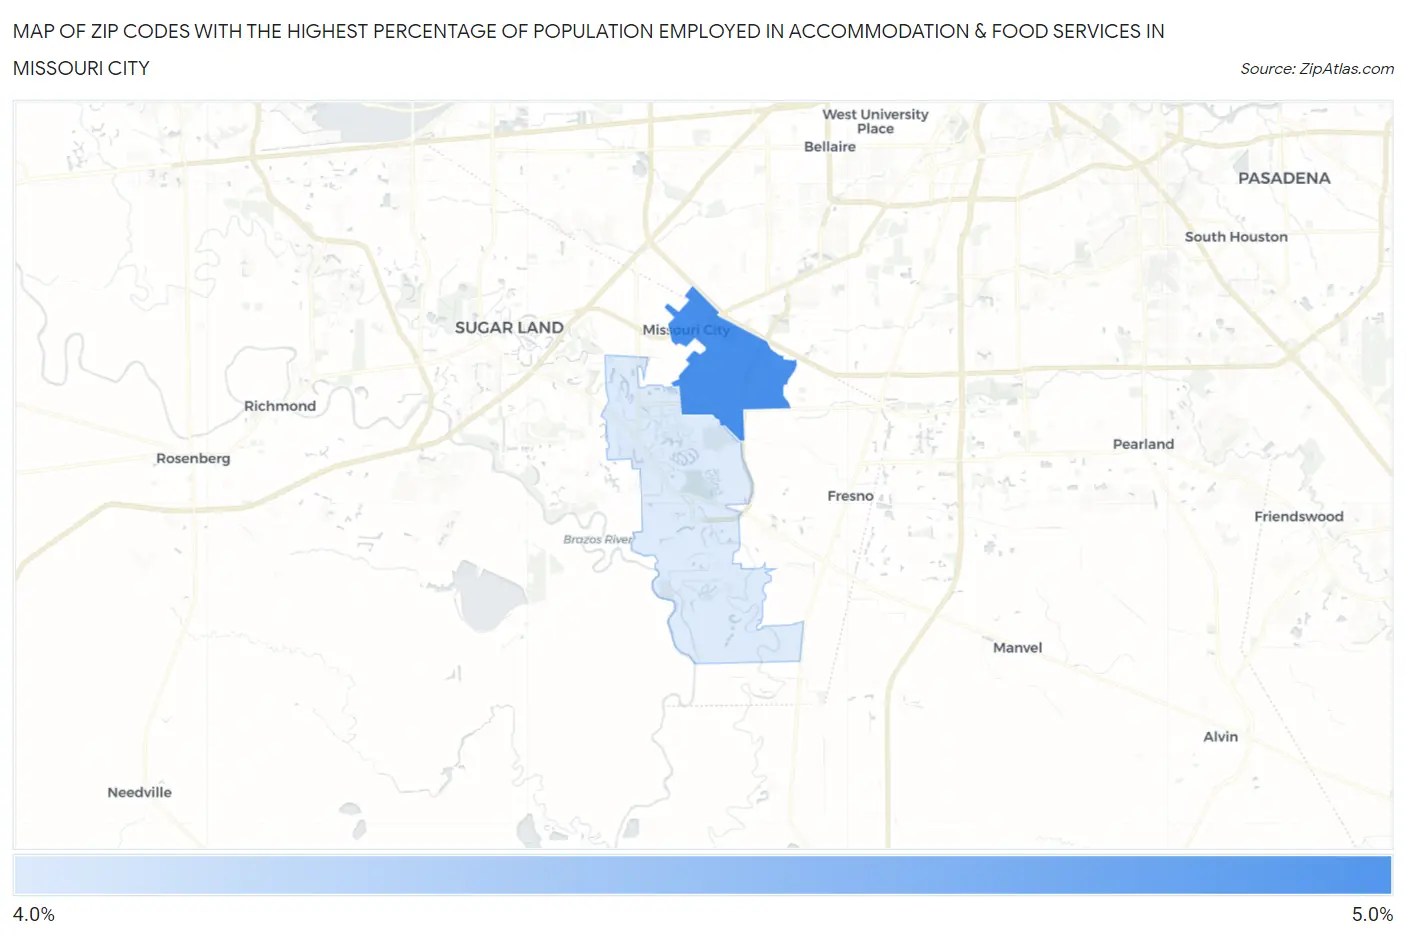
Map of Zip Codes with the Highest Percentage of Population Employed in Accommodation & Food Services in Missouri City
4.6%
4.9%
Zip Codes with the Highest Percentage of Population Employed in Accommodation & Food Services in Missouri City, TX
| Zip Code | % Employed | vs State | vs National | |
| 1. | 77489 | 4.9% | 7.2%(-2.35)#1,123 | 6.9%(-2.03)#17,313 |
| 2. | 77459 | 4.6% | 7.2%(-2.57)#1,166 | 6.9%(-2.25)#18,056 |
1
Common Questions
What are the Top Zip Codes with the Highest Percentage of Population Employed in Accommodation & Food Services in Missouri City, TX?
Top Zip Codes with the Highest Percentage of Population Employed in Accommodation & Food Services in Missouri City, TX are:
What zip code has the Highest Percentage of Population Employed in Accommodation & Food Services in Missouri City, TX?
77489 has the Highest Percentage of Population Employed in Accommodation & Food Services in Missouri City, TX with 4.9%.
What is the Percentage of Population Employed in Accommodation & Food Services in Missouri City, TX?
Percentage of Population Employed in Accommodation & Food Services in Missouri City is 5.2%.
What is the Percentage of Population Employed in Accommodation & Food Services in Texas?
Percentage of Population Employed in Accommodation & Food Services in Texas is 7.2%.
What is the Percentage of Population Employed in Accommodation & Food Services in the United States?
Percentage of Population Employed in Accommodation & Food Services in the United States is 6.9%.