Zip Codes with the Highest Percentage of Population Employed in Accommodation & Food Services in Santa Fe, TX
RELATED REPORTS & OPTIONS
Accommodation & Food Services
Santa Fe
Compare Zip Codes
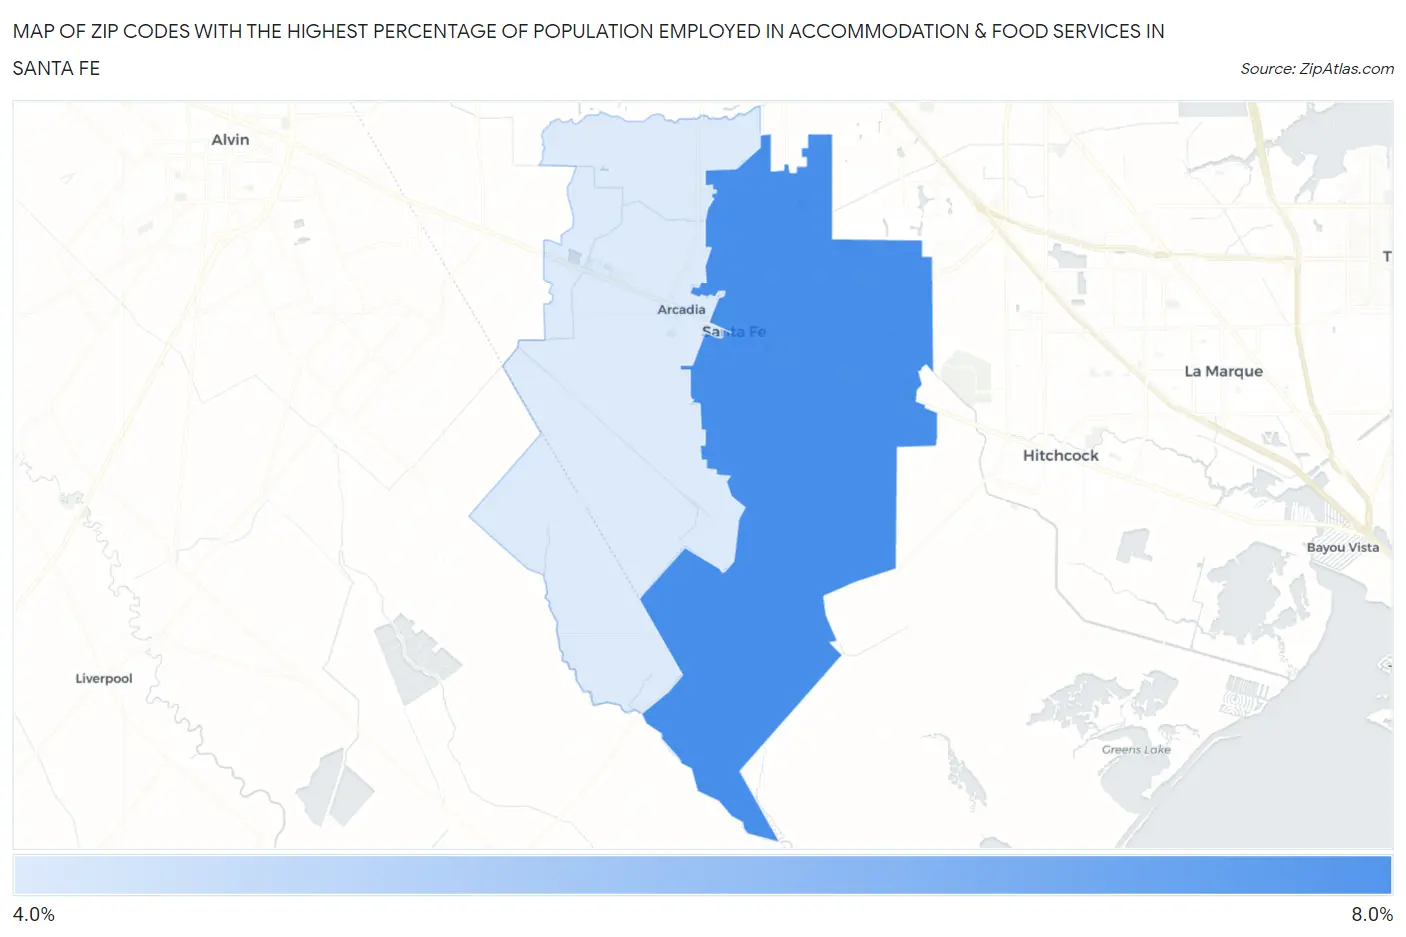
Map of Zip Codes with the Highest Percentage of Population Employed in Accommodation & Food Services in Santa Fe
4.5%
6.7%
Zip Codes with the Highest Percentage of Population Employed in Accommodation & Food Services in Santa Fe, TX
| Zip Code | % Employed | vs State | vs National | |
| 1. | 77510 | 6.7% | 7.2%(-0.485)#775 | 6.9%(-0.160)#11,138 |
| 2. | 77517 | 4.5% | 7.2%(-2.72)#1,195 | 6.9%(-2.40)#18,561 |
1
Common Questions
What are the Top Zip Codes with the Highest Percentage of Population Employed in Accommodation & Food Services in Santa Fe, TX?
Top Zip Codes with the Highest Percentage of Population Employed in Accommodation & Food Services in Santa Fe, TX are:
What zip code has the Highest Percentage of Population Employed in Accommodation & Food Services in Santa Fe, TX?
77510 has the Highest Percentage of Population Employed in Accommodation & Food Services in Santa Fe, TX with 6.7%.
What is the Percentage of Population Employed in Accommodation & Food Services in Santa Fe, TX?
Percentage of Population Employed in Accommodation & Food Services in Santa Fe is 5.3%.
What is the Percentage of Population Employed in Accommodation & Food Services in Texas?
Percentage of Population Employed in Accommodation & Food Services in Texas is 7.2%.
What is the Percentage of Population Employed in Accommodation & Food Services in the United States?
Percentage of Population Employed in Accommodation & Food Services in the United States is 6.9%.