Zip Codes with the Highest Percentage of Population Employed in Accommodation & Food Services in Odessa, TX
RELATED REPORTS & OPTIONS
Accommodation & Food Services
Odessa
Compare Zip Codes
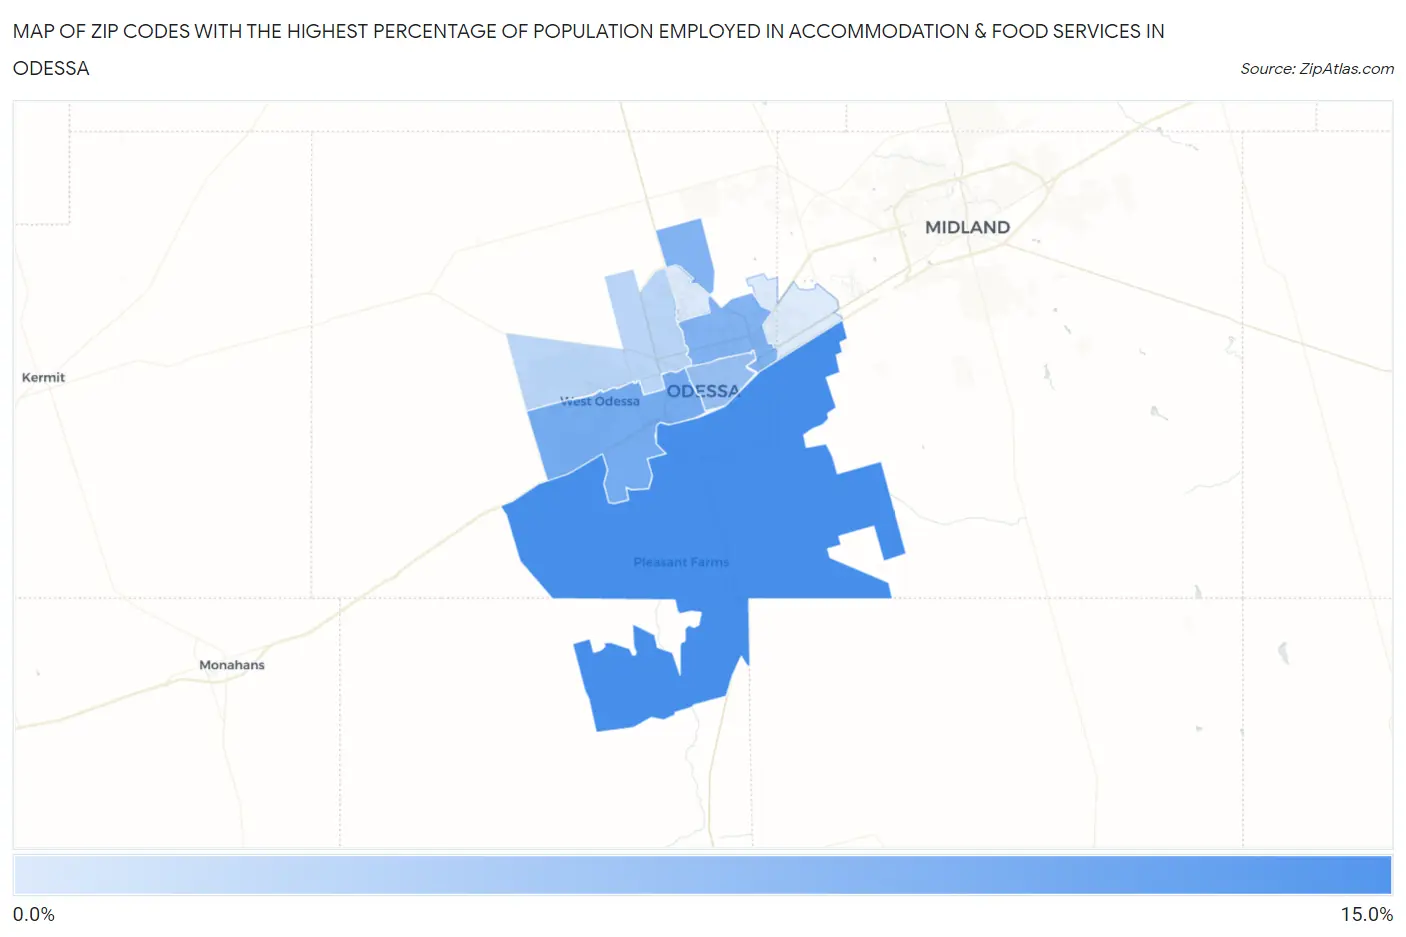
Map of Zip Codes with the Highest Percentage of Population Employed in Accommodation & Food Services in Odessa
3.0%
10.5%
Zip Codes with the Highest Percentage of Population Employed in Accommodation & Food Services in Odessa, TX
| Zip Code | % Employed | vs State | vs National | |
| 1. | 79766 | 10.5% | 7.2%(+3.27)#245 | 6.9%(+3.59)#4,022 |
| 2. | 79763 | 8.2% | 7.2%(+0.967)#525 | 6.9%(+1.29)#7,481 |
| 3. | 79762 | 7.5% | 7.2%(+0.287)#634 | 6.9%(+0.612)#9,010 |
| 4. | 79761 | 6.3% | 7.2%(-0.867)#857 | 6.9%(-0.542)#12,355 |
| 5. | 79764 | 4.7% | 7.2%(-2.53)#1,160 | 6.9%(-2.21)#17,904 |
| 6. | 79765 | 3.0% | 7.2%(-4.21)#1,436 | 6.9%(-3.88)#23,226 |
1
Common Questions
What are the Top 5 Zip Codes with the Highest Percentage of Population Employed in Accommodation & Food Services in Odessa, TX?
Top 5 Zip Codes with the Highest Percentage of Population Employed in Accommodation & Food Services in Odessa, TX are:
What zip code has the Highest Percentage of Population Employed in Accommodation & Food Services in Odessa, TX?
79766 has the Highest Percentage of Population Employed in Accommodation & Food Services in Odessa, TX with 10.5%.
What is the Percentage of Population Employed in Accommodation & Food Services in Odessa, TX?
Percentage of Population Employed in Accommodation & Food Services in Odessa is 6.9%.
What is the Percentage of Population Employed in Accommodation & Food Services in Texas?
Percentage of Population Employed in Accommodation & Food Services in Texas is 7.2%.
What is the Percentage of Population Employed in Accommodation & Food Services in the United States?
Percentage of Population Employed in Accommodation & Food Services in the United States is 6.9%.