Zip Codes with the Highest Percentage of Population Employed in Accommodation & Food Services in Killeen, TX
RELATED REPORTS & OPTIONS
Accommodation & Food Services
Killeen
Compare Zip Codes
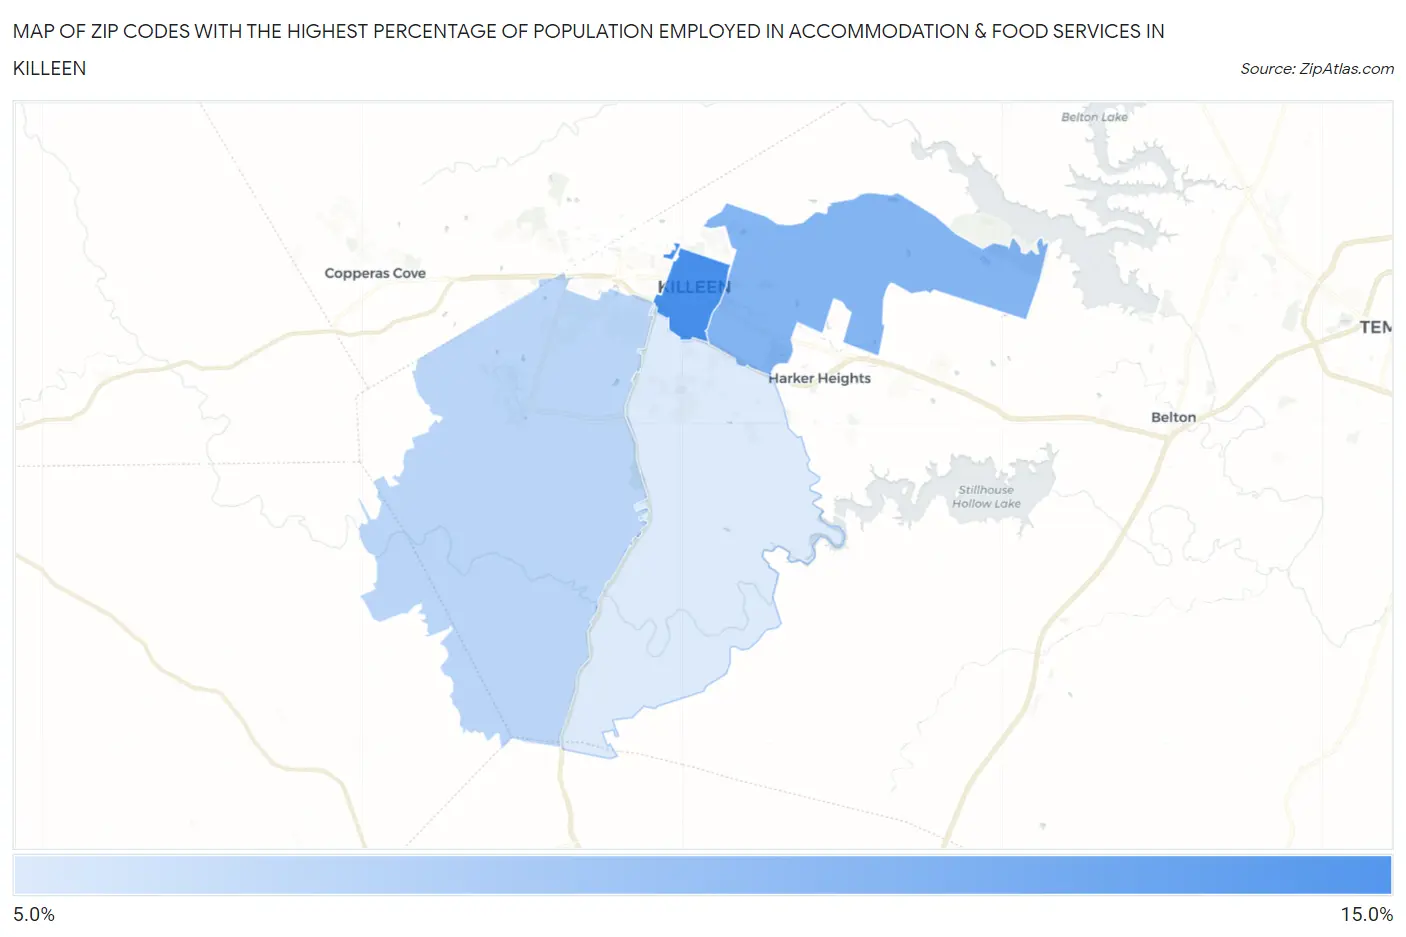
Map of Zip Codes with the Highest Percentage of Population Employed in Accommodation & Food Services in Killeen
7.8%
13.2%
Zip Codes with the Highest Percentage of Population Employed in Accommodation & Food Services in Killeen, TX
| Zip Code | % Employed | vs State | vs National | |
| 1. | 76541 | 13.2% | 7.2%(+5.98)#126 | 6.9%(+6.31)#2,272 |
| 2. | 76543 | 11.0% | 7.2%(+3.80)#215 | 6.9%(+4.13)#3,547 |
| 3. | 76549 | 9.1% | 7.2%(+1.85)#396 | 6.9%(+2.18)#5,874 |
| 4. | 76542 | 7.8% | 7.2%(+0.625)#583 | 6.9%(+0.950)#8,192 |
1
Common Questions
What are the Top 3 Zip Codes with the Highest Percentage of Population Employed in Accommodation & Food Services in Killeen, TX?
Top 3 Zip Codes with the Highest Percentage of Population Employed in Accommodation & Food Services in Killeen, TX are:
What zip code has the Highest Percentage of Population Employed in Accommodation & Food Services in Killeen, TX?
76541 has the Highest Percentage of Population Employed in Accommodation & Food Services in Killeen, TX with 13.2%.
What is the Percentage of Population Employed in Accommodation & Food Services in Killeen, TX?
Percentage of Population Employed in Accommodation & Food Services in Killeen is 9.7%.
What is the Percentage of Population Employed in Accommodation & Food Services in Texas?
Percentage of Population Employed in Accommodation & Food Services in Texas is 7.2%.
What is the Percentage of Population Employed in Accommodation & Food Services in the United States?
Percentage of Population Employed in Accommodation & Food Services in the United States is 6.9%.