Zip Codes with the Highest Percentage of Population Employed in Accommodation & Food Services in Palestine, TX
RELATED REPORTS & OPTIONS
Accommodation & Food Services
Palestine
Compare Zip Codes
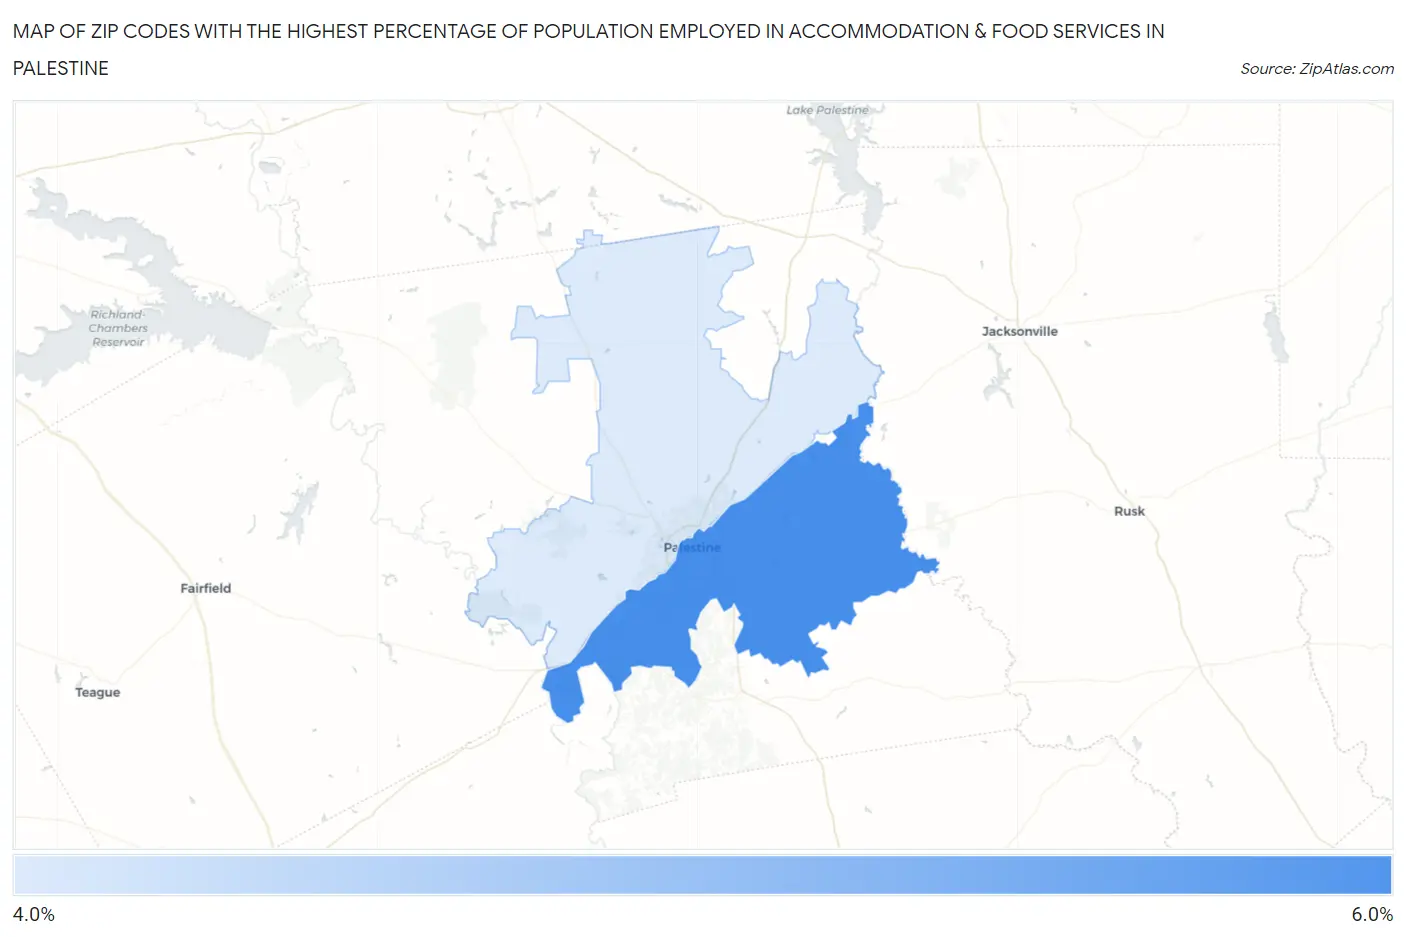
Map of Zip Codes with the Highest Percentage of Population Employed in Accommodation & Food Services in Palestine
4.4%
5.4%
Zip Codes with the Highest Percentage of Population Employed in Accommodation & Food Services in Palestine, TX
| Zip Code | % Employed | vs State | vs National | |
| 1. | 75801 | 5.4% | 7.2%(-1.79)#1,017 | 6.9%(-1.47)#15,368 |
| 2. | 75803 | 4.4% | 7.2%(-2.77)#1,203 | 6.9%(-2.44)#18,709 |
1
Common Questions
What are the Top Zip Codes with the Highest Percentage of Population Employed in Accommodation & Food Services in Palestine, TX?
Top Zip Codes with the Highest Percentage of Population Employed in Accommodation & Food Services in Palestine, TX are:
What zip code has the Highest Percentage of Population Employed in Accommodation & Food Services in Palestine, TX?
75801 has the Highest Percentage of Population Employed in Accommodation & Food Services in Palestine, TX with 5.4%.
What is the Percentage of Population Employed in Accommodation & Food Services in Palestine, TX?
Percentage of Population Employed in Accommodation & Food Services in Palestine is 6.1%.
What is the Percentage of Population Employed in Accommodation & Food Services in Texas?
Percentage of Population Employed in Accommodation & Food Services in Texas is 7.2%.
What is the Percentage of Population Employed in Accommodation & Food Services in the United States?
Percentage of Population Employed in Accommodation & Food Services in the United States is 6.9%.