Zip Codes with the Highest Percentage of Population Employed in Accommodation & Food Services in Denton, TX
RELATED REPORTS & OPTIONS
Accommodation & Food Services
Denton
Compare Zip Codes
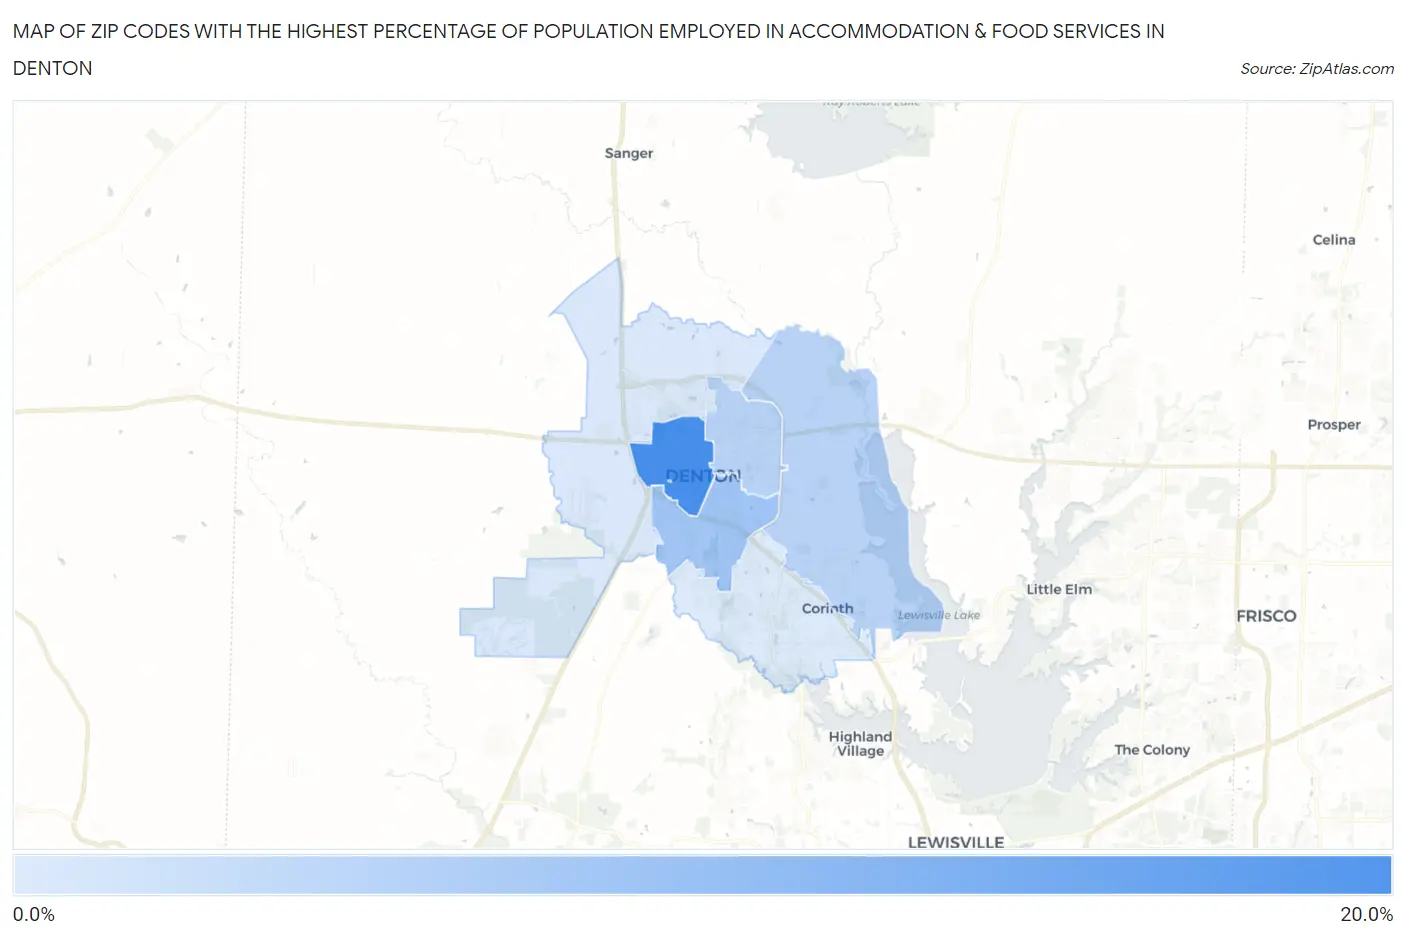
Map of Zip Codes with the Highest Percentage of Population Employed in Accommodation & Food Services in Denton
6.3%
17.1%
Zip Codes with the Highest Percentage of Population Employed in Accommodation & Food Services in Denton, TX
| Zip Code | % Employed | vs State | vs National | |
| 1. | 76201 | 17.1% | 7.2%(+9.94)#64 | 6.9%(+10.3)#1,239 |
| 2. | 76205 | 10.5% | 7.2%(+3.33)#240 | 6.9%(+3.66)#3,950 |
| 3. | 76209 | 8.9% | 7.2%(+1.69)#417 | 6.9%(+2.01)#6,133 |
| 4. | 76208 | 8.8% | 7.2%(+1.64)#424 | 6.9%(+1.97)#6,199 |
| 5. | 76207 | 6.4% | 7.2%(-0.784)#837 | 6.9%(-0.459)#12,087 |
| 6. | 76210 | 6.3% | 7.2%(-0.878)#860 | 6.9%(-0.554)#12,386 |
1
Common Questions
What are the Top 5 Zip Codes with the Highest Percentage of Population Employed in Accommodation & Food Services in Denton, TX?
Top 5 Zip Codes with the Highest Percentage of Population Employed in Accommodation & Food Services in Denton, TX are:
What zip code has the Highest Percentage of Population Employed in Accommodation & Food Services in Denton, TX?
76201 has the Highest Percentage of Population Employed in Accommodation & Food Services in Denton, TX with 17.1%.
What is the Percentage of Population Employed in Accommodation & Food Services in Denton, TX?
Percentage of Population Employed in Accommodation & Food Services in Denton is 9.8%.
What is the Percentage of Population Employed in Accommodation & Food Services in Texas?
Percentage of Population Employed in Accommodation & Food Services in Texas is 7.2%.
What is the Percentage of Population Employed in Accommodation & Food Services in the United States?
Percentage of Population Employed in Accommodation & Food Services in the United States is 6.9%.