Zip Codes with the Highest Percentage of Population Employed in Accommodation & Food Services in Grand Prairie, TX
RELATED REPORTS & OPTIONS
Accommodation & Food Services
Grand Prairie
Compare Zip Codes
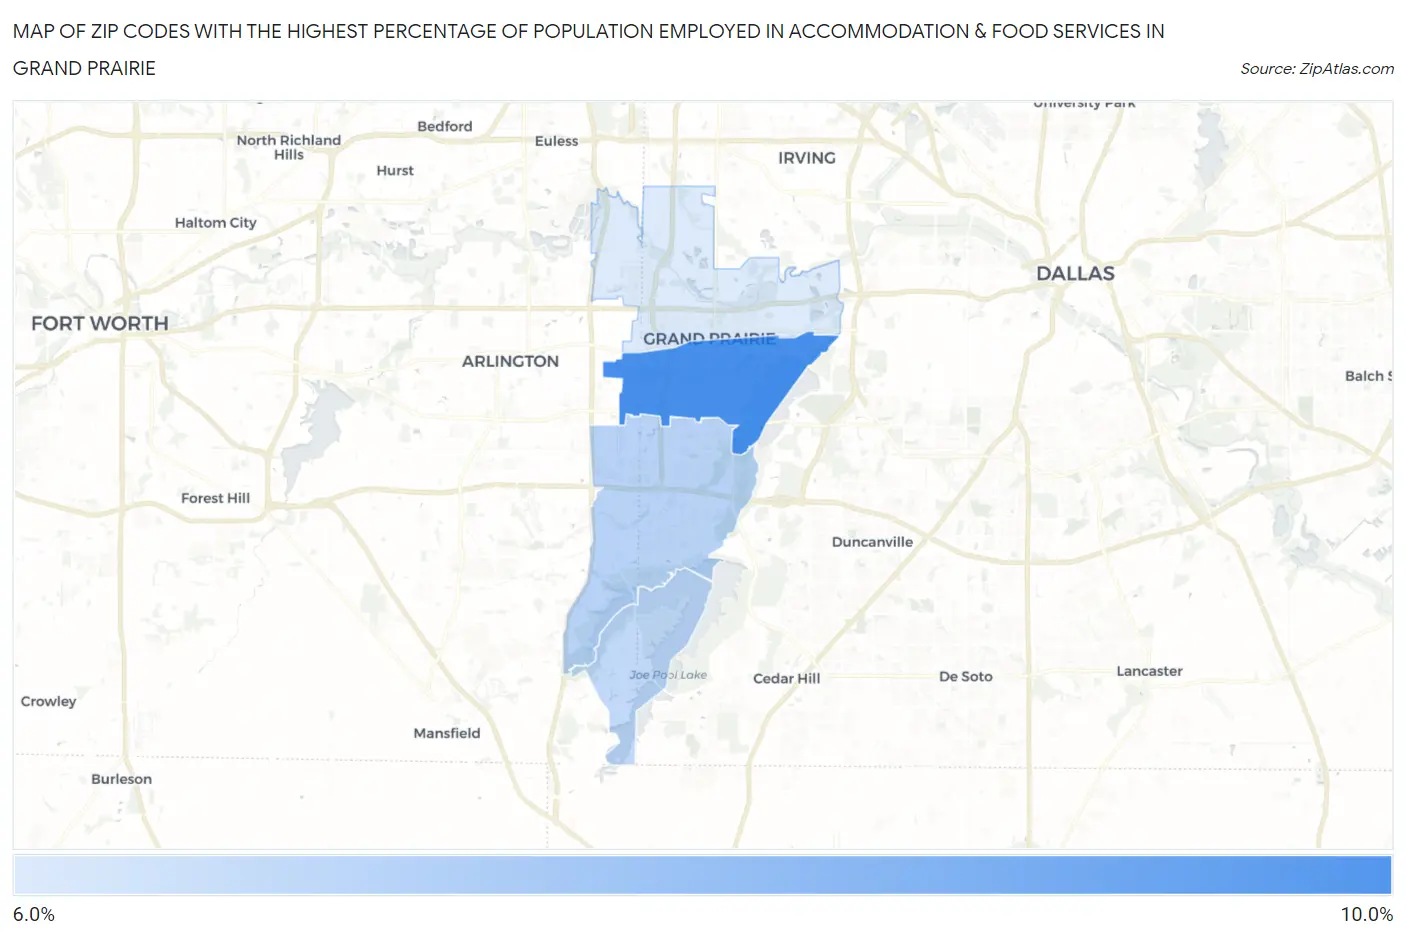
Map of Zip Codes with the Highest Percentage of Population Employed in Accommodation & Food Services in Grand Prairie
6.0%
9.3%
Zip Codes with the Highest Percentage of Population Employed in Accommodation & Food Services in Grand Prairie, TX
| Zip Code | % Employed | vs State | vs National | |
| 1. | 75051 | 9.3% | 7.2%(+2.08)#365 | 6.9%(+2.40)#5,529 |
| 2. | 75052 | 6.8% | 7.2%(-0.369)#751 | 6.9%(-0.044)#10,765 |
| 3. | 75054 | 6.6% | 7.2%(-0.582)#795 | 6.9%(-0.257)#11,438 |
| 4. | 75050 | 6.0% | 7.2%(-1.18)#912 | 6.9%(-0.857)#13,374 |
1
Common Questions
What are the Top 3 Zip Codes with the Highest Percentage of Population Employed in Accommodation & Food Services in Grand Prairie, TX?
Top 3 Zip Codes with the Highest Percentage of Population Employed in Accommodation & Food Services in Grand Prairie, TX are:
What zip code has the Highest Percentage of Population Employed in Accommodation & Food Services in Grand Prairie, TX?
75051 has the Highest Percentage of Population Employed in Accommodation & Food Services in Grand Prairie, TX with 9.3%.
What is the Percentage of Population Employed in Accommodation & Food Services in Grand Prairie, TX?
Percentage of Population Employed in Accommodation & Food Services in Grand Prairie is 6.9%.
What is the Percentage of Population Employed in Accommodation & Food Services in Texas?
Percentage of Population Employed in Accommodation & Food Services in Texas is 7.2%.
What is the Percentage of Population Employed in Accommodation & Food Services in the United States?
Percentage of Population Employed in Accommodation & Food Services in the United States is 6.9%.