Zip Codes with the Highest Percentage of Population Employed in Accommodation & Food Services in Victoria, TX
RELATED REPORTS & OPTIONS
Accommodation & Food Services
Victoria
Compare Zip Codes
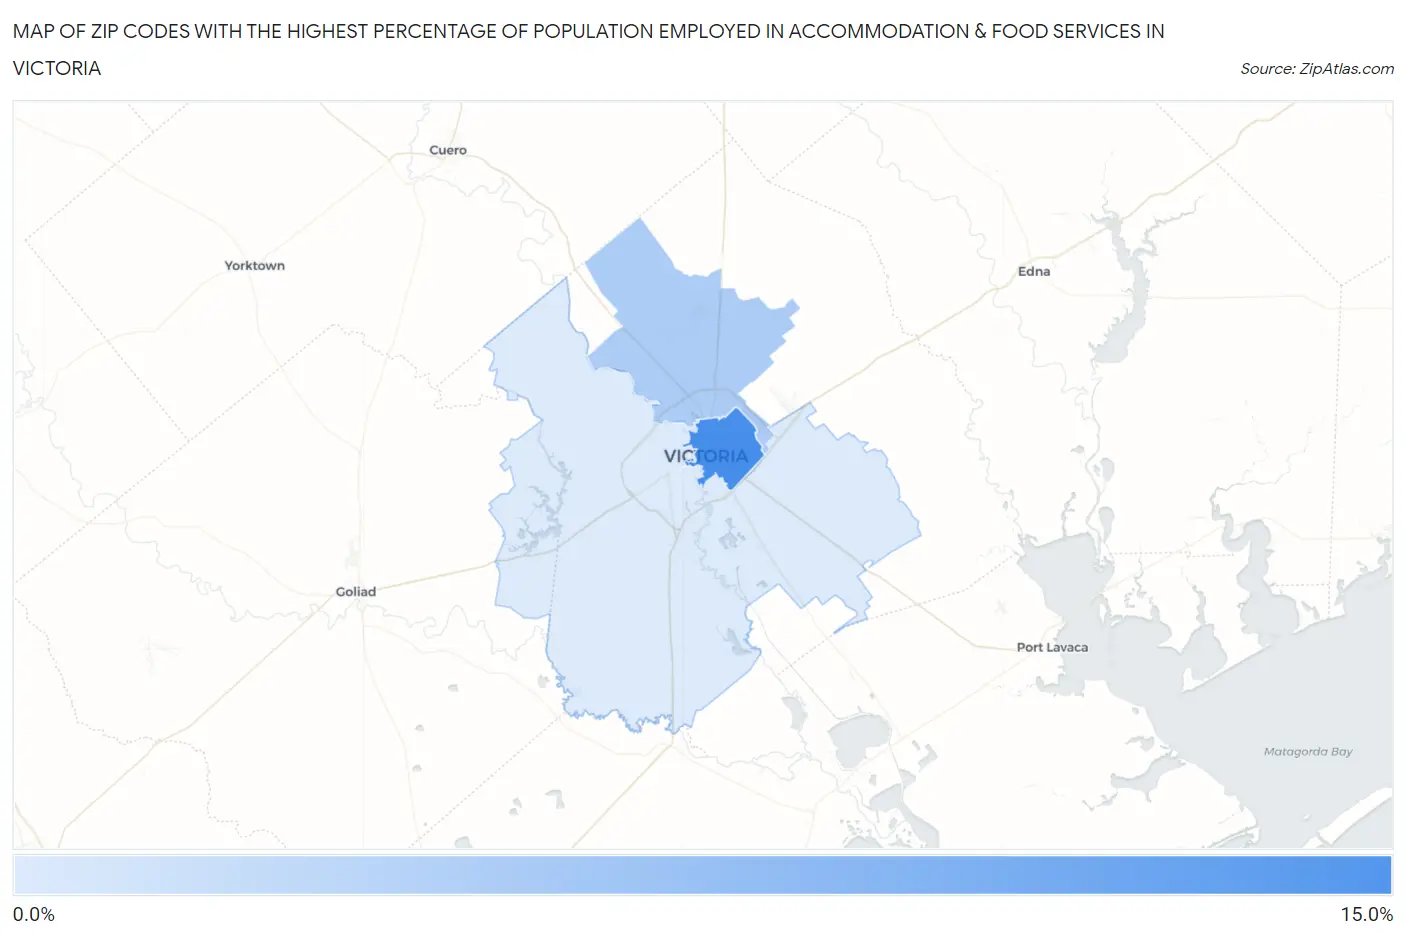
Map of Zip Codes with the Highest Percentage of Population Employed in Accommodation & Food Services in Victoria
3.0%
12.0%
Zip Codes with the Highest Percentage of Population Employed in Accommodation & Food Services in Victoria, TX
| Zip Code | % Employed | vs State | vs National | |
| 1. | 77901 | 12.0% | 7.2%(+4.84)#162 | 6.9%(+5.16)#2,809 |
| 2. | 77904 | 5.8% | 7.2%(-1.43)#951 | 6.9%(-1.11)#14,144 |
| 3. | 77905 | 3.0% | 7.2%(-4.25)#1,439 | 6.9%(-3.92)#23,325 |
1
Common Questions
What are the Top Zip Codes with the Highest Percentage of Population Employed in Accommodation & Food Services in Victoria, TX?
Top Zip Codes with the Highest Percentage of Population Employed in Accommodation & Food Services in Victoria, TX are:
What zip code has the Highest Percentage of Population Employed in Accommodation & Food Services in Victoria, TX?
77901 has the Highest Percentage of Population Employed in Accommodation & Food Services in Victoria, TX with 12.0%.
What is the Percentage of Population Employed in Accommodation & Food Services in Victoria, TX?
Percentage of Population Employed in Accommodation & Food Services in Victoria is 9.8%.
What is the Percentage of Population Employed in Accommodation & Food Services in Texas?
Percentage of Population Employed in Accommodation & Food Services in Texas is 7.2%.
What is the Percentage of Population Employed in Accommodation & Food Services in the United States?
Percentage of Population Employed in Accommodation & Food Services in the United States is 6.9%.