Zip Codes with the Highest Percentage of Population Employed in Accommodation & Food Services in Texarkana, TX
RELATED REPORTS & OPTIONS
Accommodation & Food Services
Texarkana
Compare Zip Codes
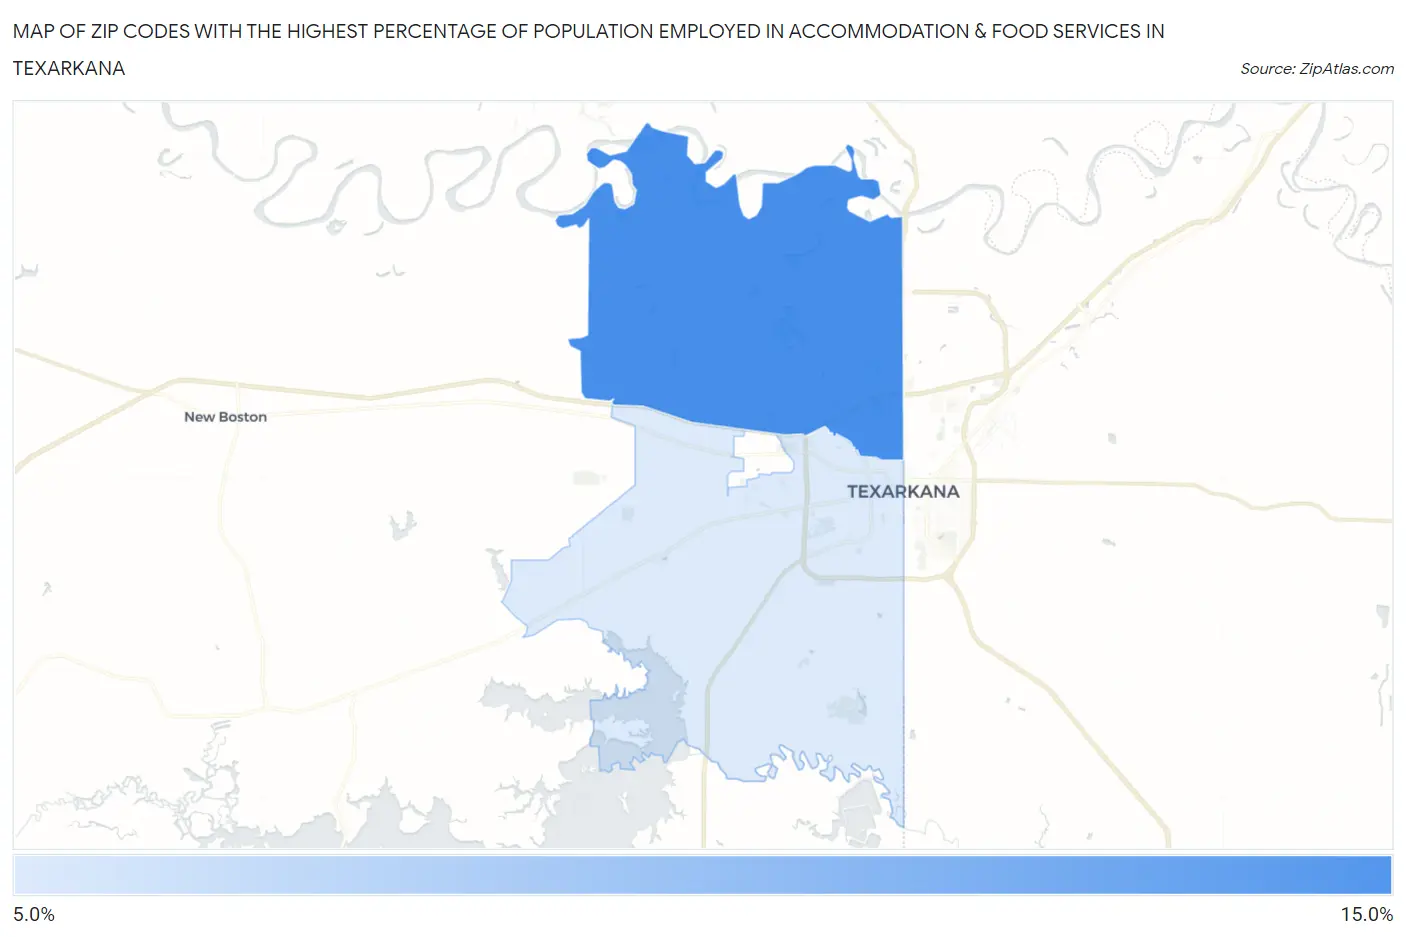
Map of Zip Codes with the Highest Percentage of Population Employed in Accommodation & Food Services in Texarkana
9.3%
11.9%
Zip Codes with the Highest Percentage of Population Employed in Accommodation & Food Services in Texarkana, TX
| Zip Code | % Employed | vs State | vs National | |
| 1. | 75503 | 11.9% | 7.2%(+4.73)#169 | 6.9%(+5.06)#2,869 |
| 2. | 75501 | 9.3% | 7.2%(+2.06)#369 | 6.9%(+2.38)#5,561 |
1
Common Questions
What are the Top Zip Codes with the Highest Percentage of Population Employed in Accommodation & Food Services in Texarkana, TX?
Top Zip Codes with the Highest Percentage of Population Employed in Accommodation & Food Services in Texarkana, TX are:
What zip code has the Highest Percentage of Population Employed in Accommodation & Food Services in Texarkana, TX?
75503 has the Highest Percentage of Population Employed in Accommodation & Food Services in Texarkana, TX with 11.9%.
What is the Percentage of Population Employed in Accommodation & Food Services in Texarkana, TX?
Percentage of Population Employed in Accommodation & Food Services in Texarkana is 13.7%.
What is the Percentage of Population Employed in Accommodation & Food Services in Texas?
Percentage of Population Employed in Accommodation & Food Services in Texas is 7.2%.
What is the Percentage of Population Employed in Accommodation & Food Services in the United States?
Percentage of Population Employed in Accommodation & Food Services in the United States is 6.9%.