Zip Codes with the Highest Percentage of Population Employed in Accommodation & Food Services in Cleburne, TX
RELATED REPORTS & OPTIONS
Accommodation & Food Services
Cleburne
Compare Zip Codes
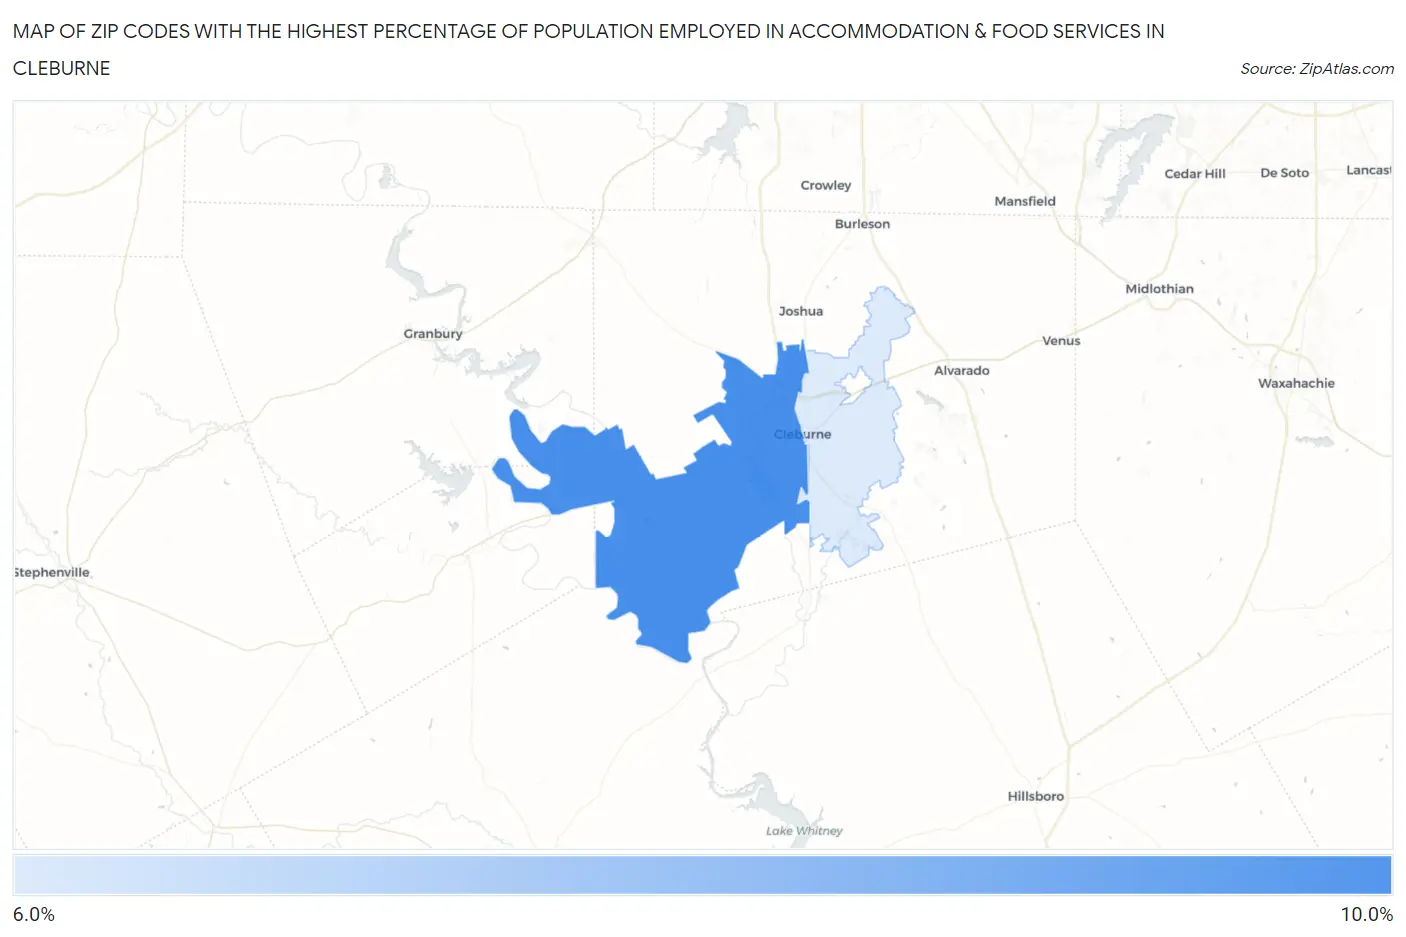
Map of Zip Codes with the Highest Percentage of Population Employed in Accommodation & Food Services in Cleburne
6.4%
8.6%
Zip Codes with the Highest Percentage of Population Employed in Accommodation & Food Services in Cleburne, TX
| Zip Code | % Employed | vs State | vs National | |
| 1. | 76033 | 8.6% | 7.2%(+1.39)#454 | 6.9%(+1.72)#6,645 |
| 2. | 76031 | 6.4% | 7.2%(-0.826)#850 | 6.9%(-0.502)#12,225 |
1
Common Questions
What are the Top Zip Codes with the Highest Percentage of Population Employed in Accommodation & Food Services in Cleburne, TX?
Top Zip Codes with the Highest Percentage of Population Employed in Accommodation & Food Services in Cleburne, TX are:
What zip code has the Highest Percentage of Population Employed in Accommodation & Food Services in Cleburne, TX?
76033 has the Highest Percentage of Population Employed in Accommodation & Food Services in Cleburne, TX with 8.6%.
What is the Percentage of Population Employed in Accommodation & Food Services in Cleburne, TX?
Percentage of Population Employed in Accommodation & Food Services in Cleburne is 8.4%.
What is the Percentage of Population Employed in Accommodation & Food Services in Texas?
Percentage of Population Employed in Accommodation & Food Services in Texas is 7.2%.
What is the Percentage of Population Employed in Accommodation & Food Services in the United States?
Percentage of Population Employed in Accommodation & Food Services in the United States is 6.9%.