Zip Codes with the Highest Percentage of Population Employed in Accommodation & Food Services in San Angelo, TX
RELATED REPORTS & OPTIONS
Accommodation & Food Services
San Angelo
Compare Zip Codes
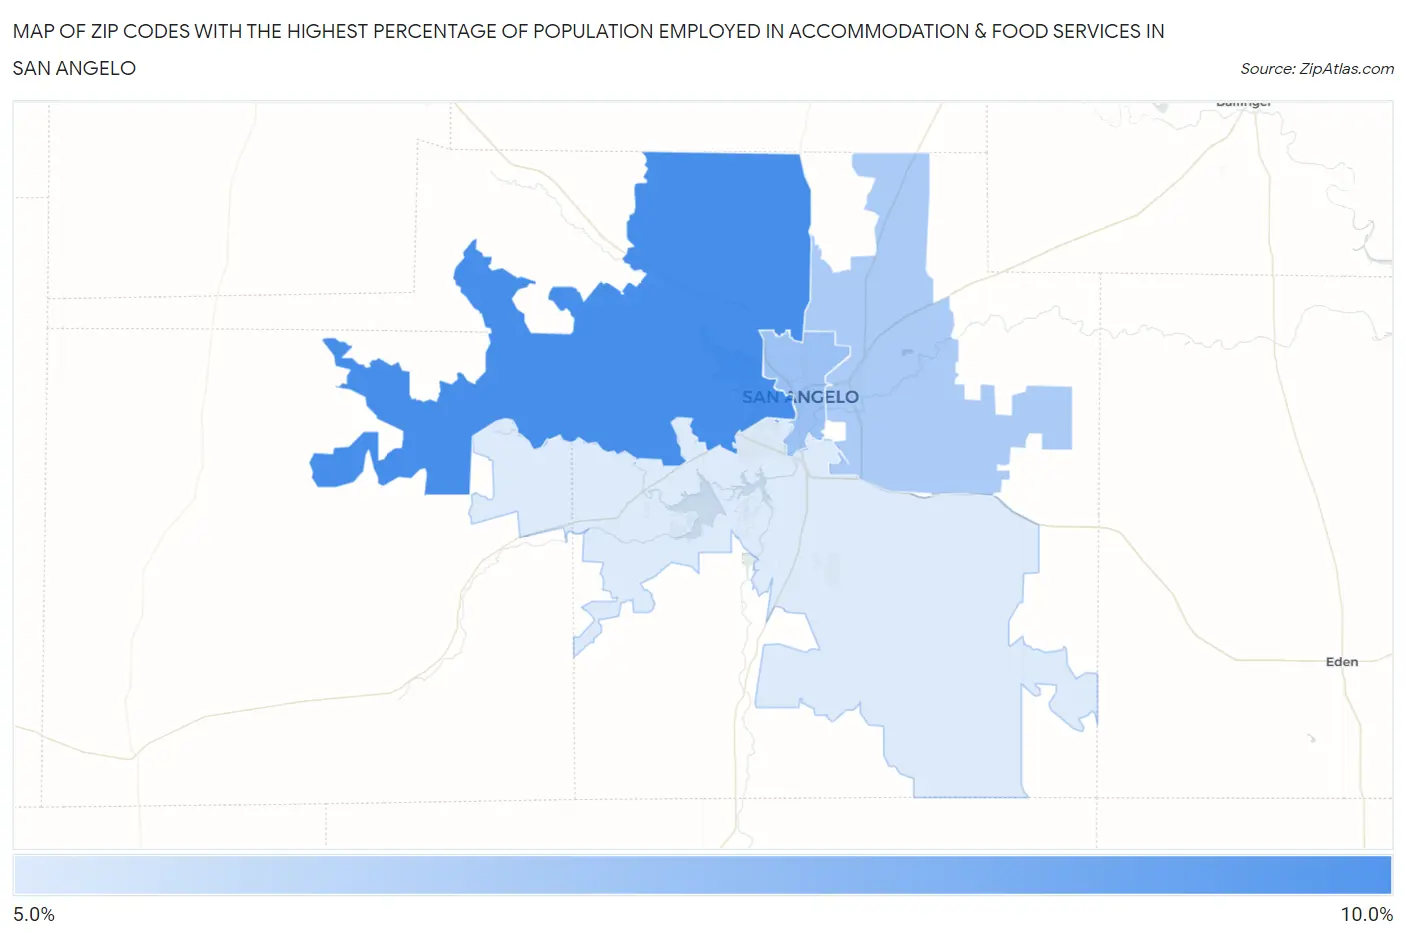
Map of Zip Codes with the Highest Percentage of Population Employed in Accommodation & Food Services in San Angelo
5.7%
9.4%
Zip Codes with the Highest Percentage of Population Employed in Accommodation & Food Services in San Angelo, TX
| Zip Code | % Employed | vs State | vs National | |
| 1. | 76901 | 9.4% | 7.2%(+2.15)#355 | 6.9%(+2.47)#5,418 |
| 2. | 76909 | 8.4% | 7.2%(+1.19)#488 | 6.9%(+1.52)#7,002 |
| 3. | 76903 | 7.3% | 7.2%(+0.084)#671 | 6.9%(+0.409)#9,566 |
| 4. | 76905 | 6.9% | 7.2%(-0.299)#737 | 6.9%(+0.026)#10,578 |
| 5. | 76904 | 5.7% | 7.2%(-1.53)#965 | 6.9%(-1.20)#14,462 |
1
Common Questions
What are the Top 3 Zip Codes with the Highest Percentage of Population Employed in Accommodation & Food Services in San Angelo, TX?
Top 3 Zip Codes with the Highest Percentage of Population Employed in Accommodation & Food Services in San Angelo, TX are:
What zip code has the Highest Percentage of Population Employed in Accommodation & Food Services in San Angelo, TX?
76901 has the Highest Percentage of Population Employed in Accommodation & Food Services in San Angelo, TX with 9.4%.
What is the Percentage of Population Employed in Accommodation & Food Services in San Angelo, TX?
Percentage of Population Employed in Accommodation & Food Services in San Angelo is 7.8%.
What is the Percentage of Population Employed in Accommodation & Food Services in Texas?
Percentage of Population Employed in Accommodation & Food Services in Texas is 7.2%.
What is the Percentage of Population Employed in Accommodation & Food Services in the United States?
Percentage of Population Employed in Accommodation & Food Services in the United States is 6.9%.