Zip Codes with the Highest Percentage of Population Employed in Accommodation & Food Services in Sherman, TX
RELATED REPORTS & OPTIONS
Accommodation & Food Services
Sherman
Compare Zip Codes
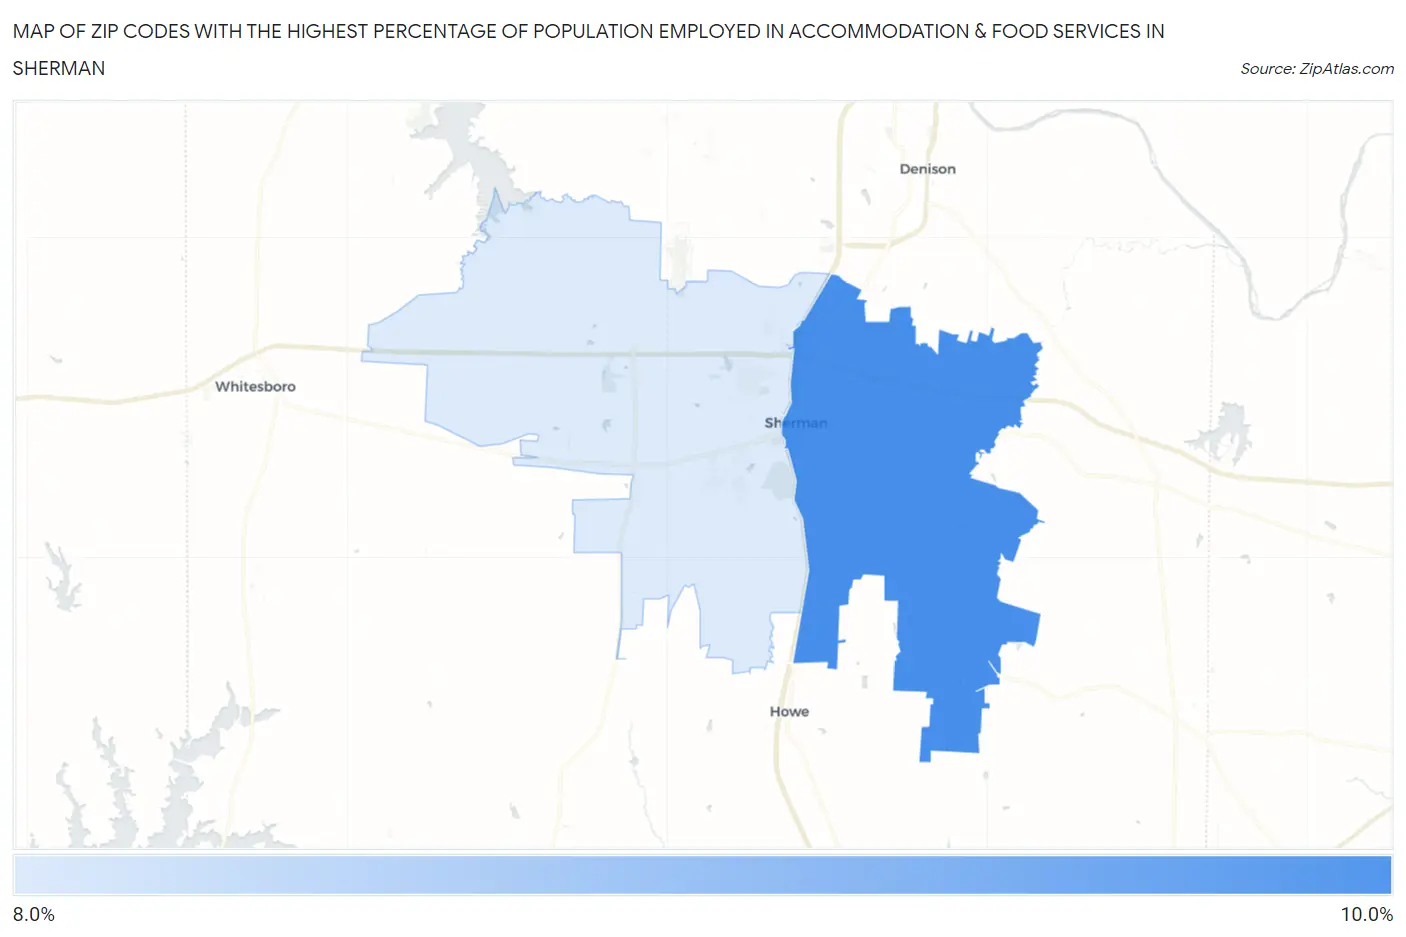
Map of Zip Codes with the Highest Percentage of Population Employed in Accommodation & Food Services in Sherman
8.5%
8.6%
Zip Codes with the Highest Percentage of Population Employed in Accommodation & Food Services in Sherman, TX
| Zip Code | % Employed | vs State | vs National | |
| 1. | 75090 | 8.6% | 7.2%(+1.41)#452 | 6.9%(+1.74)#6,606 |
| 2. | 75092 | 8.5% | 7.2%(+1.32)#472 | 6.9%(+1.64)#6,788 |
1
Common Questions
What are the Top Zip Codes with the Highest Percentage of Population Employed in Accommodation & Food Services in Sherman, TX?
Top Zip Codes with the Highest Percentage of Population Employed in Accommodation & Food Services in Sherman, TX are:
What zip code has the Highest Percentage of Population Employed in Accommodation & Food Services in Sherman, TX?
75090 has the Highest Percentage of Population Employed in Accommodation & Food Services in Sherman, TX with 8.6%.
What is the Percentage of Population Employed in Accommodation & Food Services in Sherman, TX?
Percentage of Population Employed in Accommodation & Food Services in Sherman is 9.1%.
What is the Percentage of Population Employed in Accommodation & Food Services in Texas?
Percentage of Population Employed in Accommodation & Food Services in Texas is 7.2%.
What is the Percentage of Population Employed in Accommodation & Food Services in the United States?
Percentage of Population Employed in Accommodation & Food Services in the United States is 6.9%.