Zip Codes with the Highest Percentage of Population Employed in Accommodation & Food Services in Pearland, TX
RELATED REPORTS & OPTIONS
Accommodation & Food Services
Pearland
Compare Zip Codes
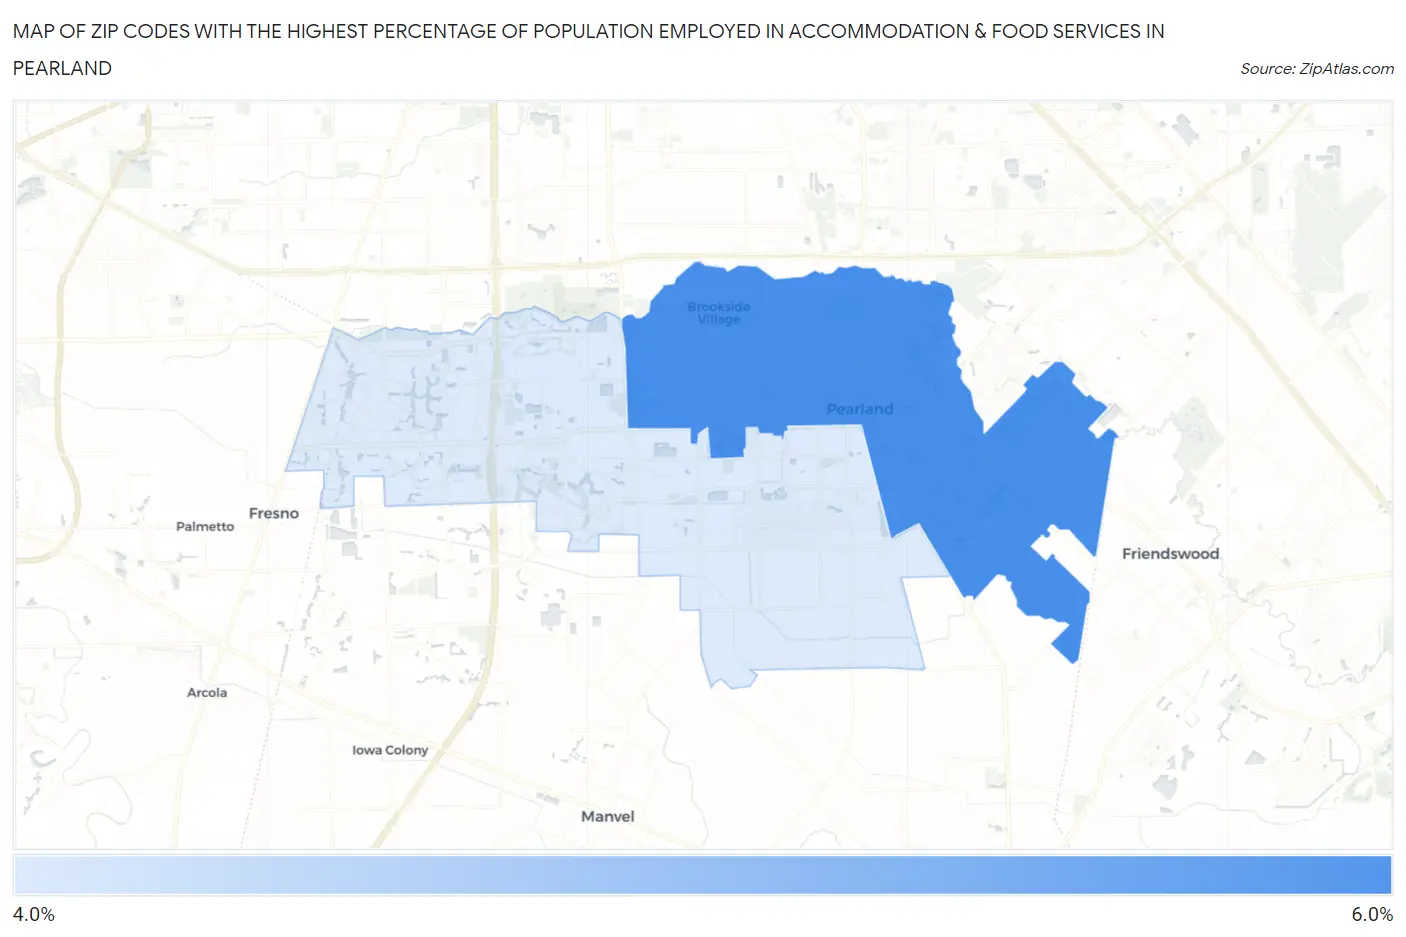
Map of Zip Codes with the Highest Percentage of Population Employed in Accommodation & Food Services in Pearland
4.3%
5.3%
Zip Codes with the Highest Percentage of Population Employed in Accommodation & Food Services in Pearland, TX
| Zip Code | % Employed | vs State | vs National | |
| 1. | 77581 | 5.3% | 7.2%(-1.90)#1,030 | 6.9%(-1.57)#15,755 |
| 2. | 77584 | 4.3% | 7.2%(-2.87)#1,218 | 6.9%(-2.54)#19,052 |
1
Common Questions
What are the Top Zip Codes with the Highest Percentage of Population Employed in Accommodation & Food Services in Pearland, TX?
Top Zip Codes with the Highest Percentage of Population Employed in Accommodation & Food Services in Pearland, TX are:
What zip code has the Highest Percentage of Population Employed in Accommodation & Food Services in Pearland, TX?
77581 has the Highest Percentage of Population Employed in Accommodation & Food Services in Pearland, TX with 5.3%.
What is the Percentage of Population Employed in Accommodation & Food Services in Pearland, TX?
Percentage of Population Employed in Accommodation & Food Services in Pearland is 4.5%.
What is the Percentage of Population Employed in Accommodation & Food Services in Texas?
Percentage of Population Employed in Accommodation & Food Services in Texas is 7.2%.
What is the Percentage of Population Employed in Accommodation & Food Services in the United States?
Percentage of Population Employed in Accommodation & Food Services in the United States is 6.9%.