Southlake, TX Map & Demographics
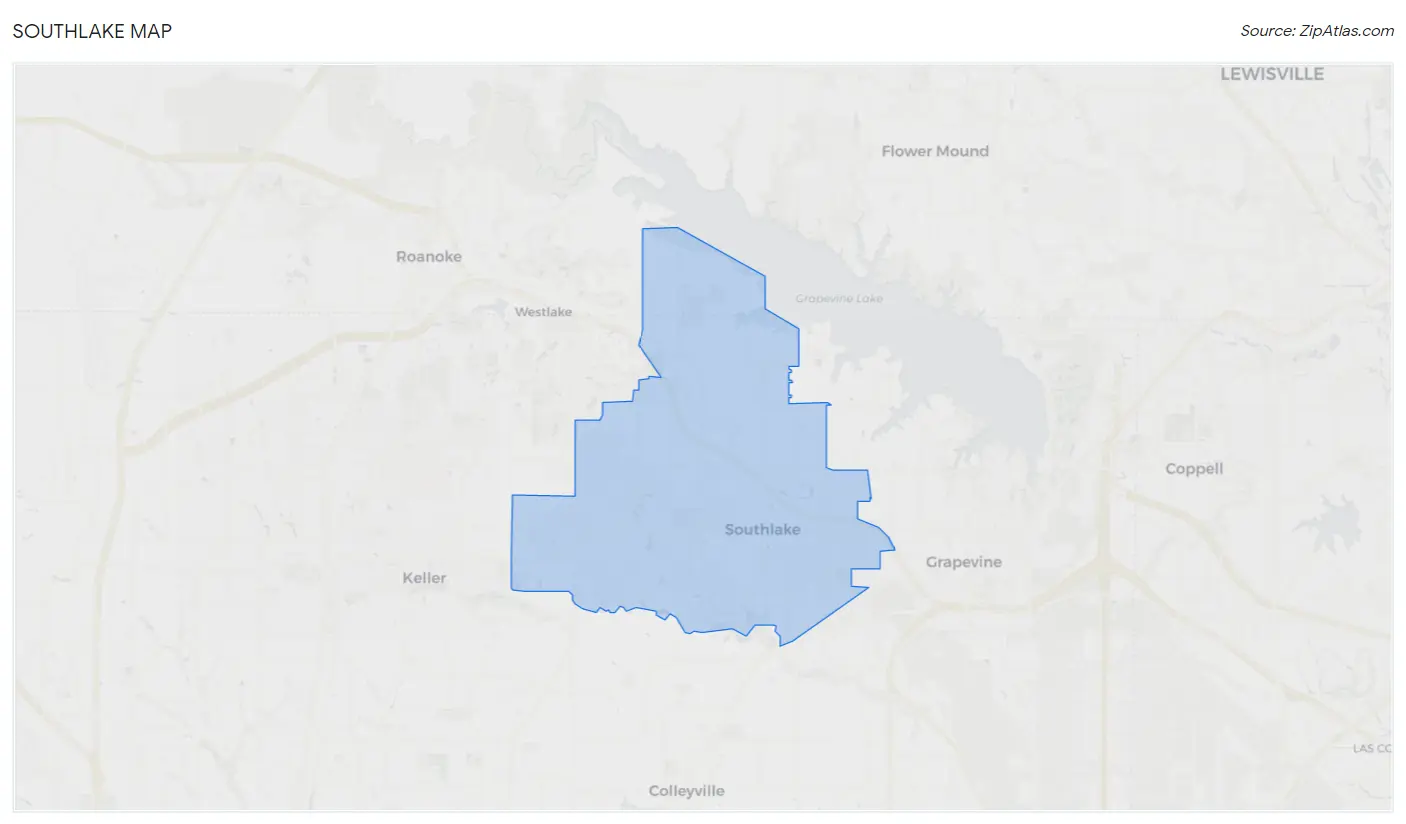
Southlake Map
Southlake Overview
$110,228
PER CAPITA INCOME
$250,001
AVG FAMILY INCOME
$250,001
AVG HOUSEHOLD INCOME
68.7%
WAGE / INCOME GAP [ % ]
31.3¢/ $1
WAGE / INCOME GAP [ $ ]
0.44
INEQUALITY / GINI INDEX
30,779
TOTAL POPULATION
15,078
MALE POPULATION
15,701
FEMALE POPULATION
96.03
MALES / 100 FEMALES
104.13
FEMALES / 100 MALES
42.3
MEDIAN AGE
3.5
AVG FAMILY SIZE
3.3
AVG HOUSEHOLD SIZE
13,276
LABOR FORCE [ PEOPLE ]
60.0%
PERCENT IN LABOR FORCE
2.5%
UNEMPLOYMENT RATE
Southlake Zip Codes
Income in Southlake
Income Overview in Southlake
Per Capita Income in Southlake is $110,228, while median incomes of families and households are $250,001 and $250,001 respectively.
| Characteristic | Number | Measure |
| Per Capita Income | 30,779 | $110,228 |
| Median Family Income | 8,501 | $250,001 |
| Mean Family Income | 8,501 | $372,013 |
| Median Household Income | 9,298 | $250,001 |
| Mean Household Income | 9,298 | $360,078 |
| Income Deficit | 8,501 | $0 |
| Wage / Income Gap (%) | 30,779 | 68.73% |
| Wage / Income Gap ($) | 30,779 | 31.27¢ per $1 |
| Gini / Inequality Index | 30,779 | 0.44 |
Earnings by Sex in Southlake
Average Earnings in Southlake are $126,008, $188,389 for men and $58,918 for women, a difference of 68.7%.
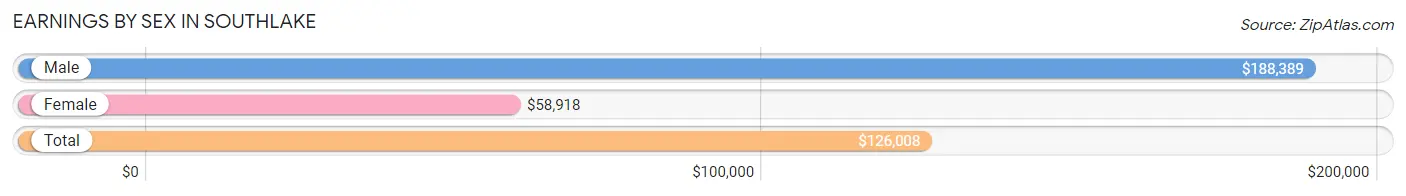
| Sex | Number | Average Earnings |
| Male | 8,268 (59.3%) | $188,389 |
| Female | 5,676 (40.7%) | $58,918 |
| Total | 13,944 (100.0%) | $126,008 |
Earnings by Sex by Income Bracket in Southlake
The most common earnings brackets in Southlake are $100,000+ for men (6,080 | 73.5%) and $100,000+ for women (2,037 | 35.9%).
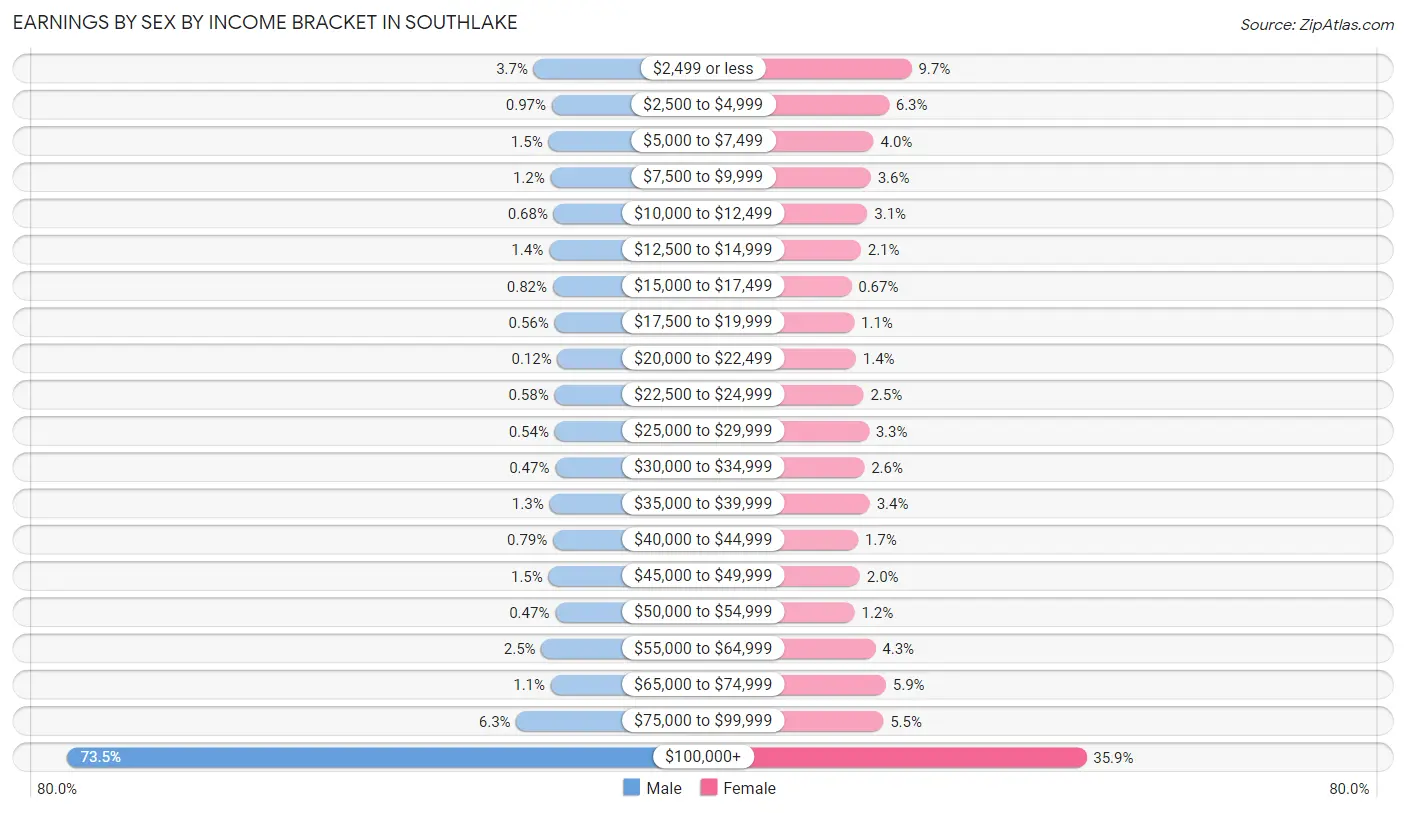
| Income | Male | Female |
| $2,499 or less | 304 (3.7%) | 550 (9.7%) |
| $2,500 to $4,999 | 80 (1.0%) | 357 (6.3%) |
| $5,000 to $7,499 | 122 (1.5%) | 228 (4.0%) |
| $7,500 to $9,999 | 97 (1.2%) | 204 (3.6%) |
| $10,000 to $12,499 | 56 (0.7%) | 175 (3.1%) |
| $12,500 to $14,999 | 116 (1.4%) | 119 (2.1%) |
| $15,000 to $17,499 | 68 (0.8%) | 38 (0.7%) |
| $17,500 to $19,999 | 46 (0.6%) | 62 (1.1%) |
| $20,000 to $22,499 | 10 (0.1%) | 77 (1.4%) |
| $22,500 to $24,999 | 48 (0.6%) | 142 (2.5%) |
| $25,000 to $29,999 | 45 (0.5%) | 187 (3.3%) |
| $30,000 to $34,999 | 39 (0.5%) | 148 (2.6%) |
| $35,000 to $39,999 | 110 (1.3%) | 195 (3.4%) |
| $40,000 to $44,999 | 65 (0.8%) | 95 (1.7%) |
| $45,000 to $49,999 | 121 (1.5%) | 111 (2.0%) |
| $50,000 to $54,999 | 39 (0.5%) | 66 (1.2%) |
| $55,000 to $64,999 | 210 (2.5%) | 243 (4.3%) |
| $65,000 to $74,999 | 93 (1.1%) | 332 (5.9%) |
| $75,000 to $99,999 | 519 (6.3%) | 310 (5.5%) |
| $100,000+ | 6,080 (73.5%) | 2,037 (35.9%) |
| Total | 8,268 (100.0%) | 5,676 (100.0%) |
Earnings by Sex by Educational Attainment in Southlake
Average earnings in Southlake are $205,920 for men and $71,111 for women, a difference of 65.5%. Men with an educational attainment of graduate degree enjoy the highest average annual earnings of $246,875, while those with less than high school education earn the least with $51,908. Women with an educational attainment of graduate degree earn the most with the average annual earnings of $111,912, while those with college or associate's degree education have the smallest earnings of $37,607.
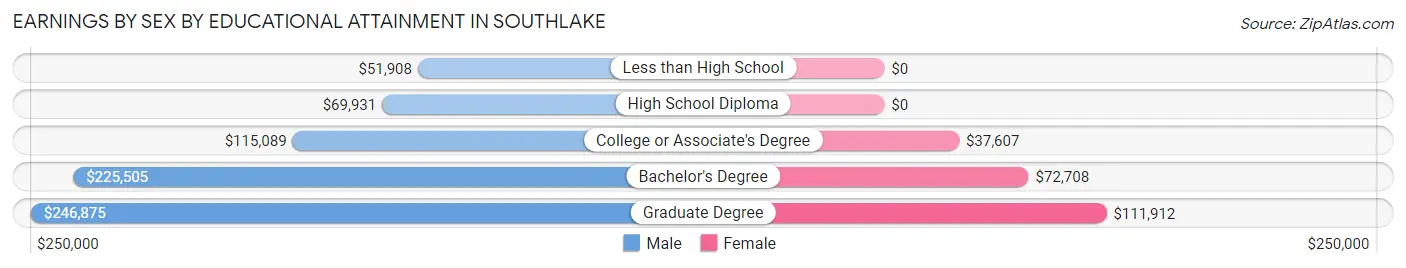
| Educational Attainment | Male Income | Female Income |
| Less than High School | $51,908 | $0 |
| High School Diploma | $69,931 | $0 |
| College or Associate's Degree | $115,089 | $37,607 |
| Bachelor's Degree | $225,505 | $72,708 |
| Graduate Degree | $246,875 | $111,912 |
| Total | $205,920 | $71,111 |
Family Income in Southlake
Family Income Brackets in Southlake
According to the Southlake family income data, there are 5,670 families falling into the $200,000+ income range, which is the most common income bracket and makes up 66.7% of all families. Conversely, the $10,000 to $14,999 income bracket is the least frequent group with only 43 families (0.5%) belonging to this category.
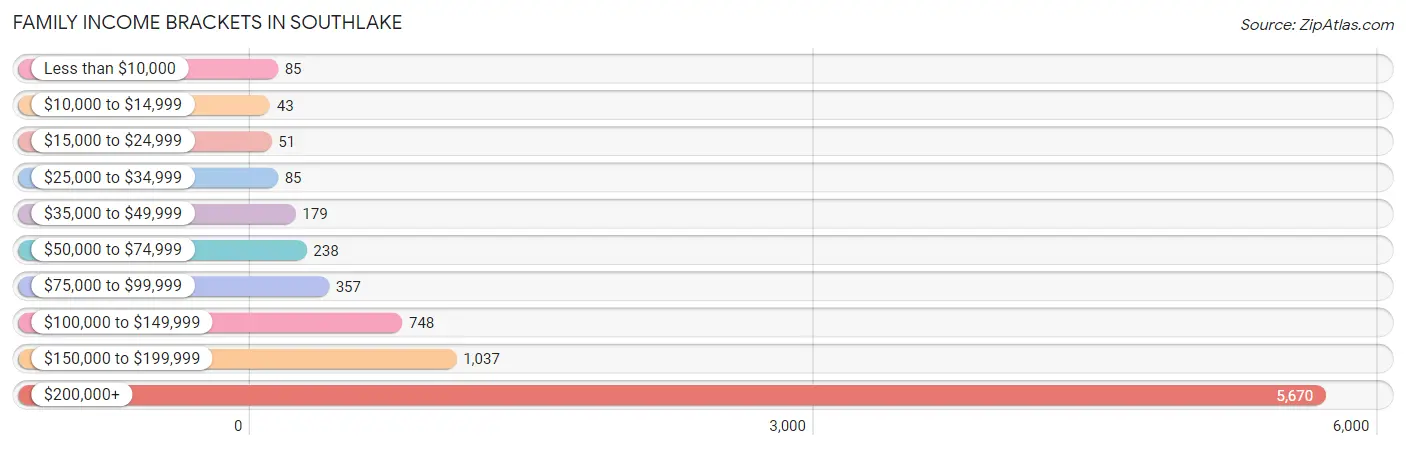
| Income Bracket | # Families | % Families |
| Less than $10,000 | 85 | 1.0% |
| $10,000 to $14,999 | 43 | 0.5% |
| $15,000 to $24,999 | 51 | 0.6% |
| $25,000 to $34,999 | 85 | 1.0% |
| $35,000 to $49,999 | 179 | 2.1% |
| $50,000 to $74,999 | 238 | 2.8% |
| $75,000 to $99,999 | 357 | 4.2% |
| $100,000 to $149,999 | 748 | 8.8% |
| $150,000 to $199,999 | 1,037 | 12.2% |
| $200,000+ | 5,670 | 66.7% |
Family Income by Famaliy Size in Southlake
3-person families (1,811 | 21.3%) account for the highest median family income in Southlake with $250,001 per family, while 2-person families (2,921 | 34.4%) have the highest median income of $102,902 per family member.
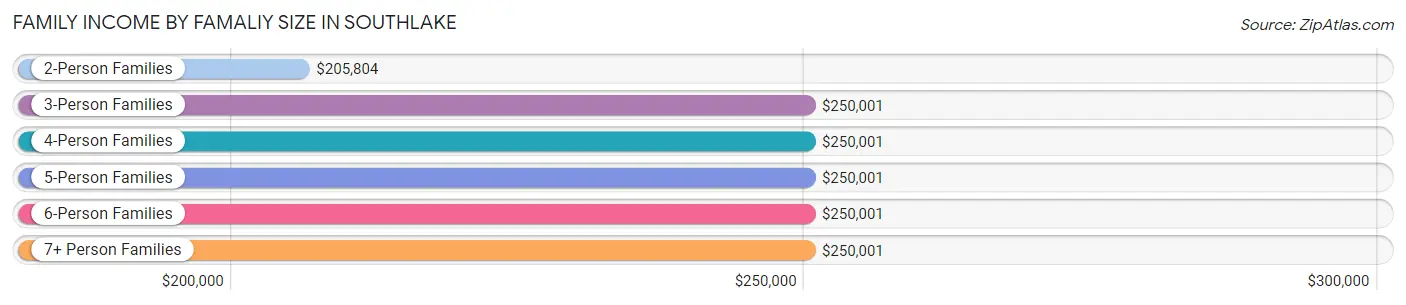
| Income Bracket | # Families | Median Income |
| 2-Person Families | 2,921 (34.4%) | $205,804 |
| 3-Person Families | 1,811 (21.3%) | $250,001 |
| 4-Person Families | 2,355 (27.7%) | $250,001 |
| 5-Person Families | 894 (10.5%) | $250,001 |
| 6-Person Families | 386 (4.5%) | $250,001 |
| 7+ Person Families | 134 (1.6%) | $250,001 |
| Total | 8,501 (100.0%) | $250,001 |
Family Income by Number of Earners in Southlake
The median family income in Southlake is $250,001, with families comprising 1 earner (3,082) having the highest median family income of $250,001, while families with no earners (859) have the lowest median family income of $120,094, accounting for 36.2% and 10.1% of families, respectively.
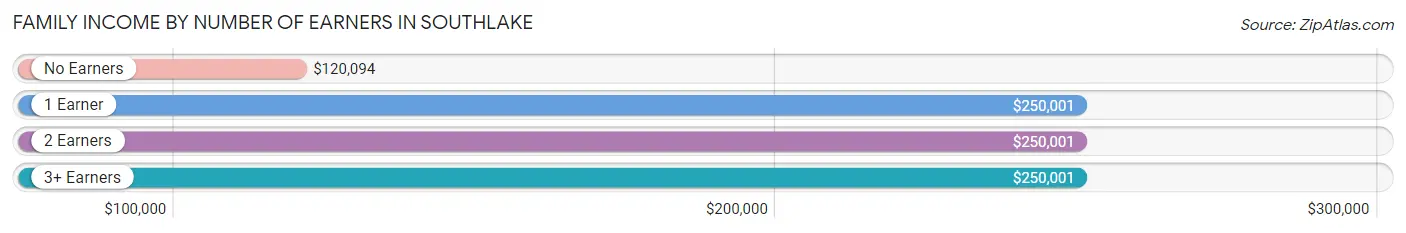
| Number of Earners | # Families | Median Income |
| No Earners | 859 (10.1%) | $120,094 |
| 1 Earner | 3,082 (36.2%) | $250,001 |
| 2 Earners | 3,971 (46.7%) | $250,001 |
| 3+ Earners | 589 (6.9%) | $250,001 |
| Total | 8,501 (100.0%) | $250,001 |
Household Income in Southlake
Household Income Brackets in Southlake
With 5,979 households falling in the category, the $200,000+ income range is the most frequent in Southlake, accounting for 64.3% of all households. In contrast, only 46 households (0.5%) fall into the $10,000 to $14,999 income bracket, making it the least populous group.
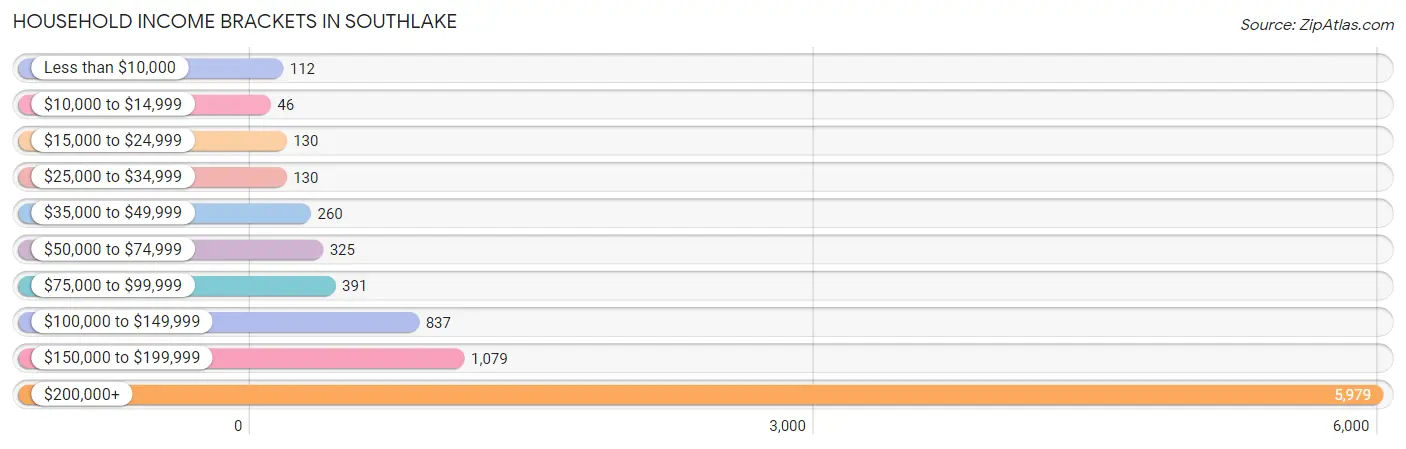
| Income Bracket | # Households | % Households |
| Less than $10,000 | 112 | 1.2% |
| $10,000 to $14,999 | 46 | 0.5% |
| $15,000 to $24,999 | 130 | 1.4% |
| $25,000 to $34,999 | 130 | 1.4% |
| $35,000 to $49,999 | 260 | 2.8% |
| $50,000 to $74,999 | 325 | 3.5% |
| $75,000 to $99,999 | 391 | 4.2% |
| $100,000 to $149,999 | 837 | 9.0% |
| $150,000 to $199,999 | 1,079 | 11.6% |
| $200,000+ | 5,979 | 64.3% |
Household Income by Householder Age in Southlake
The median household income in Southlake is $250,001, with the highest median household income of $250,001 found in the 25 to 44 years age bracket for the primary householder. A total of 2,018 households (21.7%) fall into this category. Meanwhile, the 15 to 24 years age bracket for the primary householder has the lowest median household income of $0, with 7 households (0.1%) in this group.
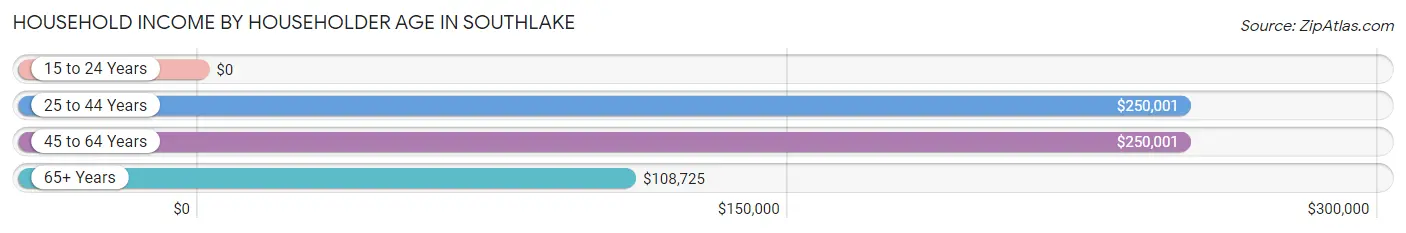
| Income Bracket | # Households | Median Income |
| 15 to 24 Years | 7 (0.1%) | $0 |
| 25 to 44 Years | 2,018 (21.7%) | $250,001 |
| 45 to 64 Years | 5,425 (58.4%) | $250,001 |
| 65+ Years | 1,848 (19.9%) | $108,725 |
| Total | 9,298 (100.0%) | $250,001 |
Poverty in Southlake
Income Below Poverty by Sex and Age in Southlake
With 1.3% poverty level for males and 2.7% for females among the residents of Southlake, 15 year old males and 18 to 24 year old females are the most vulnerable to poverty, with 22 males (7.2%) and 66 females (9.5%) in their respective age groups living below the poverty level.
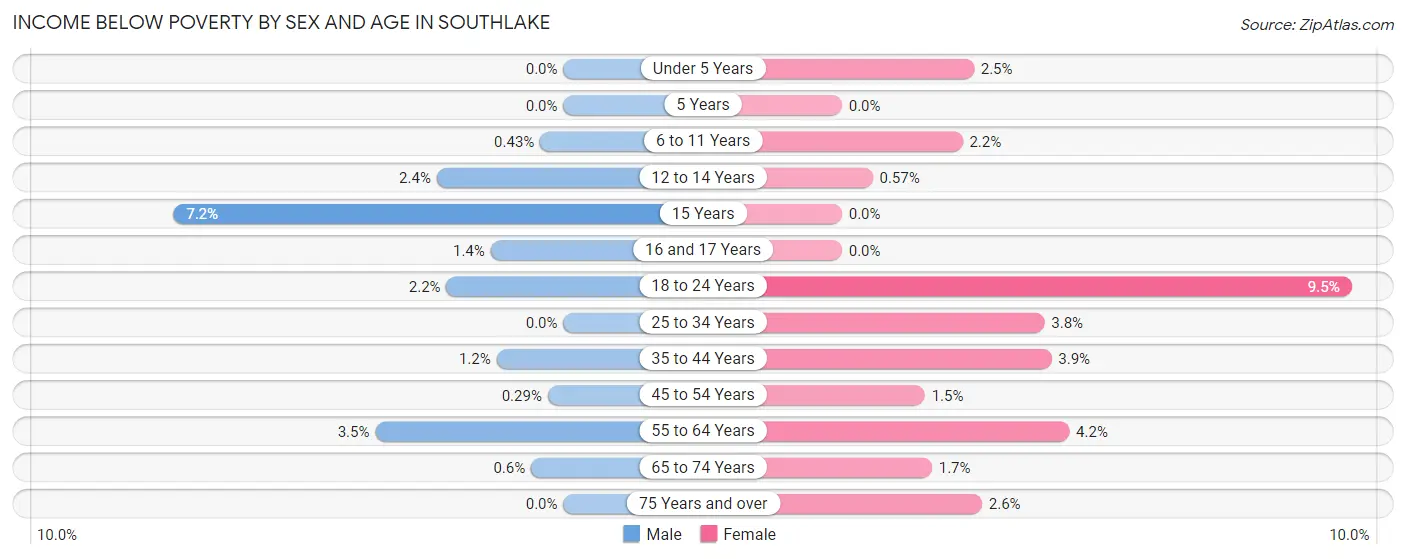
| Age Bracket | Male | Female |
| Under 5 Years | 0 (0.0%) | 18 (2.5%) |
| 5 Years | 0 (0.0%) | 0 (0.0%) |
| 6 to 11 Years | 8 (0.4%) | 42 (2.2%) |
| 12 to 14 Years | 23 (2.4%) | 7 (0.6%) |
| 15 Years | 22 (7.2%) | 0 (0.0%) |
| 16 and 17 Years | 8 (1.3%) | 0 (0.0%) |
| 18 to 24 Years | 17 (2.2%) | 66 (9.5%) |
| 25 to 34 Years | 0 (0.0%) | 26 (3.8%) |
| 35 to 44 Years | 22 (1.2%) | 91 (3.9%) |
| 45 to 54 Years | 9 (0.3%) | 41 (1.5%) |
| 55 to 64 Years | 83 (3.5%) | 84 (4.2%) |
| 65 to 74 Years | 7 (0.6%) | 20 (1.7%) |
| 75 Years and over | 0 (0.0%) | 25 (2.6%) |
| Total | 199 (1.3%) | 420 (2.7%) |
Income Above Poverty by Sex and Age in Southlake
According to the poverty statistics in Southlake, males aged under 5 years and females aged 5 years are the age groups that are most secure financially, with 100.0% of males and 100.0% of females in these age groups living above the poverty line.
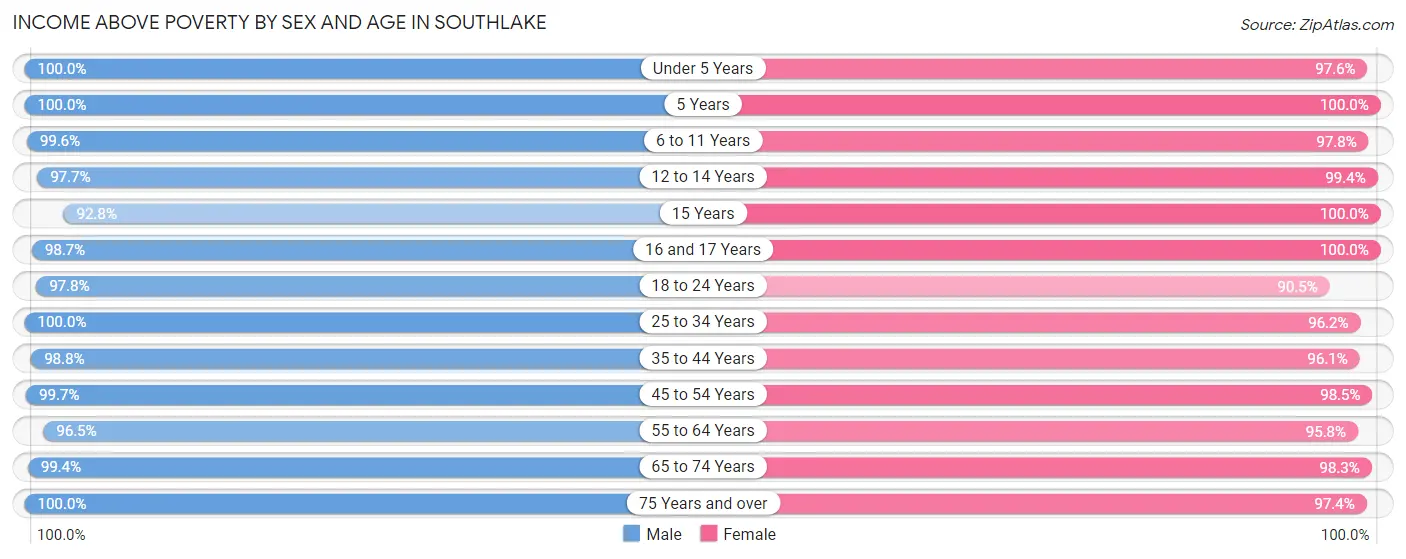
| Age Bracket | Male | Female |
| Under 5 Years | 876 (100.0%) | 718 (97.6%) |
| 5 Years | 246 (100.0%) | 69 (100.0%) |
| 6 to 11 Years | 1,868 (99.6%) | 1,829 (97.8%) |
| 12 to 14 Years | 956 (97.7%) | 1,212 (99.4%) |
| 15 Years | 282 (92.8%) | 466 (100.0%) |
| 16 and 17 Years | 583 (98.7%) | 735 (100.0%) |
| 18 to 24 Years | 768 (97.8%) | 632 (90.5%) |
| 25 to 34 Years | 364 (100.0%) | 666 (96.2%) |
| 35 to 44 Years | 1,752 (98.8%) | 2,247 (96.1%) |
| 45 to 54 Years | 3,048 (99.7%) | 2,618 (98.5%) |
| 55 to 64 Years | 2,293 (96.5%) | 1,908 (95.8%) |
| 65 to 74 Years | 1,162 (99.4%) | 1,180 (98.3%) |
| 75 Years and over | 647 (100.0%) | 937 (97.4%) |
| Total | 14,845 (98.7%) | 15,217 (97.3%) |
Income Below Poverty Among Married-Couple Families in Southlake
The poverty statistics for married-couple families in Southlake show that 1.5% or 119 of the total 7,902 families live below the poverty line. Families with no children have the highest poverty rate of 1.9%, comprising of 67 families. On the other hand, families with 5 or more children have the lowest poverty rate of 0.0%, which includes 0 families.
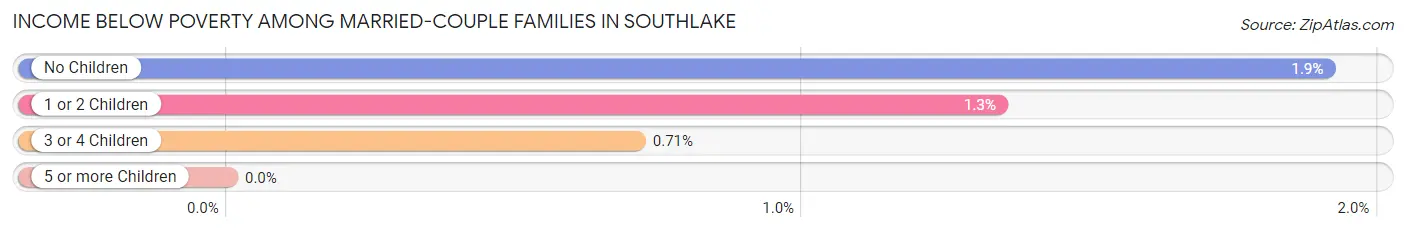
| Children | Above Poverty | Below Poverty |
| No Children | 3,445 (98.1%) | 67 (1.9%) |
| 1 or 2 Children | 3,304 (98.7%) | 45 (1.3%) |
| 3 or 4 Children | 976 (99.3%) | 7 (0.7%) |
| 5 or more Children | 58 (100.0%) | 0 (0.0%) |
| Total | 7,783 (98.5%) | 119 (1.5%) |
Income Below Poverty Among Single-Parent Households in Southlake
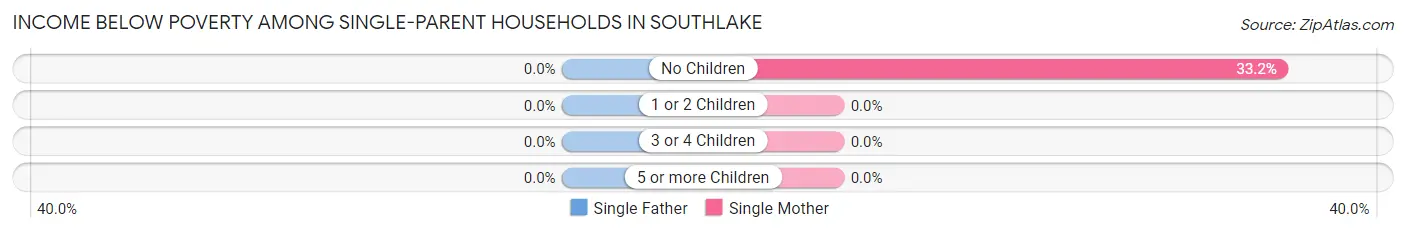
| Children | Single Father | Single Mother |
| No Children | 0 (0.0%) | 60 (33.2%) |
| 1 or 2 Children | 0 (0.0%) | 0 (0.0%) |
| 3 or 4 Children | 0 (0.0%) | 0 (0.0%) |
| 5 or more Children | 0 (0.0%) | 0 (0.0%) |
| Total | 0 (0.0%) | 60 (19.0%) |
Income Below Poverty Among Married-Couple vs Single-Parent Households in Southlake
The poverty data for Southlake shows that 119 of the married-couple family households (1.5%) and 60 of the single-parent households (10.0%) are living below the poverty level. Within the married-couple family households, those with no children have the highest poverty rate, with 67 households (1.9%) falling below the poverty line. Among the single-parent households, those with no children have the highest poverty rate, with 60 household (23.2%) living below poverty.
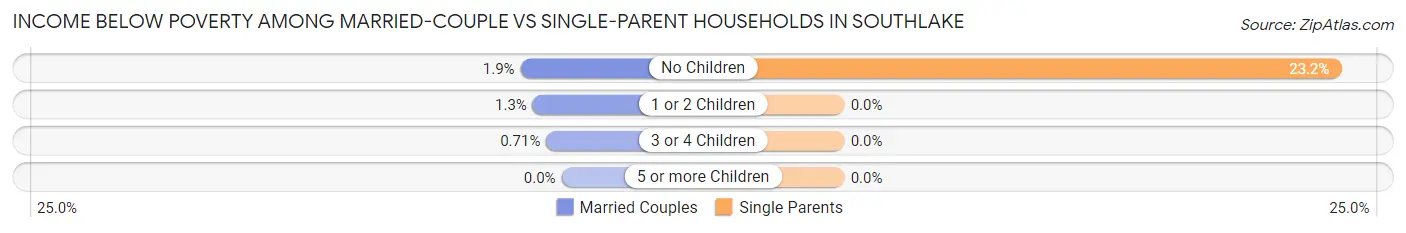
| Children | Married-Couple Families | Single-Parent Households |
| No Children | 67 (1.9%) | 60 (23.2%) |
| 1 or 2 Children | 45 (1.3%) | 0 (0.0%) |
| 3 or 4 Children | 7 (0.7%) | 0 (0.0%) |
| 5 or more Children | 0 (0.0%) | 0 (0.0%) |
| Total | 119 (1.5%) | 60 (10.0%) |
Race in Southlake
The most populous races in Southlake are White / Caucasian (23,302 | 75.7%), Asian (5,230 | 17.0%), and Hispanic or Latino (2,732 | 8.9%).
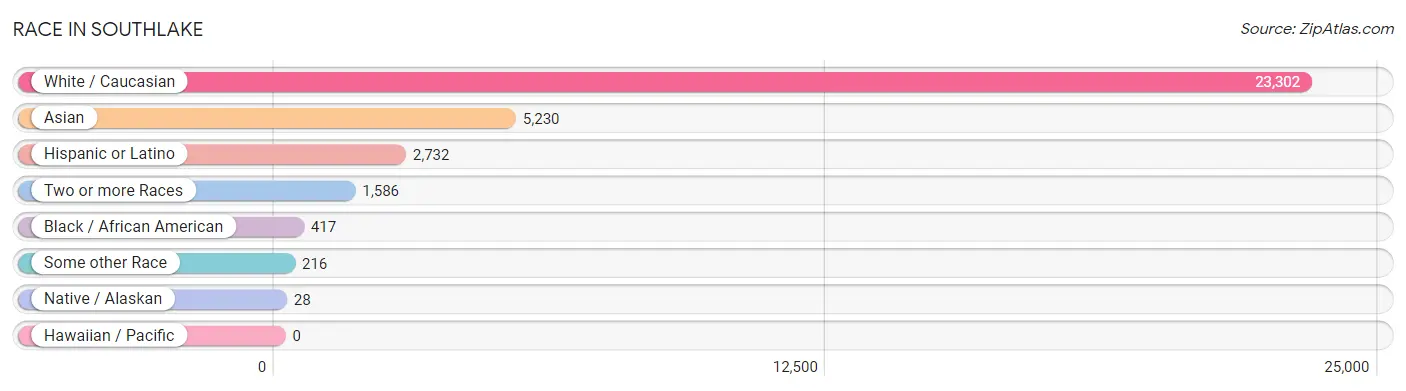
| Race | # Population | % Population |
| Asian | 5,230 | 17.0% |
| Black / African American | 417 | 1.3% |
| Hawaiian / Pacific | 0 | 0.0% |
| Hispanic or Latino | 2,732 | 8.9% |
| Native / Alaskan | 28 | 0.1% |
| White / Caucasian | 23,302 | 75.7% |
| Two or more Races | 1,586 | 5.1% |
| Some other Race | 216 | 0.7% |
| Total | 30,779 | 100.0% |
Ancestry in Southlake
The most populous ancestries reported in Southlake are English (5,428 | 17.6%), German (4,237 | 13.8%), Irish (3,727 | 12.1%), Thai (2,498 | 8.1%), and Indian (Asian) (1,700 | 5.5%), together accounting for 57.2% of all Southlake residents.
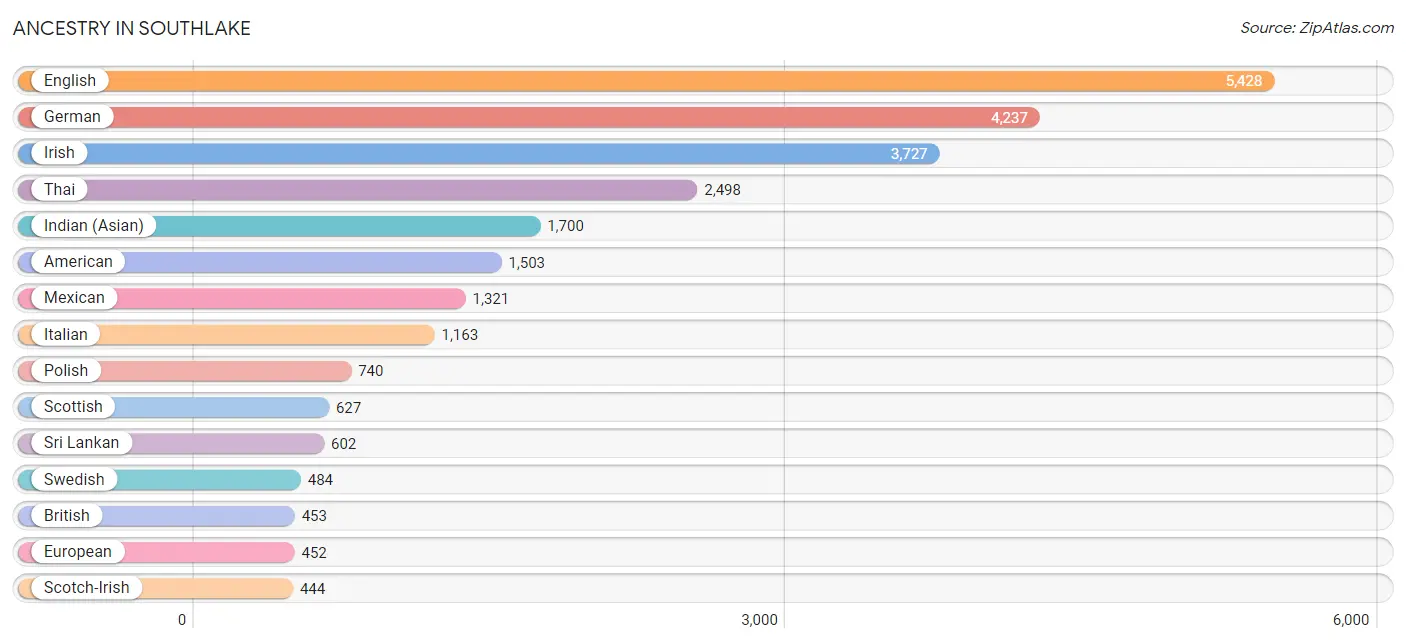
| Ancestry | # Population | % Population |
| American | 1,503 | 4.9% |
| Arab | 216 | 0.7% |
| Arapaho | 108 | 0.4% |
| Argentinean | 59 | 0.2% |
| Austrian | 119 | 0.4% |
| Bahamian | 14 | 0.1% |
| Belgian | 28 | 0.1% |
| Bhutanese | 16 | 0.1% |
| Blackfeet | 21 | 0.1% |
| Brazilian | 127 | 0.4% |
| British | 453 | 1.5% |
| Burmese | 325 | 1.1% |
| Cajun | 41 | 0.1% |
| Canadian | 78 | 0.3% |
| Central American | 52 | 0.2% |
| Central American Indian | 22 | 0.1% |
| Cherokee | 44 | 0.1% |
| Chickasaw | 9 | 0.0% |
| Chinese | 13 | 0.0% |
| Chippewa | 9 | 0.0% |
| Colombian | 36 | 0.1% |
| Costa Rican | 11 | 0.0% |
| Croatian | 93 | 0.3% |
| Cuban | 25 | 0.1% |
| Czech | 218 | 0.7% |
| Danish | 117 | 0.4% |
| Dutch | 388 | 1.3% |
| Eastern European | 54 | 0.2% |
| Ecuadorian | 195 | 0.6% |
| Egyptian | 45 | 0.2% |
| English | 5,428 | 17.6% |
| Estonian | 43 | 0.1% |
| European | 452 | 1.5% |
| Filipino | 334 | 1.1% |
| Finnish | 72 | 0.2% |
| French | 413 | 1.3% |
| French Canadian | 42 | 0.1% |
| German | 4,237 | 13.8% |
| Greek | 153 | 0.5% |
| Guamanian / Chamorro | 34 | 0.1% |
| Guatemalan | 22 | 0.1% |
| Guyanese | 32 | 0.1% |
| Haitian | 28 | 0.1% |
| Hungarian | 234 | 0.8% |
| Indian (Asian) | 1,700 | 5.5% |
| Iranian | 172 | 0.6% |
| Irish | 3,727 | 12.1% |
| Italian | 1,163 | 3.8% |
| Jamaican | 71 | 0.2% |
| Korean | 245 | 0.8% |
| Lebanese | 64 | 0.2% |
| Lithuanian | 119 | 0.4% |
| Mexican | 1,321 | 4.3% |
| Mongolian | 39 | 0.1% |
| Moroccan | 15 | 0.1% |
| Nigerian | 132 | 0.4% |
| Northern European | 40 | 0.1% |
| Norwegian | 215 | 0.7% |
| Panamanian | 19 | 0.1% |
| Pennsylvania German | 25 | 0.1% |
| Peruvian | 77 | 0.3% |
| Polish | 740 | 2.4% |
| Portuguese | 54 | 0.2% |
| Puerto Rican | 234 | 0.8% |
| Romanian | 68 | 0.2% |
| Russian | 179 | 0.6% |
| Scandinavian | 55 | 0.2% |
| Scotch-Irish | 444 | 1.4% |
| Scottish | 627 | 2.0% |
| Slavic | 47 | 0.2% |
| South African | 41 | 0.1% |
| South American | 367 | 1.2% |
| Spaniard | 318 | 1.0% |
| Spanish | 95 | 0.3% |
| Sri Lankan | 602 | 2.0% |
| Subsaharan African | 173 | 0.6% |
| Swedish | 484 | 1.6% |
| Swiss | 43 | 0.1% |
| Thai | 2,498 | 8.1% |
| Turkish | 59 | 0.2% |
| Ukrainian | 20 | 0.1% |
| Welsh | 279 | 0.9% |
| Yugoslavian | 117 | 0.4% | View All 83 Rows |
Immigrants in Southlake
The most numerous immigrant groups reported in Southlake came from Asia (2,693 | 8.7%), South Central Asia (1,542 | 5.0%), India (1,430 | 4.6%), Europe (917 | 3.0%), and Latin America (855 | 2.8%), together accounting for 24.2% of all Southlake residents.
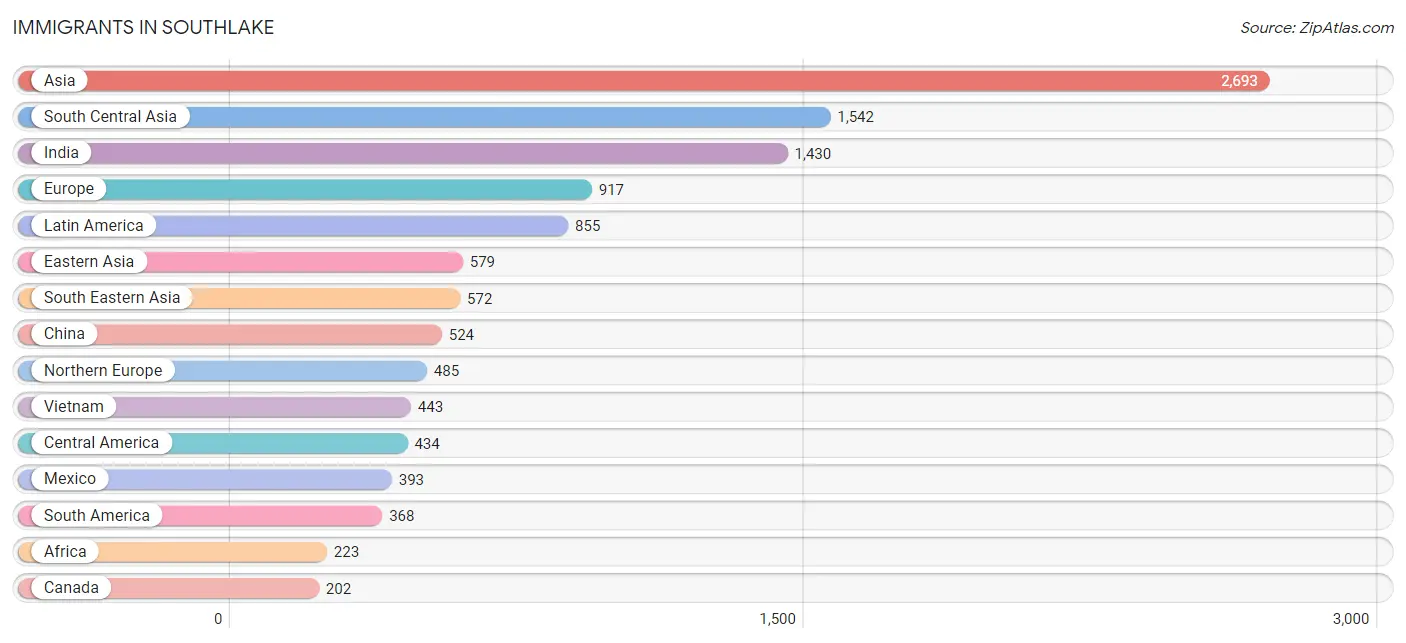
| Immigration Origin | # Population | % Population |
| Africa | 223 | 0.7% |
| Argentina | 146 | 0.5% |
| Asia | 2,693 | 8.7% |
| Bangladesh | 19 | 0.1% |
| Brazil | 79 | 0.3% |
| Canada | 202 | 0.7% |
| Caribbean | 53 | 0.2% |
| Central America | 434 | 1.4% |
| China | 524 | 1.7% |
| Colombia | 9 | 0.0% |
| Cuba | 8 | 0.0% |
| Eastern Africa | 57 | 0.2% |
| Eastern Asia | 579 | 1.9% |
| Eastern Europe | 132 | 0.4% |
| Ecuador | 59 | 0.2% |
| Egypt | 22 | 0.1% |
| England | 45 | 0.2% |
| Europe | 917 | 3.0% |
| Germany | 122 | 0.4% |
| Guatemala | 22 | 0.1% |
| Guyana | 14 | 0.1% |
| Haiti | 14 | 0.1% |
| Hong Kong | 35 | 0.1% |
| India | 1,430 | 4.6% |
| Iran | 32 | 0.1% |
| Italy | 92 | 0.3% |
| Jamaica | 19 | 0.1% |
| Kenya | 25 | 0.1% |
| Korea | 55 | 0.2% |
| Laos | 10 | 0.0% |
| Latin America | 855 | 2.8% |
| Malaysia | 66 | 0.2% |
| Mexico | 393 | 1.3% |
| Morocco | 30 | 0.1% |
| Netherlands | 34 | 0.1% |
| Nigeria | 42 | 0.1% |
| Northern Africa | 83 | 0.3% |
| Northern Europe | 485 | 1.6% |
| Pakistan | 50 | 0.2% |
| Panama | 19 | 0.1% |
| Peru | 61 | 0.2% |
| Philippines | 53 | 0.2% |
| Poland | 18 | 0.1% |
| Romania | 7 | 0.0% |
| Russia | 31 | 0.1% |
| South Africa | 41 | 0.1% |
| South America | 368 | 1.2% |
| South Central Asia | 1,542 | 5.0% |
| South Eastern Asia | 572 | 1.9% |
| Southern Europe | 114 | 0.4% |
| Spain | 22 | 0.1% |
| Switzerland | 30 | 0.1% |
| Taiwan | 163 | 0.5% |
| Trinidad and Tobago | 12 | 0.0% |
| Ukraine | 20 | 0.1% |
| Uzbekistan | 11 | 0.0% |
| Vietnam | 443 | 1.4% |
| Western Africa | 42 | 0.1% |
| Western Europe | 186 | 0.6% |
| Zimbabwe | 14 | 0.1% | View All 60 Rows |
Sex and Age in Southlake
Sex and Age in Southlake
The most populous age groups in Southlake are 10 to 14 Years (1,790 | 11.9%) for men and 10 to 14 Years (2,113 | 13.5%) for women.
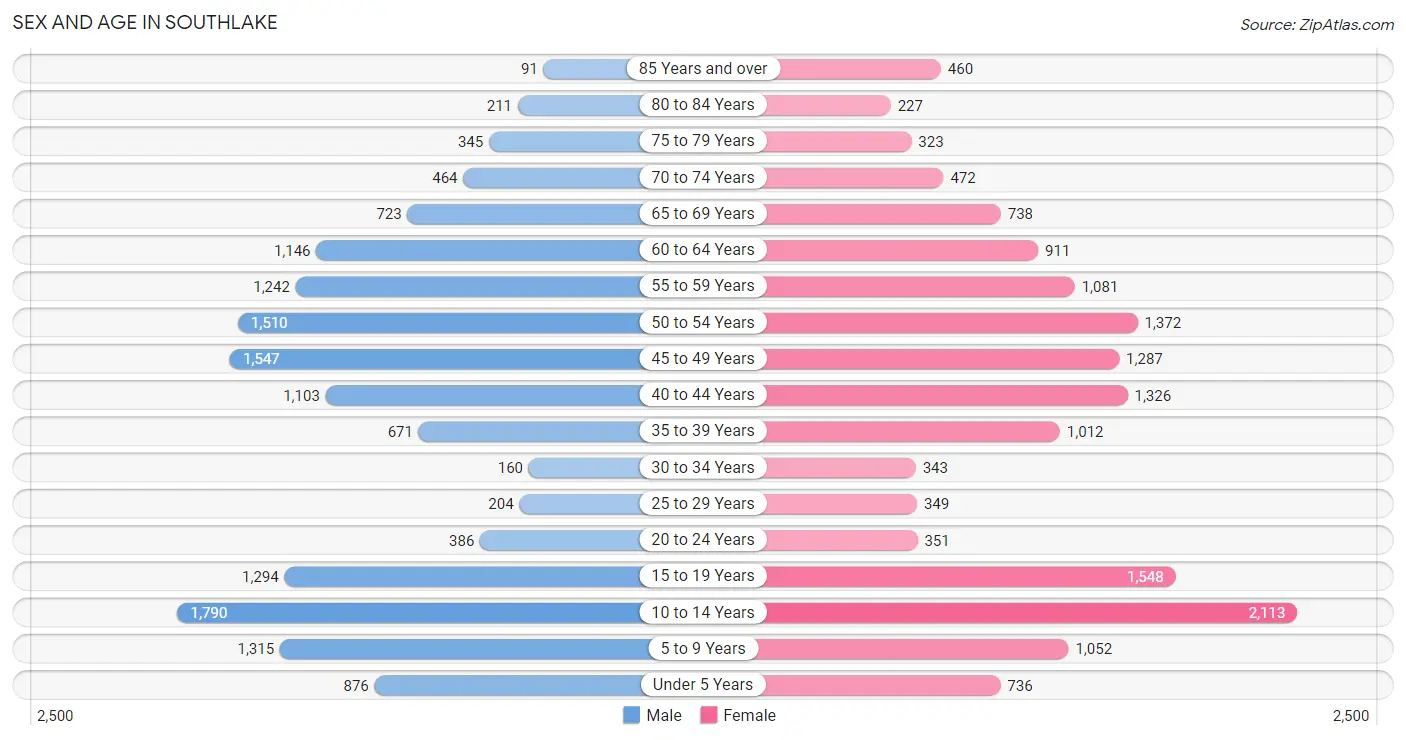
| Age Bracket | Male | Female |
| Under 5 Years | 876 (5.8%) | 736 (4.7%) |
| 5 to 9 Years | 1,315 (8.7%) | 1,052 (6.7%) |
| 10 to 14 Years | 1,790 (11.9%) | 2,113 (13.5%) |
| 15 to 19 Years | 1,294 (8.6%) | 1,548 (9.9%) |
| 20 to 24 Years | 386 (2.6%) | 351 (2.2%) |
| 25 to 29 Years | 204 (1.3%) | 349 (2.2%) |
| 30 to 34 Years | 160 (1.1%) | 343 (2.2%) |
| 35 to 39 Years | 671 (4.4%) | 1,012 (6.5%) |
| 40 to 44 Years | 1,103 (7.3%) | 1,326 (8.5%) |
| 45 to 49 Years | 1,547 (10.3%) | 1,287 (8.2%) |
| 50 to 54 Years | 1,510 (10.0%) | 1,372 (8.7%) |
| 55 to 59 Years | 1,242 (8.2%) | 1,081 (6.9%) |
| 60 to 64 Years | 1,146 (7.6%) | 911 (5.8%) |
| 65 to 69 Years | 723 (4.8%) | 738 (4.7%) |
| 70 to 74 Years | 464 (3.1%) | 472 (3.0%) |
| 75 to 79 Years | 345 (2.3%) | 323 (2.1%) |
| 80 to 84 Years | 211 (1.4%) | 227 (1.5%) |
| 85 Years and over | 91 (0.6%) | 460 (2.9%) |
| Total | 15,078 (100.0%) | 15,701 (100.0%) |
Families and Households in Southlake
Median Family Size in Southlake
The median family size in Southlake is 3.47 persons per family, with married-couple families (7,902 | 92.9%) accounting for the largest median family size of 3.49 persons per family. On the other hand, single male/father families (283 | 3.3%) represent the smallest median family size with 2.93 persons per family.
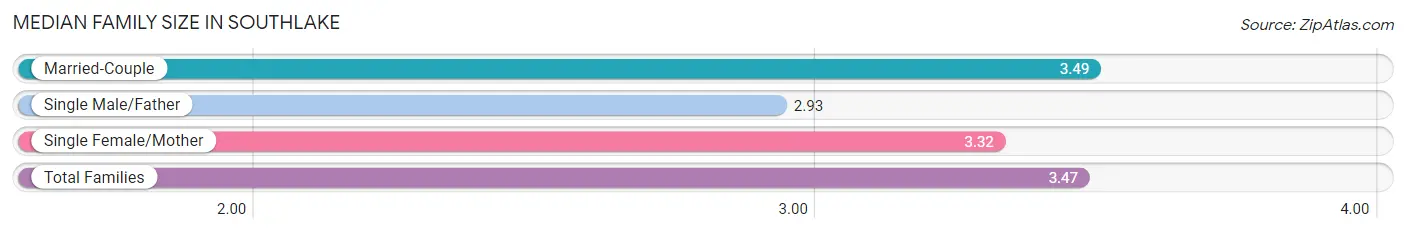
| Family Type | # Families | Family Size |
| Married-Couple | 7,902 (92.9%) | 3.49 |
| Single Male/Father | 283 (3.3%) | 2.93 |
| Single Female/Mother | 316 (3.7%) | 3.32 |
| Total Families | 8,501 (100.0%) | 3.47 |
Median Household Size in Southlake
The median household size in Southlake is 3.30 persons per household, with married-couple households (7,902 | 85.0%) accounting for the largest median household size of 3.52 persons per household. non-family households (797 | 8.6%) represent the smallest median household size with 1.24 persons per household.
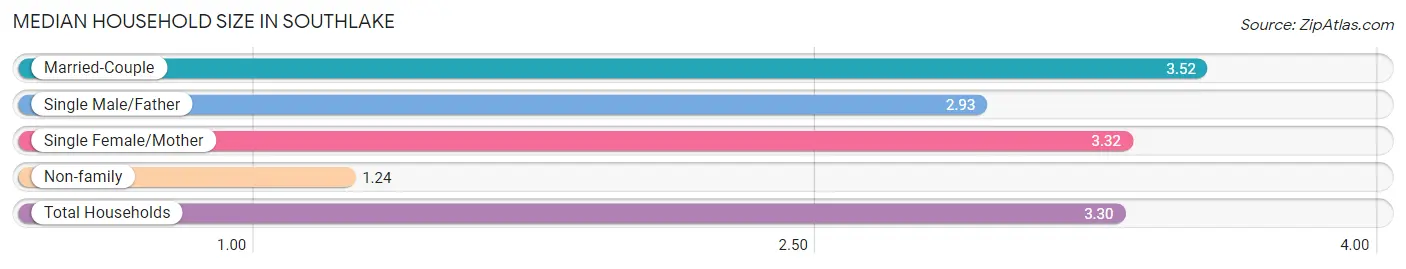
| Household Type | # Households | Household Size |
| Married-Couple | 7,902 (85.0%) | 3.52 |
| Single Male/Father | 283 (3.0%) | 2.93 |
| Single Female/Mother | 316 (3.4%) | 3.32 |
| Non-family | 797 (8.6%) | 1.24 |
| Total Households | 9,298 (100.0%) | 3.30 |
Household Size by Marriage Status in Southlake
Out of a total of 9,298 households in Southlake, 8,501 (91.4%) are family households, while 797 (8.6%) are nonfamily households. The most numerous type of family households are 2-person households, comprising 2,866, and the most common type of nonfamily households are 1-person households, comprising 683.
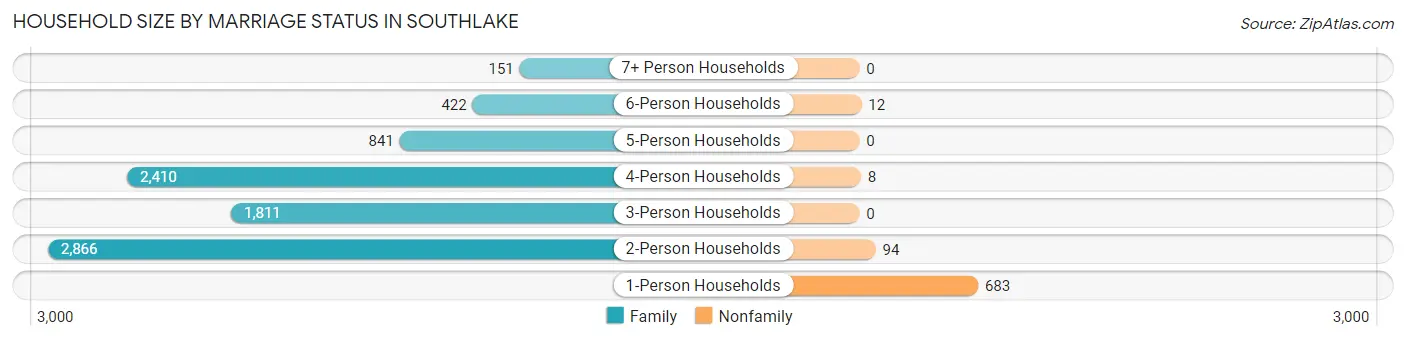
| Household Size | Family Households | Nonfamily Households |
| 1-Person Households | - | 683 (7.3%) |
| 2-Person Households | 2,866 (30.8%) | 94 (1.0%) |
| 3-Person Households | 1,811 (19.5%) | 0 (0.0%) |
| 4-Person Households | 2,410 (25.9%) | 8 (0.1%) |
| 5-Person Households | 841 (9.0%) | 0 (0.0%) |
| 6-Person Households | 422 (4.5%) | 12 (0.1%) |
| 7+ Person Households | 151 (1.6%) | 0 (0.0%) |
| Total | 8,501 (91.4%) | 797 (8.6%) |
Female Fertility in Southlake
Fertility by Age in Southlake
Average fertility rate in Southlake is 30.0 births per 1,000 women. Women in the age bracket of 35 to 50 years have the highest fertility rate with 40.0 births per 1,000 women. Women in the age bracket of 35 to 50 years acount for 80.2% of all women with births.
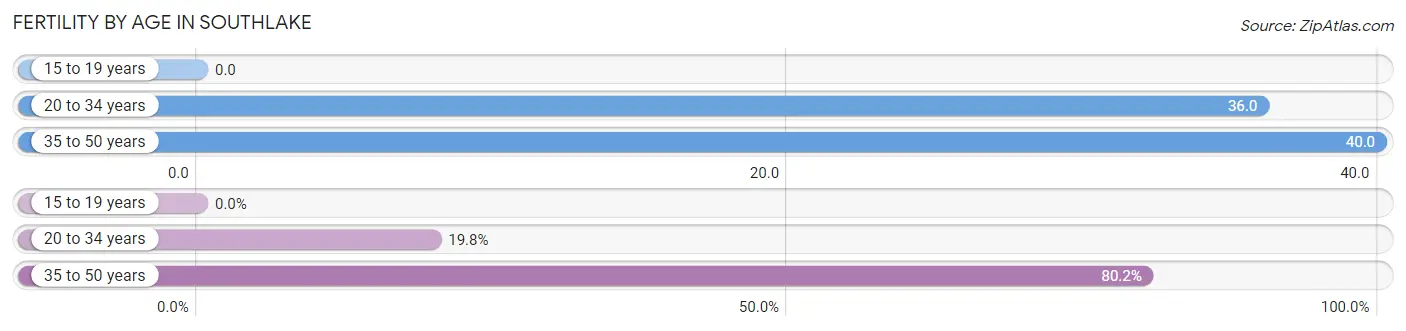
| Age Bracket | Women with Births | Births / 1,000 Women |
| 15 to 19 years | 0 (0.0%) | 0.0 |
| 20 to 34 years | 38 (19.8%) | 36.0 |
| 35 to 50 years | 154 (80.2%) | 40.0 |
| Total | 192 (100.0%) | 30.0 |
Fertility by Age by Marriage Status in Southlake
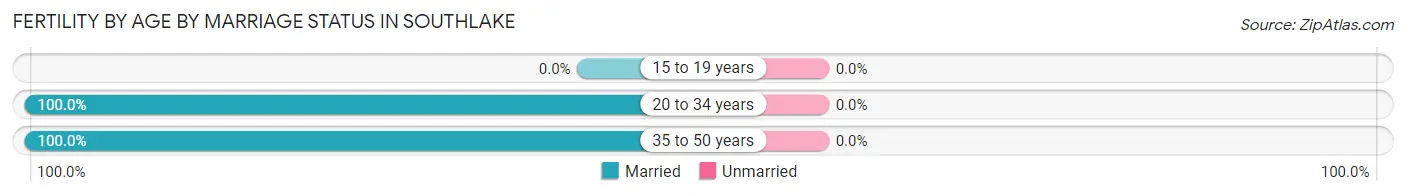
| Age Bracket | Married | Unmarried |
| 15 to 19 years | 0 (0.0%) | 0 (0.0%) |
| 20 to 34 years | 38 (100.0%) | 0 (0.0%) |
| 35 to 50 years | 154 (100.0%) | 0 (0.0%) |
| Total | 192 (100.0%) | 0 (0.0%) |
Fertility by Education in Southlake
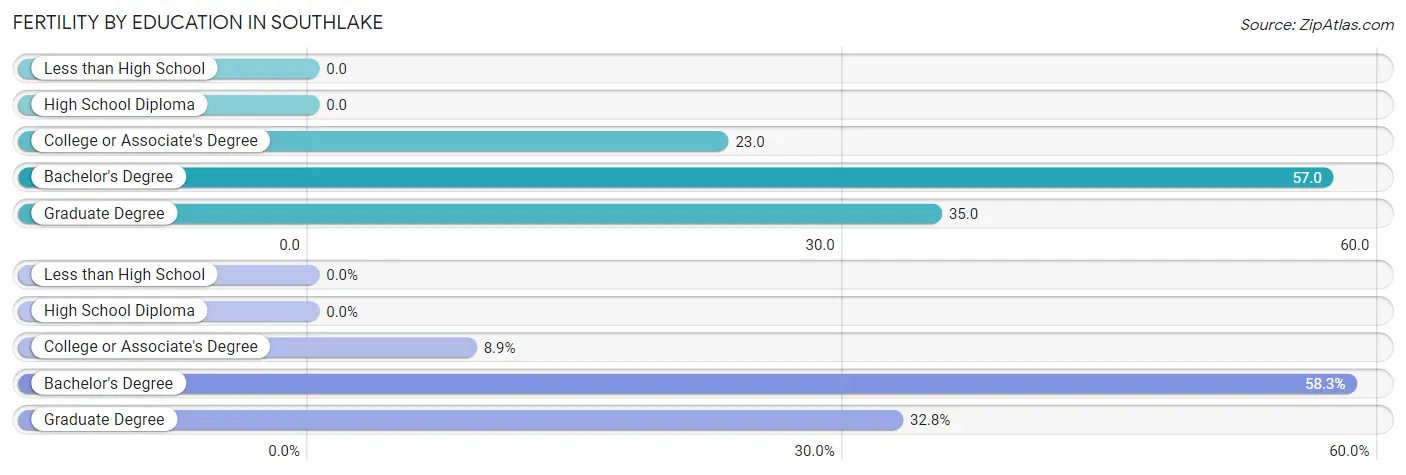
| Educational Attainment | Women with Births | Births / 1,000 Women |
| Less than High School | 0 (0.0%) | 0.0 |
| High School Diploma | 0 (0.0%) | 0.0 |
| College or Associate's Degree | 17 (8.8%) | 23.0 |
| Bachelor's Degree | 112 (58.3%) | 57.0 |
| Graduate Degree | 63 (32.8%) | 35.0 |
| Total | 192 (100.0%) | 30.0 |
Fertility by Education by Marriage Status in Southlake
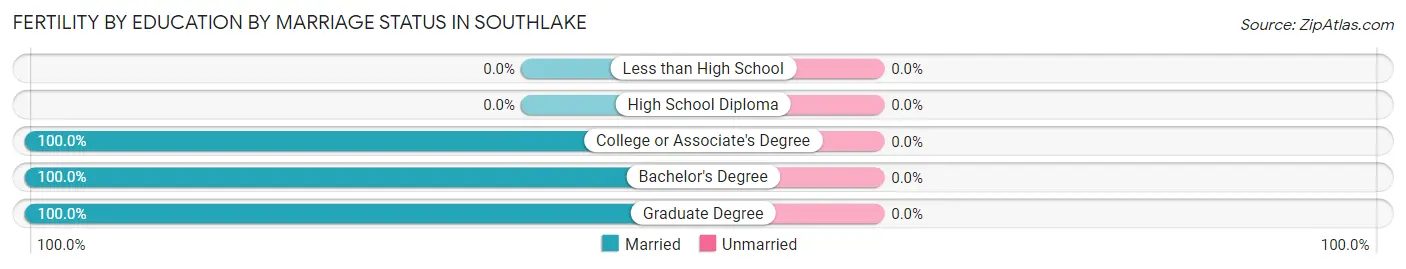
| Educational Attainment | Married | Unmarried |
| Less than High School | 0 (0.0%) | 0 (0.0%) |
| High School Diploma | 0 (0.0%) | 0 (0.0%) |
| College or Associate's Degree | 17 (100.0%) | 0 (0.0%) |
| Bachelor's Degree | 112 (100.0%) | 0 (0.0%) |
| Graduate Degree | 63 (100.0%) | 0 (0.0%) |
| Total | 192 (100.0%) | 0 (0.0%) |
Employment Characteristics in Southlake
Employment by Class of Employer in Southlake
Among the 12,829 employed individuals in Southlake, private company employees (8,960 | 69.8%), self-employed (incorporated) (1,262 | 9.8%), and self-employed (not incorporated) (1,021 | 8.0%) make up the most common classes of employment.
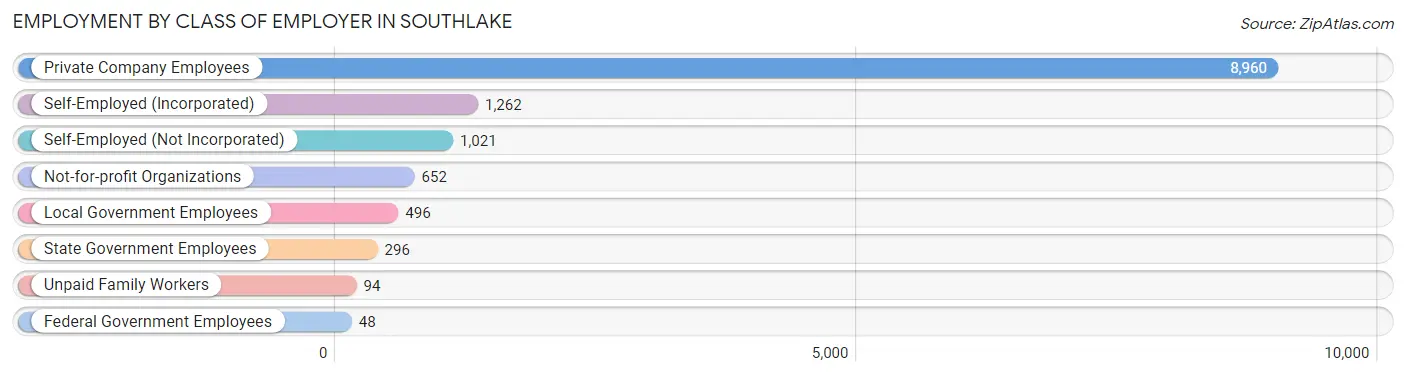
| Employer Class | # Employees | % Employees |
| Private Company Employees | 8,960 | 69.8% |
| Self-Employed (Incorporated) | 1,262 | 9.8% |
| Self-Employed (Not Incorporated) | 1,021 | 8.0% |
| Not-for-profit Organizations | 652 | 5.1% |
| Local Government Employees | 496 | 3.9% |
| State Government Employees | 296 | 2.3% |
| Federal Government Employees | 48 | 0.4% |
| Unpaid Family Workers | 94 | 0.7% |
| Total | 12,829 | 100.0% |
Employment Status by Age in Southlake
According to the labor force statistics for Southlake, out of the total population over 16 years of age (22,127), 60.0% or 13,276 individuals are in the labor force, with 2.5% or 332 of them unemployed. The age group with the highest labor force participation rate is 25 to 29 years, with 95.8% or 530 individuals in the labor force. Within the labor force, the 20 to 24 years age range has the highest percentage of unemployed individuals, with 13.6% or 57 of them being unemployed.
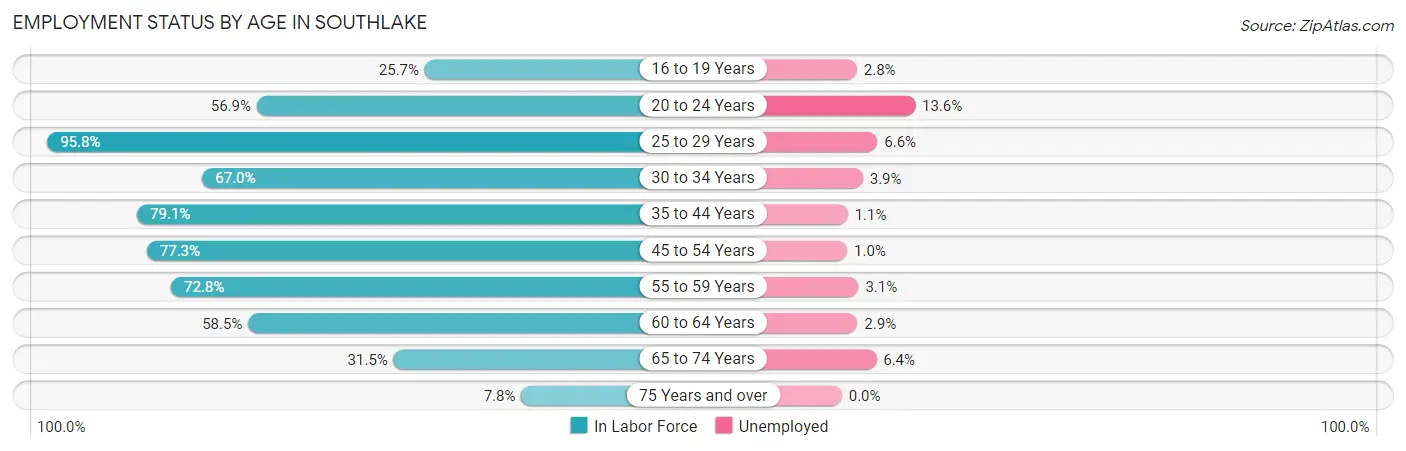
| Age Bracket | In Labor Force | Unemployed |
| 16 to 19 Years | 533 (25.7%) | 15 (2.8%) |
| 20 to 24 Years | 419 (56.9%) | 57 (13.6%) |
| 25 to 29 Years | 530 (95.8%) | 35 (6.6%) |
| 30 to 34 Years | 337 (67.0%) | 13 (3.9%) |
| 35 to 44 Years | 3,253 (79.1%) | 36 (1.1%) |
| 45 to 54 Years | 4,418 (77.3%) | 44 (1.0%) |
| 55 to 59 Years | 1,691 (72.8%) | 52 (3.1%) |
| 60 to 64 Years | 1,203 (58.5%) | 35 (2.9%) |
| 65 to 74 Years | 755 (31.5%) | 48 (6.4%) |
| 75 Years and over | 129 (7.8%) | 0 (0.0%) |
| Total | 13,276 (60.0%) | 332 (2.5%) |
Employment Status by Educational Attainment in Southlake
According to labor force statistics for Southlake, 74.9% of individuals (11,433) out of the total population between 25 and 64 years of age (15,264) are in the labor force, with 1.9% or 217 of them being unemployed. The group with the highest labor force participation rate are those with the educational attainment of less than high school, with 100.0% or 106 individuals in the labor force. Within the labor force, individuals with high school diploma education have the highest percentage of unemployment, with 4.2% or 23 of them being unemployed.
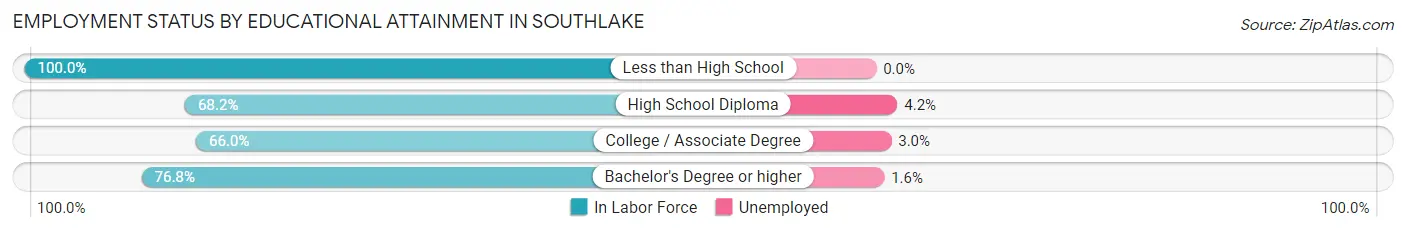
| Educational Attainment | In Labor Force | Unemployed |
| Less than High School | 106 (100.0%) | 0 (0.0%) |
| High School Diploma | 546 (68.2%) | 34 (4.2%) |
| College / Associate Degree | 1,525 (66.0%) | 69 (3.0%) |
| Bachelor's Degree or higher | 9,252 (76.8%) | 193 (1.6%) |
| Total | 11,433 (74.9%) | 290 (1.9%) |
Employment Occupations by Sex in Southlake
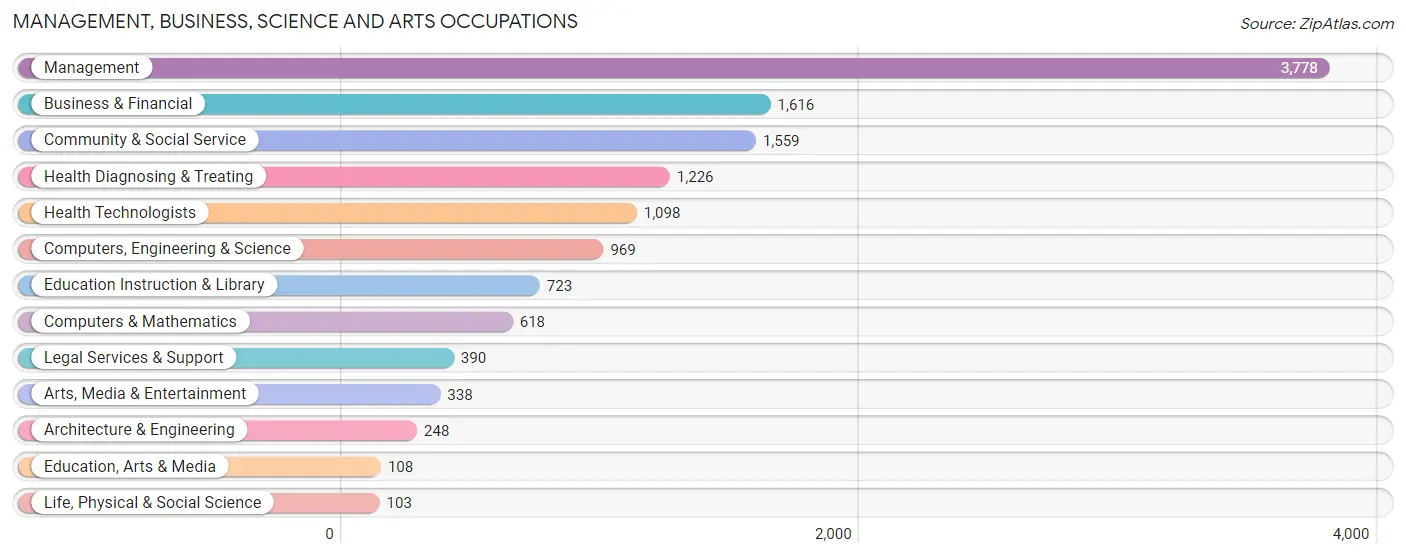
Management, Business, Science and Arts Occupations
The most common Management, Business, Science and Arts occupations in Southlake are Management (3,778 | 29.2%), Business & Financial (1,616 | 12.5%), Community & Social Service (1,559 | 12.1%), Health Diagnosing & Treating (1,226 | 9.5%), and Health Technologists (1,098 | 8.5%).
Management, Business, Science and Arts Occupations by Sex
Within the Management, Business, Science and Arts occupations in Southlake, the most male-oriented occupations are Education, Arts & Media (100.0%), Architecture & Engineering (90.7%), and Management (77.3%), while the most female-oriented occupations are Education Instruction & Library (74.7%), Arts, Media & Entertainment (61.0%), and Community & Social Service (57.7%).
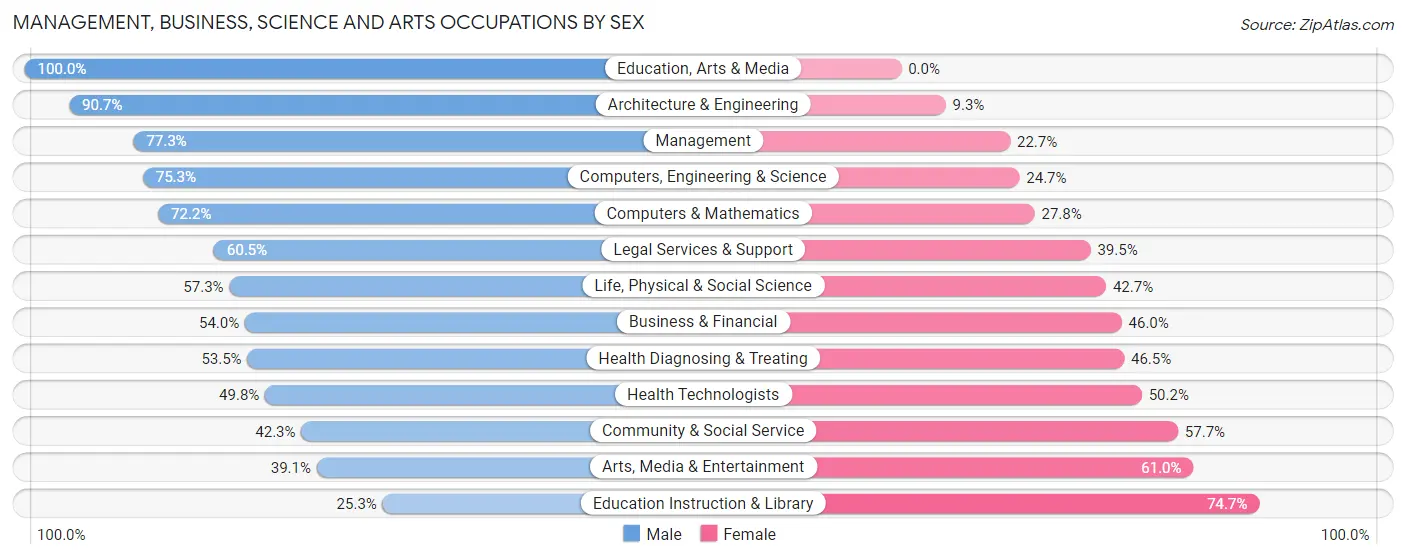
| Occupation | Male | Female |
| Management | 2,920 (77.3%) | 858 (22.7%) |
| Business & Financial | 873 (54.0%) | 743 (46.0%) |
| Computers, Engineering & Science | 730 (75.3%) | 239 (24.7%) |
| Computers & Mathematics | 446 (72.2%) | 172 (27.8%) |
| Architecture & Engineering | 225 (90.7%) | 23 (9.3%) |
| Life, Physical & Social Science | 59 (57.3%) | 44 (42.7%) |
| Community & Social Service | 659 (42.3%) | 900 (57.7%) |
| Education, Arts & Media | 108 (100.0%) | 0 (0.0%) |
| Legal Services & Support | 236 (60.5%) | 154 (39.5%) |
| Education Instruction & Library | 183 (25.3%) | 540 (74.7%) |
| Arts, Media & Entertainment | 132 (39.1%) | 206 (61.0%) |
| Health Diagnosing & Treating | 656 (53.5%) | 570 (46.5%) |
| Health Technologists | 547 (49.8%) | 551 (50.2%) |
| Total (Category) | 5,838 (63.8%) | 3,310 (36.2%) |
| Total (Overall) | 7,914 (61.2%) | 5,018 (38.8%) |
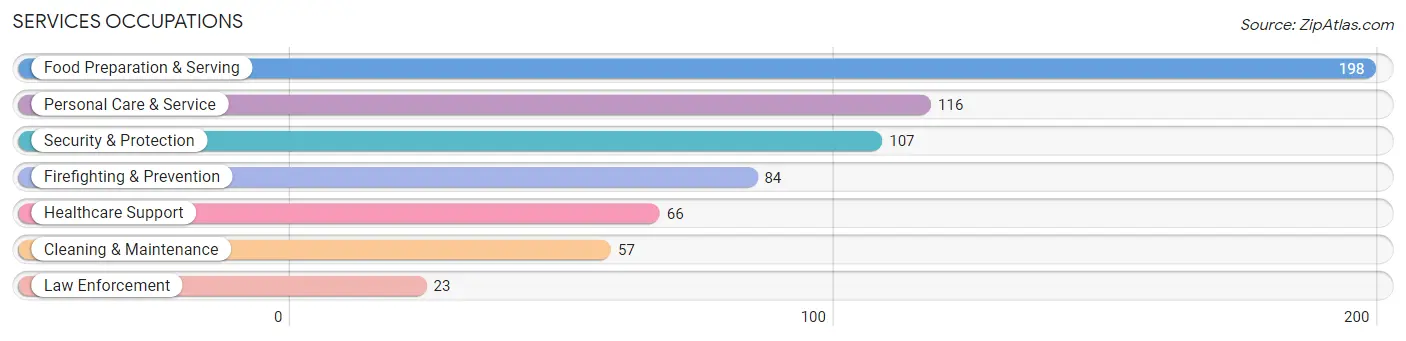
Services Occupations
The most common Services occupations in Southlake are Food Preparation & Serving (198 | 1.5%), Personal Care & Service (116 | 0.9%), Security & Protection (107 | 0.8%), Firefighting & Prevention (84 | 0.6%), and Healthcare Support (66 | 0.5%).
Services Occupations by Sex
Within the Services occupations in Southlake, the most male-oriented occupations are Law Enforcement (100.0%), Security & Protection (84.1%), and Firefighting & Prevention (79.8%), while the most female-oriented occupations are Healthcare Support (78.8%), Personal Care & Service (50.9%), and Food Preparation & Serving (40.4%).
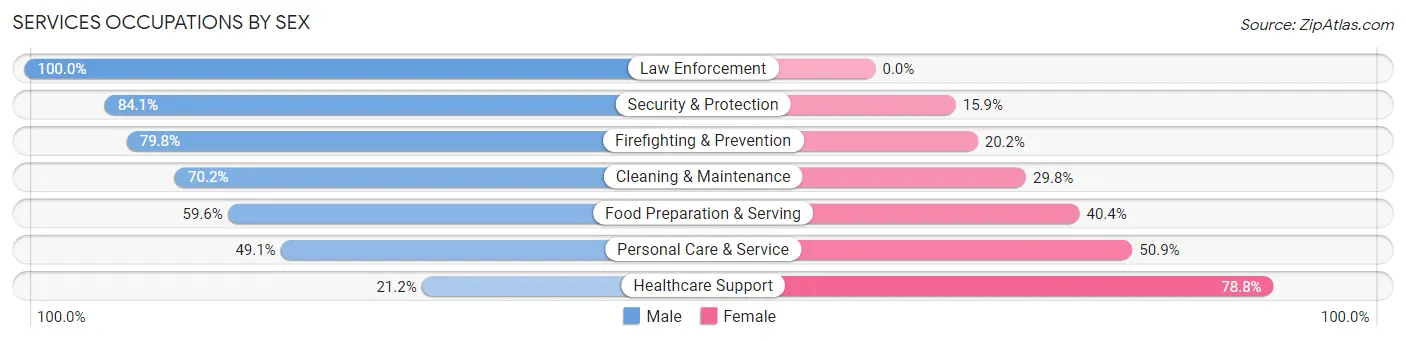
| Occupation | Male | Female |
| Healthcare Support | 14 (21.2%) | 52 (78.8%) |
| Security & Protection | 90 (84.1%) | 17 (15.9%) |
| Firefighting & Prevention | 67 (79.8%) | 17 (20.2%) |
| Law Enforcement | 23 (100.0%) | 0 (0.0%) |
| Food Preparation & Serving | 118 (59.6%) | 80 (40.4%) |
| Cleaning & Maintenance | 40 (70.2%) | 17 (29.8%) |
| Personal Care & Service | 57 (49.1%) | 59 (50.9%) |
| Total (Category) | 319 (58.6%) | 225 (41.4%) |
| Total (Overall) | 7,914 (61.2%) | 5,018 (38.8%) |
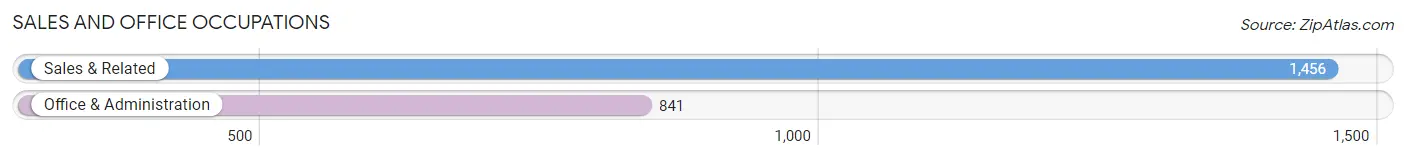
Sales and Office Occupations
The most common Sales and Office occupations in Southlake are Sales & Related (1,456 | 11.3%), and Office & Administration (841 | 6.5%).
Sales and Office Occupations by Sex
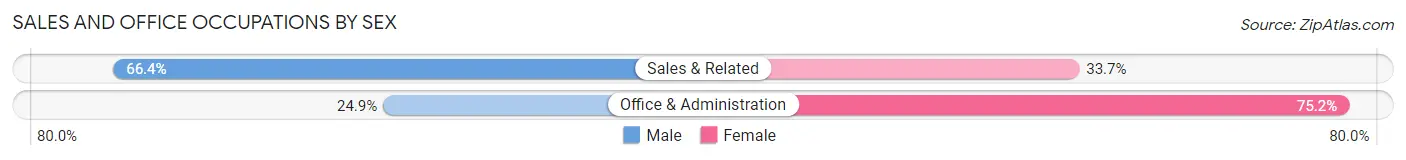
| Occupation | Male | Female |
| Sales & Related | 966 (66.3%) | 490 (33.7%) |
| Office & Administration | 209 (24.8%) | 632 (75.1%) |
| Total (Category) | 1,175 (51.1%) | 1,122 (48.8%) |
| Total (Overall) | 7,914 (61.2%) | 5,018 (38.8%) |
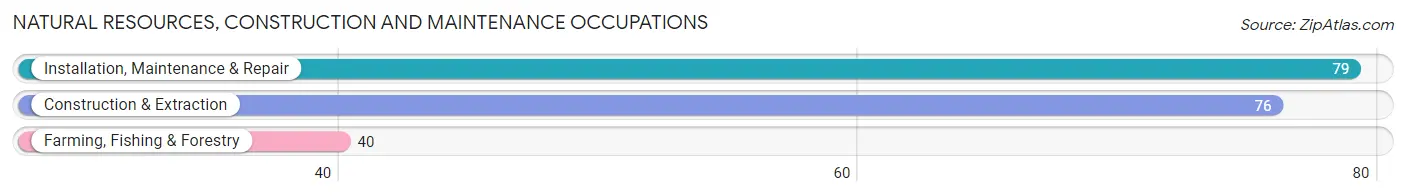
Natural Resources, Construction and Maintenance Occupations
The most common Natural Resources, Construction and Maintenance occupations in Southlake are Installation, Maintenance & Repair (79 | 0.6%), Construction & Extraction (76 | 0.6%), and Farming, Fishing & Forestry (40 | 0.3%).
Natural Resources, Construction and Maintenance Occupations by Sex
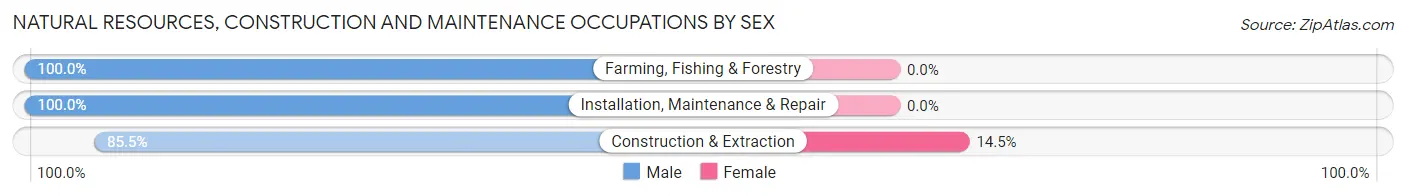
| Occupation | Male | Female |
| Farming, Fishing & Forestry | 40 (100.0%) | 0 (0.0%) |
| Construction & Extraction | 65 (85.5%) | 11 (14.5%) |
| Installation, Maintenance & Repair | 79 (100.0%) | 0 (0.0%) |
| Total (Category) | 184 (94.4%) | 11 (5.6%) |
| Total (Overall) | 7,914 (61.2%) | 5,018 (38.8%) |
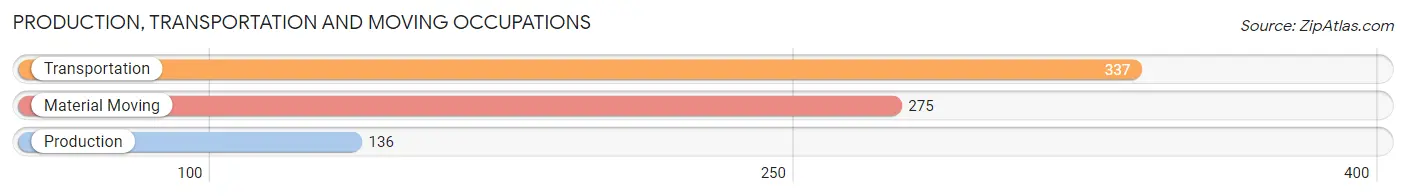
Production, Transportation and Moving Occupations
The most common Production, Transportation and Moving occupations in Southlake are Transportation (337 | 2.6%), Material Moving (275 | 2.1%), and Production (136 | 1.1%).
Production, Transportation and Moving Occupations by Sex
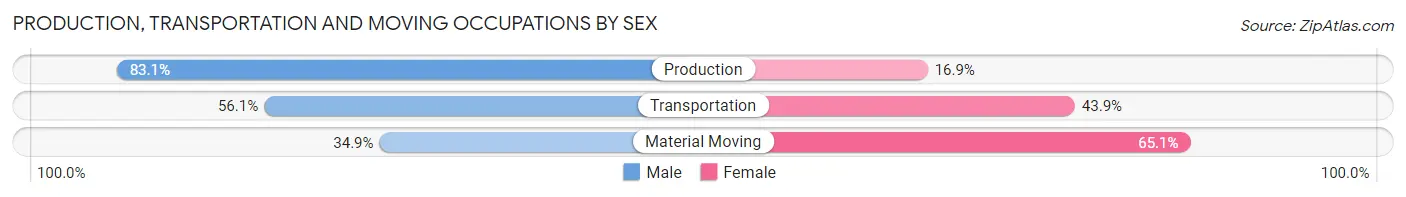
| Occupation | Male | Female |
| Production | 113 (83.1%) | 23 (16.9%) |
| Transportation | 189 (56.1%) | 148 (43.9%) |
| Material Moving | 96 (34.9%) | 179 (65.1%) |
| Total (Category) | 398 (53.2%) | 350 (46.8%) |
| Total (Overall) | 7,914 (61.2%) | 5,018 (38.8%) |
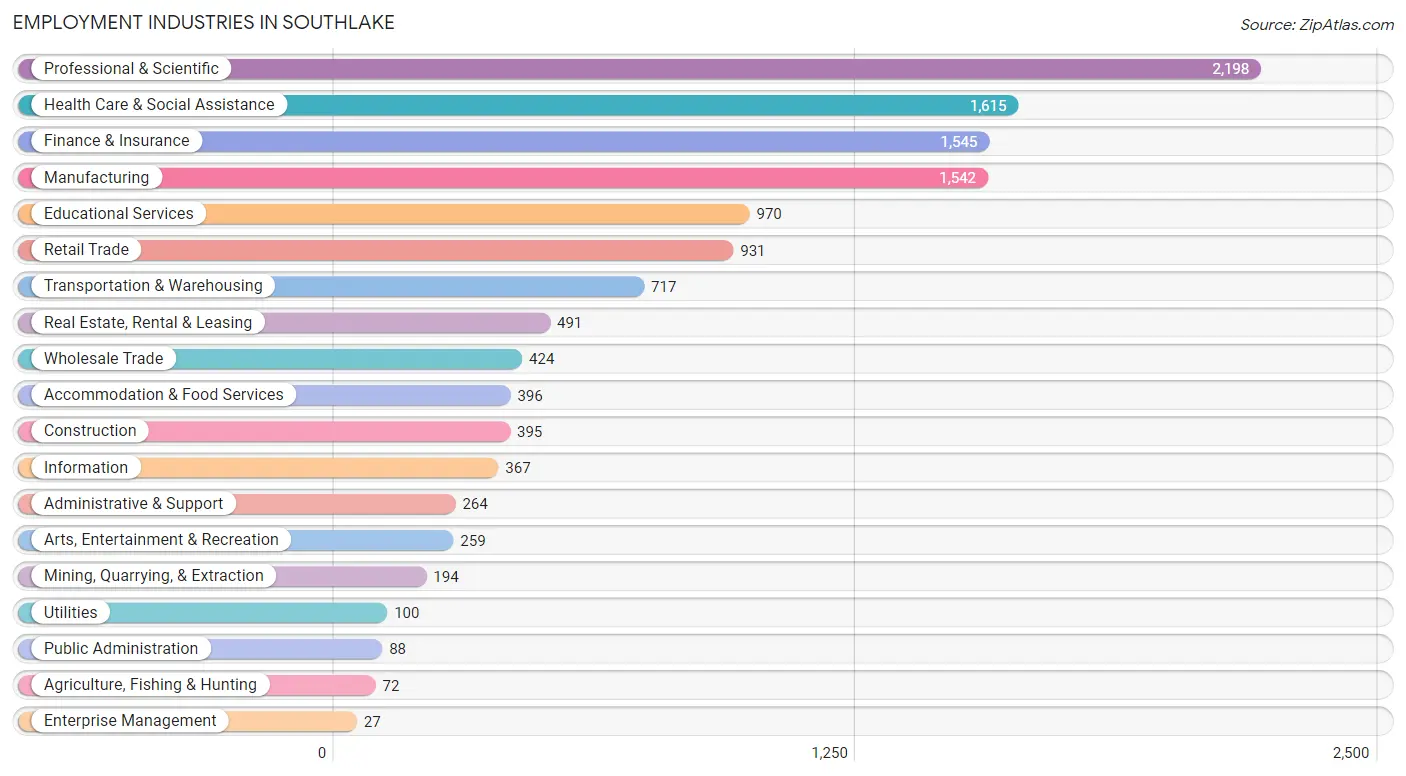
Employment Industries by Sex in Southlake
Employment Industries in Southlake
The major employment industries in Southlake include Professional & Scientific (2,198 | 17.0%), Health Care & Social Assistance (1,615 | 12.5%), Finance & Insurance (1,545 | 11.9%), Manufacturing (1,542 | 11.9%), and Educational Services (970 | 7.5%).
Employment Industries by Sex in Southlake
The Southlake industries that see more men than women are Agriculture, Fishing & Hunting (100.0%), Manufacturing (79.9%), and Mining, Quarrying, & Extraction (72.7%), whereas the industries that tend to have a higher number of women are Enterprise Management (100.0%), Educational Services (76.0%), and Health Care & Social Assistance (51.5%).
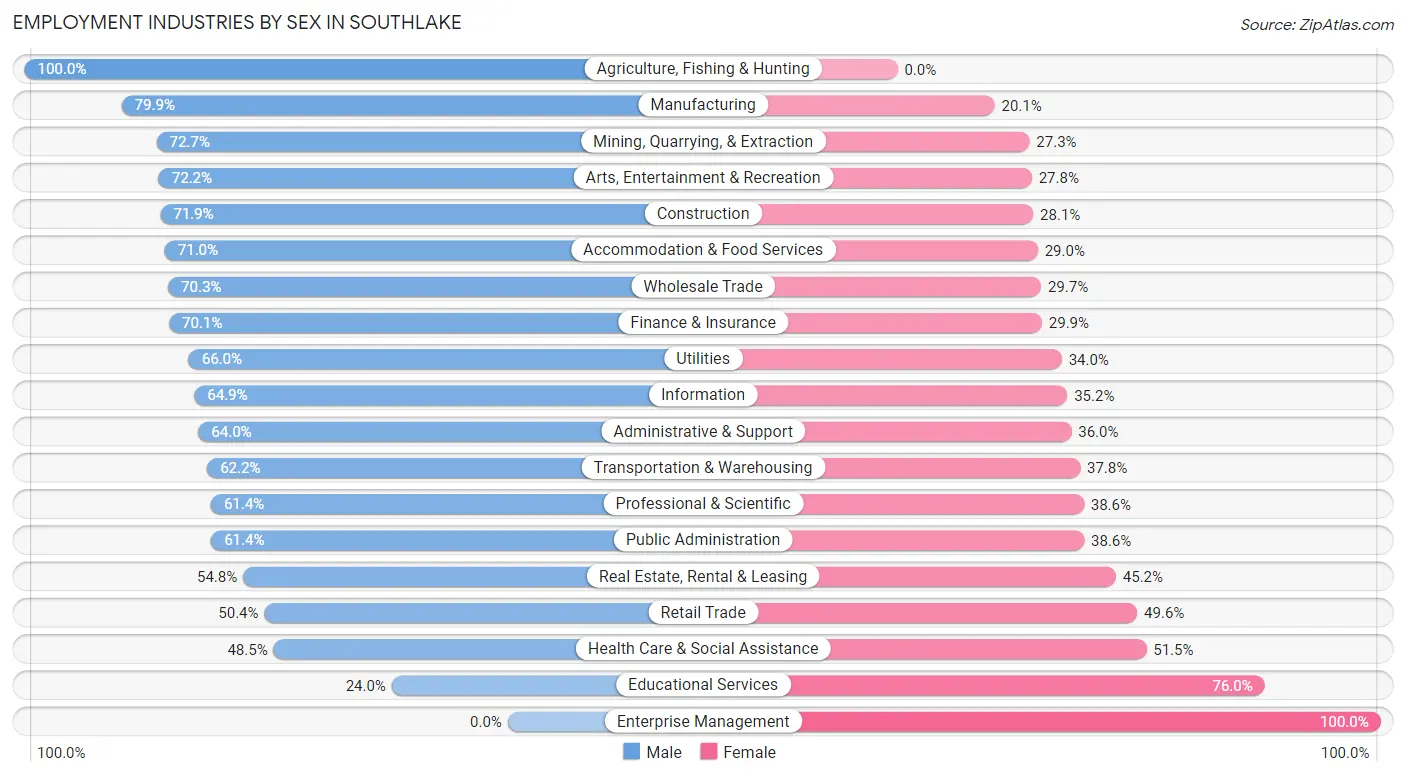
| Industry | Male | Female |
| Agriculture, Fishing & Hunting | 72 (100.0%) | 0 (0.0%) |
| Mining, Quarrying, & Extraction | 141 (72.7%) | 53 (27.3%) |
| Construction | 284 (71.9%) | 111 (28.1%) |
| Manufacturing | 1,232 (79.9%) | 310 (20.1%) |
| Wholesale Trade | 298 (70.3%) | 126 (29.7%) |
| Retail Trade | 469 (50.4%) | 462 (49.6%) |
| Transportation & Warehousing | 446 (62.2%) | 271 (37.8%) |
| Utilities | 66 (66.0%) | 34 (34.0%) |
| Information | 238 (64.8%) | 129 (35.1%) |
| Finance & Insurance | 1,083 (70.1%) | 462 (29.9%) |
| Real Estate, Rental & Leasing | 269 (54.8%) | 222 (45.2%) |
| Professional & Scientific | 1,350 (61.4%) | 848 (38.6%) |
| Enterprise Management | 0 (0.0%) | 27 (100.0%) |
| Administrative & Support | 169 (64.0%) | 95 (36.0%) |
| Educational Services | 233 (24.0%) | 737 (76.0%) |
| Health Care & Social Assistance | 783 (48.5%) | 832 (51.5%) |
| Arts, Entertainment & Recreation | 187 (72.2%) | 72 (27.8%) |
| Accommodation & Food Services | 281 (71.0%) | 115 (29.0%) |
| Public Administration | 54 (61.4%) | 34 (38.6%) |
| Total | 7,914 (61.2%) | 5,018 (38.8%) |
Education in Southlake
School Enrollment in Southlake
The most common levels of schooling among the 10,234 students in Southlake are middle school (3,107 | 30.4%), high school (2,883 | 28.2%), and elementary school (1,990 | 19.4%).
| School Level | # Students | % Students |
| Nursery / Preschool | 727 | 7.1% |
| Kindergarten | 475 | 4.6% |
| Elementary School | 1,990 | 19.4% |
| Middle School | 3,107 | 30.4% |
| High School | 2,883 | 28.2% |
| College / Undergraduate | 755 | 7.4% |
| Graduate / Professional | 297 | 2.9% |
| Total | 10,234 | 100.0% |
School Enrollment by Age by Funding Source in Southlake
Out of a total of 10,234 students who are enrolled in schools in Southlake, 2,026 (19.8%) attend a private institution, while the remaining 8,208 (80.2%) are enrolled in public schools. The age group of 3 to 4 year olds has the highest likelihood of being enrolled in private schools, with 426 (79.5% in the age bracket) enrolled. Conversely, the age group of 15 to 17 year olds has the lowest likelihood of being enrolled in a private school, with 1,915 (91.8% in the age bracket) attending a public institution.
| Age Bracket | Public School | Private School |
| 3 to 4 Year Olds | 110 (20.5%) | 426 (79.5%) |
| 5 to 9 Year Old | 1,815 (82.0%) | 399 (18.0%) |
| 10 to 14 Year Olds | 3,287 (85.2%) | 572 (14.8%) |
| 15 to 17 Year Olds | 1,915 (91.8%) | 172 (8.2%) |
| 18 to 19 Year Olds | 554 (85.0%) | 98 (15.0%) |
| 20 to 24 Year Olds | 247 (63.2%) | 144 (36.8%) |
| 25 to 34 Year Olds | 50 (43.9%) | 64 (56.1%) |
| 35 Years and over | 234 (61.4%) | 147 (38.6%) |
| Total | 8,208 (80.2%) | 2,026 (19.8%) |
Educational Attainment by Field of Study in Southlake
Business (4,432 | 29.4%), engineering (1,878 | 12.5%), social sciences (1,069 | 7.1%), computers & mathematics (1,054 | 7.0%), and bio, nature & agricultural (1,014 | 6.7%) are the most common fields of study among 15,065 individuals in Southlake who have obtained a bachelor's degree or higher.
| Field of Study | # Graduates | % Graduates |
| Computers & Mathematics | 1,054 | 7.0% |
| Bio, Nature & Agricultural | 1,014 | 6.7% |
| Physical & Health Sciences | 613 | 4.1% |
| Psychology | 628 | 4.2% |
| Social Sciences | 1,069 | 7.1% |
| Engineering | 1,878 | 12.5% |
| Multidisciplinary Studies | 117 | 0.8% |
| Science & Technology | 921 | 6.1% |
| Business | 4,432 | 29.4% |
| Education | 866 | 5.8% |
| Literature & Languages | 444 | 2.9% |
| Liberal Arts & History | 499 | 3.3% |
| Visual & Performing Arts | 260 | 1.7% |
| Communications | 668 | 4.4% |
| Arts & Humanities | 602 | 4.0% |
| Total | 15,065 | 100.0% |
Transportation & Commute in Southlake
Vehicle Availability by Sex in Southlake
The most prevalent vehicle ownership categories in Southlake are males with 2 vehicles (4,111, accounting for 52.3%) and females with 2 vehicles (2,625, making up 82.7%).
| Vehicles Available | Male | Female |
| No Vehicle | 42 (0.5%) | 29 (0.6%) |
| 1 Vehicle | 488 (6.2%) | 286 (5.8%) |
| 2 Vehicles | 4,111 (52.3%) | 2,625 (52.8%) |
| 3 Vehicles | 1,806 (23.0%) | 1,045 (21.0%) |
| 4 Vehicles | 1,050 (13.4%) | 704 (14.1%) |
| 5 or more Vehicles | 358 (4.6%) | 285 (5.7%) |
| Total | 7,855 (100.0%) | 4,974 (100.0%) |
Commute Time in Southlake
The most frequently occuring commute durations in Southlake are 30 to 34 minutes (1,551 commuters, 16.9%), 20 to 24 minutes (1,320 commuters, 14.4%), and 10 to 14 minutes (902 commuters, 9.9%).
| Commute Time | # Commuters | % Commuters |
| Less than 5 Minutes | 225 | 2.5% |
| 5 to 9 Minutes | 795 | 8.7% |
| 10 to 14 Minutes | 902 | 9.9% |
| 15 to 19 Minutes | 840 | 9.2% |
| 20 to 24 Minutes | 1,320 | 14.4% |
| 25 to 29 Minutes | 811 | 8.8% |
| 30 to 34 Minutes | 1,551 | 16.9% |
| 35 to 39 Minutes | 818 | 8.9% |
| 40 to 44 Minutes | 805 | 8.8% |
| 45 to 59 Minutes | 769 | 8.4% |
| 60 to 89 Minutes | 296 | 3.2% |
| 90 or more Minutes | 28 | 0.3% |
Commute Time by Sex in Southlake
The most common commute times in Southlake are 30 to 34 minutes (878 commuters, 15.8%) for males and 30 to 34 minutes (673 commuters, 18.6%) for females.
| Commute Time | Male | Female |
| Less than 5 Minutes | 147 (2.6%) | 78 (2.2%) |
| 5 to 9 Minutes | 476 (8.6%) | 319 (8.8%) |
| 10 to 14 Minutes | 414 (7.5%) | 488 (13.5%) |
| 15 to 19 Minutes | 474 (8.5%) | 366 (10.1%) |
| 20 to 24 Minutes | 713 (12.8%) | 607 (16.8%) |
| 25 to 29 Minutes | 627 (11.3%) | 184 (5.1%) |
| 30 to 34 Minutes | 878 (15.8%) | 673 (18.6%) |
| 35 to 39 Minutes | 534 (9.6%) | 284 (7.9%) |
| 40 to 44 Minutes | 509 (9.2%) | 296 (8.2%) |
| 45 to 59 Minutes | 513 (9.2%) | 256 (7.1%) |
| 60 to 89 Minutes | 247 (4.4%) | 49 (1.4%) |
| 90 or more Minutes | 19 (0.3%) | 9 (0.3%) |
Time of Departure to Work by Sex in Southlake
The most frequent times of departure to work in Southlake are 8:00 AM to 8:29 AM (1,366, 24.6%) for males and 7:30 AM to 7:59 AM (746, 20.7%) for females.
| Time of Departure | Male | Female |
| 12:00 AM to 4:59 AM | 53 (0.9%) | 69 (1.9%) |
| 5:00 AM to 5:29 AM | 154 (2.8%) | 35 (1.0%) |
| 5:30 AM to 5:59 AM | 151 (2.7%) | 78 (2.2%) |
| 6:00 AM to 6:29 AM | 398 (7.2%) | 172 (4.8%) |
| 6:30 AM to 6:59 AM | 381 (6.9%) | 212 (5.9%) |
| 7:00 AM to 7:29 AM | 887 (16.0%) | 632 (17.5%) |
| 7:30 AM to 7:59 AM | 822 (14.8%) | 746 (20.7%) |
| 8:00 AM to 8:29 AM | 1,366 (24.6%) | 665 (18.4%) |
| 8:30 AM to 8:59 AM | 287 (5.2%) | 210 (5.8%) |
| 9:00 AM to 9:59 AM | 501 (9.0%) | 268 (7.4%) |
| 10:00 AM to 10:59 AM | 176 (3.2%) | 221 (6.1%) |
| 11:00 AM to 11:59 AM | 21 (0.4%) | 40 (1.1%) |
| 12:00 PM to 3:59 PM | 244 (4.4%) | 119 (3.3%) |
| 4:00 PM to 11:59 PM | 110 (2.0%) | 142 (3.9%) |
| Total | 5,551 (100.0%) | 3,609 (100.0%) |
Housing Occupancy in Southlake
Occupancy by Ownership in Southlake
Of the total 9,298 dwellings in Southlake, owner-occupied units account for 8,833 (95.0%), while renter-occupied units make up 465 (5.0%).
| Occupancy | # Housing Units | % Housing Units |
| Owner Occupied Housing Units | 8,833 | 95.0% |
| Renter-Occupied Housing Units | 465 | 5.0% |
| Total Occupied Housing Units | 9,298 | 100.0% |
Occupancy by Household Size in Southlake
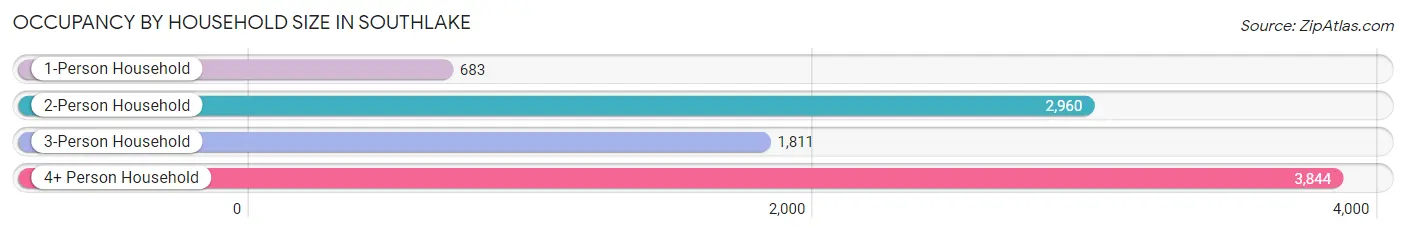
| Household Size | # Housing Units | % Housing Units |
| 1-Person Household | 683 | 7.3% |
| 2-Person Household | 2,960 | 31.8% |
| 3-Person Household | 1,811 | 19.5% |
| 4+ Person Household | 3,844 | 41.3% |
| Total Housing Units | 9,298 | 100.0% |
Occupancy by Ownership by Household Size in Southlake
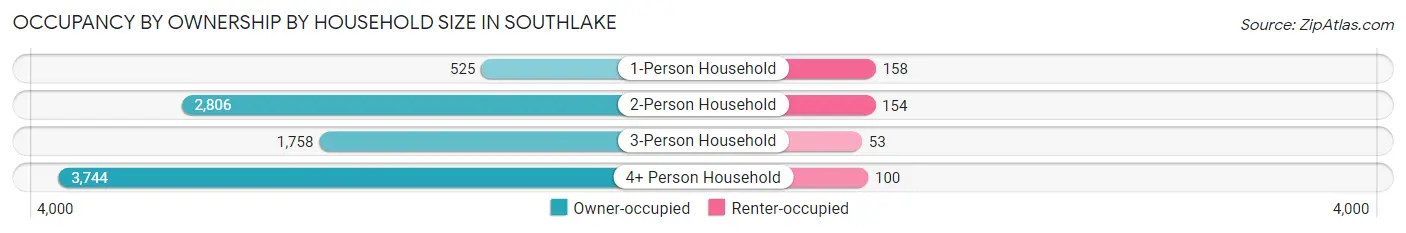
| Household Size | Owner-occupied | Renter-occupied |
| 1-Person Household | 525 (76.9%) | 158 (23.1%) |
| 2-Person Household | 2,806 (94.8%) | 154 (5.2%) |
| 3-Person Household | 1,758 (97.1%) | 53 (2.9%) |
| 4+ Person Household | 3,744 (97.4%) | 100 (2.6%) |
| Total Housing Units | 8,833 (95.0%) | 465 (5.0%) |
Occupancy by Educational Attainment in Southlake
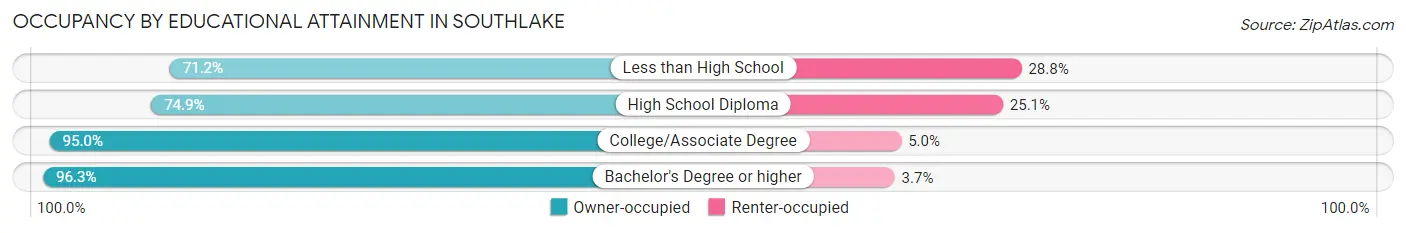
| Household Size | Owner-occupied | Renter-occupied |
| Less than High School | 42 (71.2%) | 17 (28.8%) |
| High School Diploma | 307 (74.9%) | 103 (25.1%) |
| College/Associate Degree | 1,605 (95.0%) | 84 (5.0%) |
| Bachelor's Degree or higher | 6,879 (96.3%) | 261 (3.7%) |
Occupancy by Age of Householder in Southlake
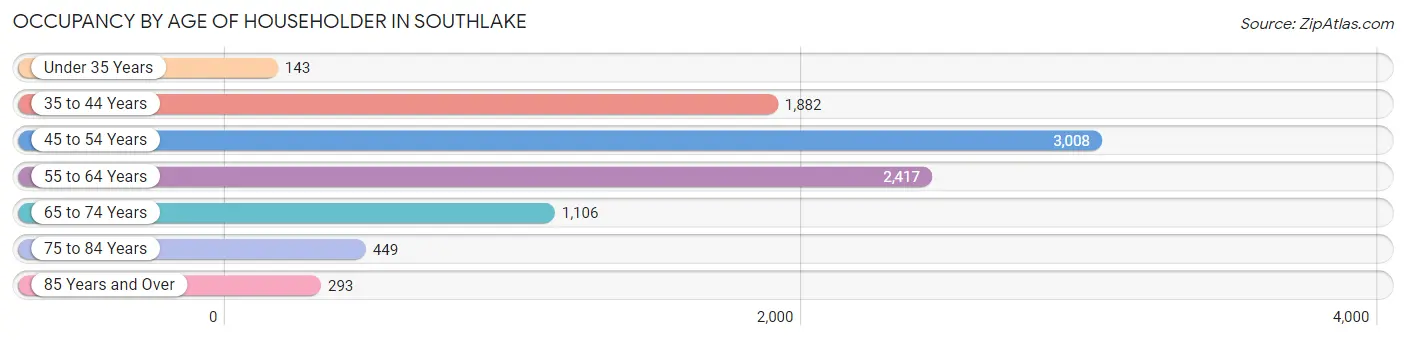
| Age Bracket | # Households | % Households |
| Under 35 Years | 143 | 1.5% |
| 35 to 44 Years | 1,882 | 20.2% |
| 45 to 54 Years | 3,008 | 32.4% |
| 55 to 64 Years | 2,417 | 26.0% |
| 65 to 74 Years | 1,106 | 11.9% |
| 75 to 84 Years | 449 | 4.8% |
| 85 Years and Over | 293 | 3.2% |
| Total | 9,298 | 100.0% |
Housing Finances in Southlake
Median Income by Occupancy in Southlake
| Occupancy Type | # Households | Median Income |
| Owner-Occupied | 8,833 (95.0%) | $250,001 |
| Renter-Occupied | 465 (5.0%) | $64,007 |
| Average | 9,298 (100.0%) | $250,001 |
Occupancy by Householder Income Bracket in Southlake
| Income Bracket | Owner-occupied | Renter-occupied |
| Less than $5,000 | 103 (1.2%) | 0 (0.0%) |
| $5,000 to $9,999 | 4 (0.1%) | 0 (0.0%) |
| $10,000 to $14,999 | 0 (0.0%) | 50 (10.7%) |
| $15,000 to $19,999 | 33 (0.4%) | 73 (15.7%) |
| $20,000 to $24,999 | 21 (0.2%) | 0 (0.0%) |
| $25,000 to $34,999 | 118 (1.3%) | 12 (2.6%) |
| $35,000 to $49,999 | 203 (2.3%) | 60 (12.9%) |
| $50,000 to $74,999 | 240 (2.7%) | 88 (18.9%) |
| $75,000 to $99,999 | 360 (4.1%) | 34 (7.3%) |
| $100,000 to $149,999 | 824 (9.3%) | 14 (3.0%) |
| $150,000 or more | 6,927 (78.4%) | 134 (28.8%) |
| Total | 8,833 (100.0%) | 465 (100.0%) |
Monthly Housing Cost Tiers in Southlake
| Monthly Cost | Owner-occupied | Renter-occupied |
| Less than $300 | 27 (0.3%) | 43 (9.2%) |
| $300 to $499 | 0 (0.0%) | 0 (0.0%) |
| $500 to $799 | 117 (1.3%) | 0 (0.0%) |
| $800 to $999 | 130 (1.5%) | 0 (0.0%) |
| $1,000 to $1,499 | 502 (5.7%) | 41 (8.8%) |
| $1,500 to $1,999 | 794 (9.0%) | 85 (18.3%) |
| $2,000 to $2,499 | 895 (10.1%) | 41 (8.8%) |
| $2,500 to $2,999 | 629 (7.1%) | 14 (3.0%) |
| $3,000 or more | 5,739 (65.0%) | 197 (42.4%) |
| Total | 8,833 (100.0%) | 465 (100.0%) |
Physical Housing Characteristics in Southlake
Housing Structures in Southlake
| Structure Type | # Housing Units | % Housing Units |
| Single Unit, Detached | 8,837 | 95.0% |
| Single Unit, Attached | 98 | 1.1% |
| 2 Unit Apartments | 0 | 0.0% |
| 3 or 4 Unit Apartments | 43 | 0.5% |
| 5 to 9 Unit Apartments | 0 | 0.0% |
| 10 or more Apartments | 247 | 2.7% |
| Mobile Home / Other | 73 | 0.8% |
| Total | 9,298 | 100.0% |
Housing Structures by Occupancy in Southlake
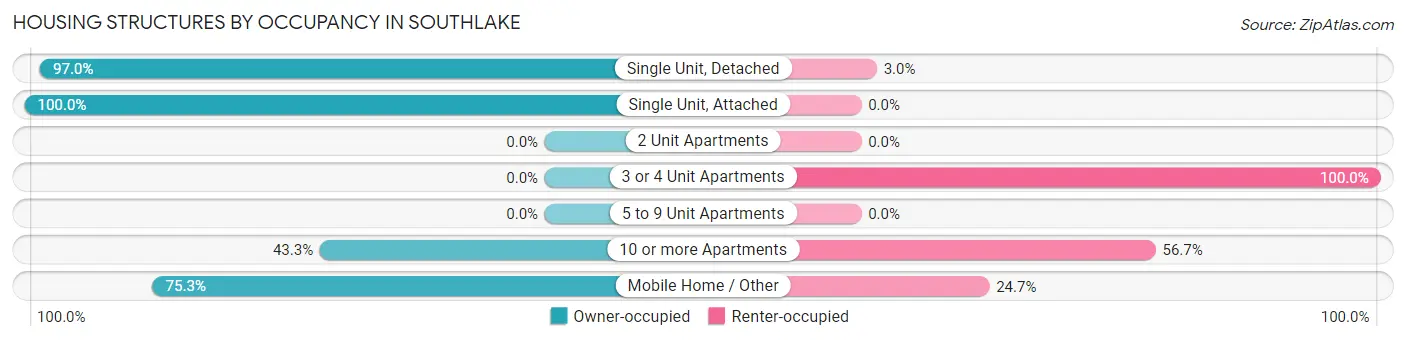
| Structure Type | Owner-occupied | Renter-occupied |
| Single Unit, Detached | 8,573 (97.0%) | 264 (3.0%) |
| Single Unit, Attached | 98 (100.0%) | 0 (0.0%) |
| 2 Unit Apartments | 0 (0.0%) | 0 (0.0%) |
| 3 or 4 Unit Apartments | 0 (0.0%) | 43 (100.0%) |
| 5 to 9 Unit Apartments | 0 (0.0%) | 0 (0.0%) |
| 10 or more Apartments | 107 (43.3%) | 140 (56.7%) |
| Mobile Home / Other | 55 (75.3%) | 18 (24.7%) |
| Total | 8,833 (95.0%) | 465 (5.0%) |
Housing Structures by Number of Rooms in Southlake
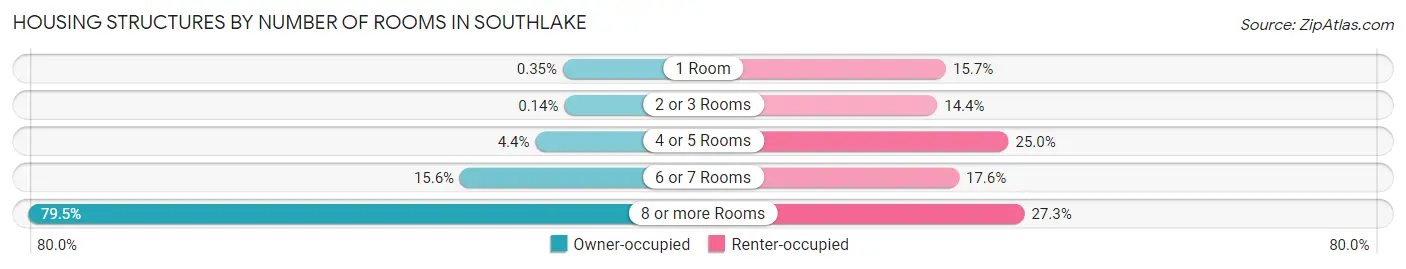
| Number of Rooms | Owner-occupied | Renter-occupied |
| 1 Room | 31 (0.4%) | 73 (15.7%) |
| 2 or 3 Rooms | 12 (0.1%) | 67 (14.4%) |
| 4 or 5 Rooms | 391 (4.4%) | 116 (24.9%) |
| 6 or 7 Rooms | 1,376 (15.6%) | 82 (17.6%) |
| 8 or more Rooms | 7,023 (79.5%) | 127 (27.3%) |
| Total | 8,833 (100.0%) | 465 (100.0%) |
Housing Structure by Heating Type in Southlake
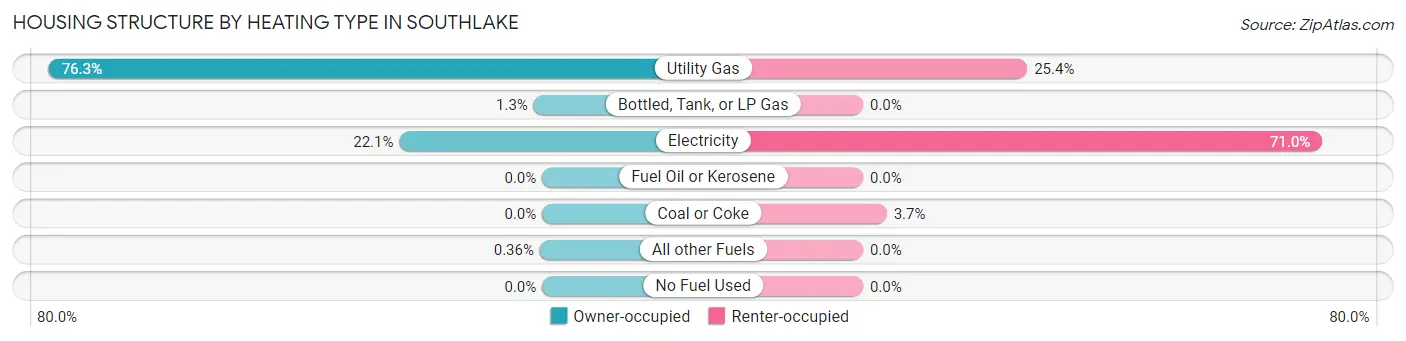
| Heating Type | Owner-occupied | Renter-occupied |
| Utility Gas | 6,736 (76.3%) | 118 (25.4%) |
| Bottled, Tank, or LP Gas | 115 (1.3%) | 0 (0.0%) |
| Electricity | 1,950 (22.1%) | 330 (71.0%) |
| Fuel Oil or Kerosene | 0 (0.0%) | 0 (0.0%) |
| Coal or Coke | 0 (0.0%) | 17 (3.7%) |
| All other Fuels | 32 (0.4%) | 0 (0.0%) |
| No Fuel Used | 0 (0.0%) | 0 (0.0%) |
| Total | 8,833 (100.0%) | 465 (100.0%) |
Household Vehicle Usage in Southlake
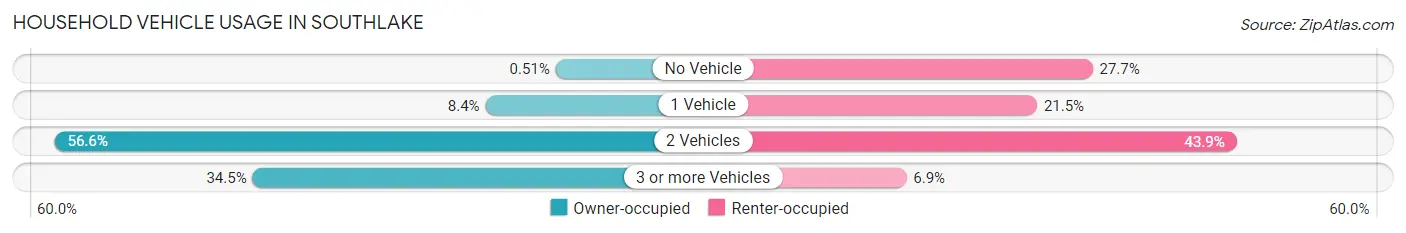
| Vehicles per Household | Owner-occupied | Renter-occupied |
| No Vehicle | 45 (0.5%) | 129 (27.7%) |
| 1 Vehicle | 740 (8.4%) | 100 (21.5%) |
| 2 Vehicles | 5,003 (56.6%) | 204 (43.9%) |
| 3 or more Vehicles | 3,045 (34.5%) | 32 (6.9%) |
| Total | 8,833 (100.0%) | 465 (100.0%) |
Real Estate & Mortgages in Southlake
Real Estate and Mortgage Overview in Southlake
| Characteristic | Without Mortgage | With Mortgage |
| Housing Units | 2,772 | 6,061 |
| Median Property Value | $741,100 | $900,800 |
| Median Household Income | $200,385 | $5,256 |
| Monthly Housing Costs | $1,501 | $5,344 |
| Real Estate Taxes | $10,001 | $50 |
Property Value by Mortgage Status in Southlake
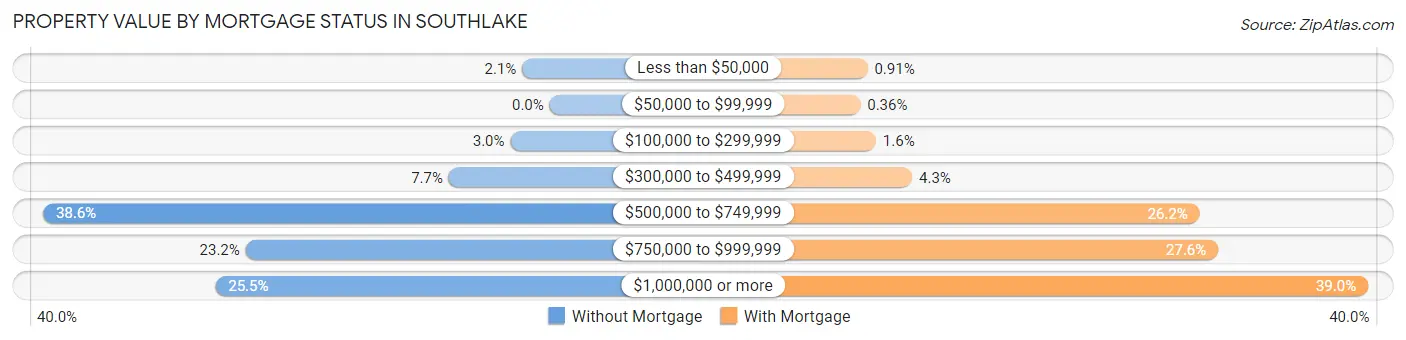
| Property Value | Without Mortgage | With Mortgage |
| Less than $50,000 | 58 (2.1%) | 55 (0.9%) |
| $50,000 to $99,999 | 0 (0.0%) | 22 (0.4%) |
| $100,000 to $299,999 | 83 (3.0%) | 94 (1.5%) |
| $300,000 to $499,999 | 213 (7.7%) | 261 (4.3%) |
| $500,000 to $749,999 | 1,070 (38.6%) | 1,589 (26.2%) |
| $750,000 to $999,999 | 642 (23.2%) | 1,674 (27.6%) |
| $1,000,000 or more | 706 (25.5%) | 2,366 (39.0%) |
| Total | 2,772 (100.0%) | 6,061 (100.0%) |
Household Income by Mortgage Status in Southlake
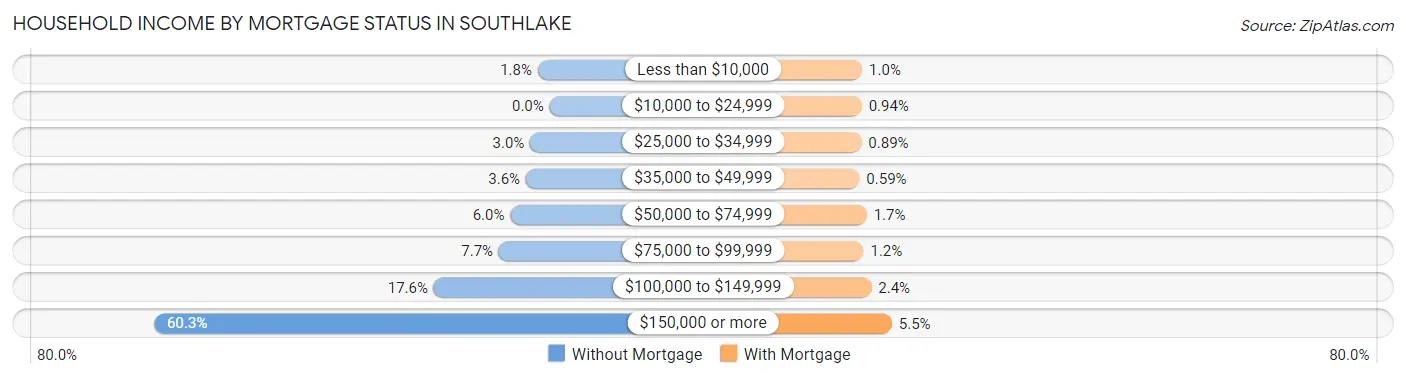
| Household Income | Without Mortgage | With Mortgage |
| Less than $10,000 | 50 (1.8%) | 61 (1.0%) |
| $10,000 to $24,999 | 0 (0.0%) | 57 (0.9%) |
| $25,000 to $34,999 | 82 (3.0%) | 54 (0.9%) |
| $35,000 to $49,999 | 100 (3.6%) | 36 (0.6%) |
| $50,000 to $74,999 | 166 (6.0%) | 103 (1.7%) |
| $75,000 to $99,999 | 214 (7.7%) | 74 (1.2%) |
| $100,000 to $149,999 | 489 (17.6%) | 146 (2.4%) |
| $150,000 or more | 1,671 (60.3%) | 335 (5.5%) |
| Total | 2,772 (100.0%) | 6,061 (100.0%) |
Property Value to Household Income Ratio in Southlake
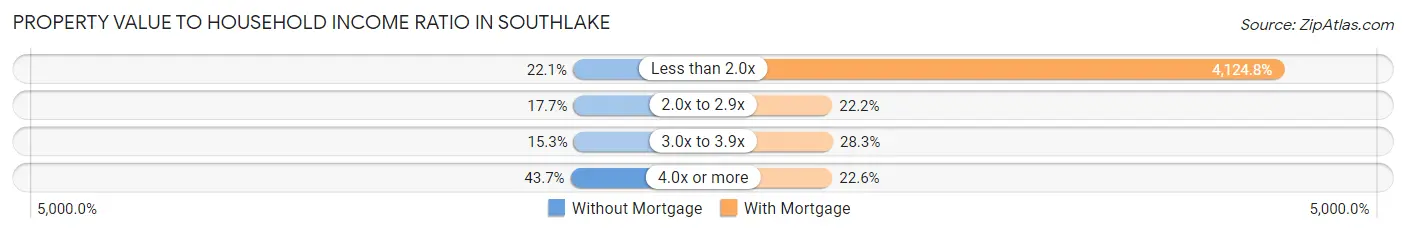
| Value-to-Income Ratio | Without Mortgage | With Mortgage |
| Less than 2.0x | 613 (22.1%) | 250,001 (4,124.8%) |
| 2.0x to 2.9x | 491 (17.7%) | 1,344 (22.2%) |
| 3.0x to 3.9x | 425 (15.3%) | 1,717 (28.3%) |
| 4.0x or more | 1,211 (43.7%) | 1,370 (22.6%) |
| Total | 2,772 (100.0%) | 6,061 (100.0%) |
Real Estate Taxes by Mortgage Status in Southlake
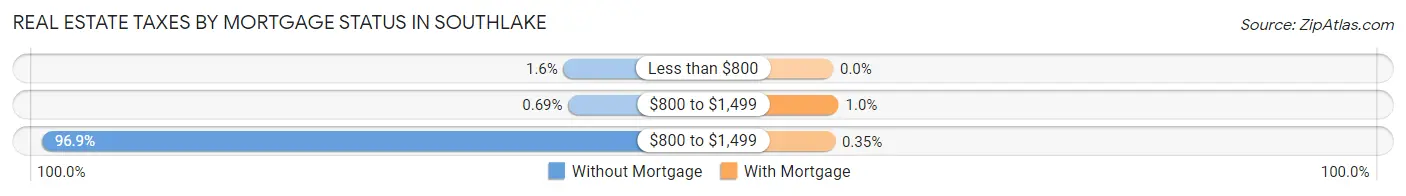
| Property Taxes | Without Mortgage | With Mortgage |
| Less than $800 | 43 (1.5%) | 0 (0.0%) |
| $800 to $1,499 | 19 (0.7%) | 61 (1.0%) |
| $800 to $1,499 | 2,685 (96.9%) | 21 (0.4%) |
| Total | 2,772 (100.0%) | 6,061 (100.0%) |
Health & Disability in Southlake
Health Insurance Coverage by Age in Southlake
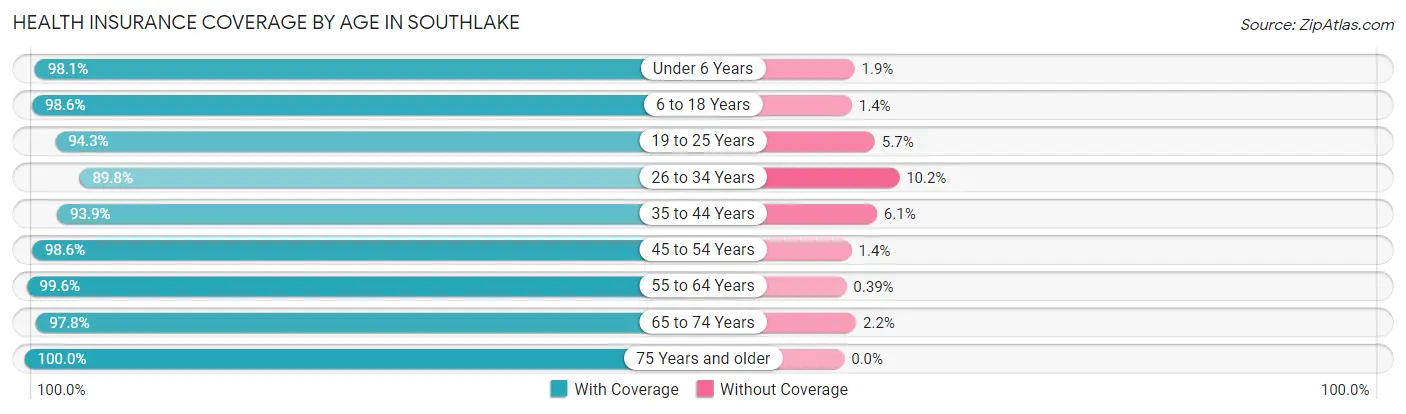
| Age Bracket | With Coverage | Without Coverage |
| Under 6 Years | 1,890 (98.1%) | 37 (1.9%) |
| 6 to 18 Years | 8,547 (98.6%) | 122 (1.4%) |
| 19 to 25 Years | 909 (94.3%) | 55 (5.7%) |
| 26 to 34 Years | 859 (89.8%) | 98 (10.2%) |
| 35 to 44 Years | 3,862 (93.9%) | 250 (6.1%) |
| 45 to 54 Years | 5,638 (98.6%) | 78 (1.4%) |
| 55 to 64 Years | 4,351 (99.6%) | 17 (0.4%) |
| 65 to 74 Years | 2,317 (97.8%) | 52 (2.2%) |
| 75 Years and older | 1,609 (100.0%) | 0 (0.0%) |
| Total | 29,982 (97.7%) | 709 (2.3%) |
Health Insurance Coverage by Citizenship Status in Southlake
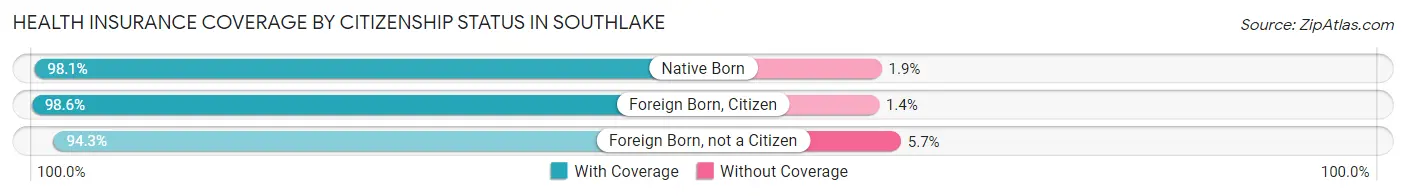
| Citizenship Status | With Coverage | Without Coverage |
| Native Born | 1,890 (98.1%) | 37 (1.9%) |
| Foreign Born, Citizen | 8,547 (98.6%) | 122 (1.4%) |
| Foreign Born, not a Citizen | 909 (94.3%) | 55 (5.7%) |
Health Insurance Coverage by Household Income in Southlake
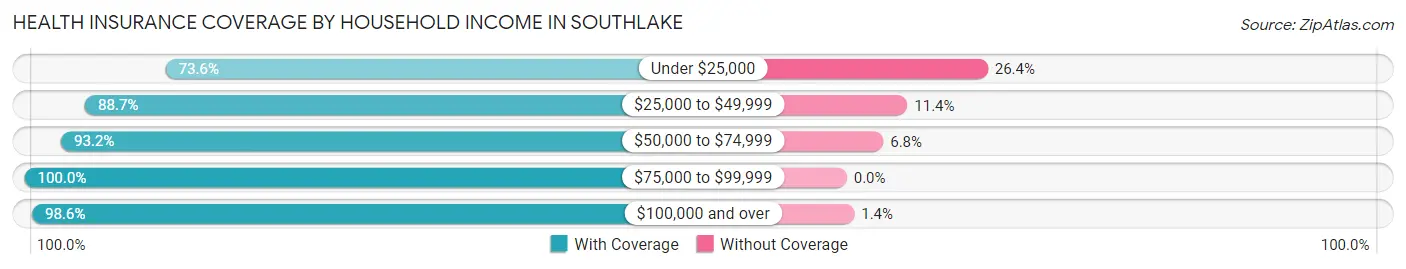
| Household Income | With Coverage | Without Coverage |
| Under $25,000 | 465 (73.6%) | 167 (26.4%) |
| $25,000 to $49,999 | 828 (88.6%) | 106 (11.4%) |
| $50,000 to $74,999 | 695 (93.2%) | 51 (6.8%) |
| $75,000 to $99,999 | 920 (100.0%) | 0 (0.0%) |
| $100,000 and over | 27,074 (98.6%) | 385 (1.4%) |
Public vs Private Health Insurance Coverage by Age in Southlake
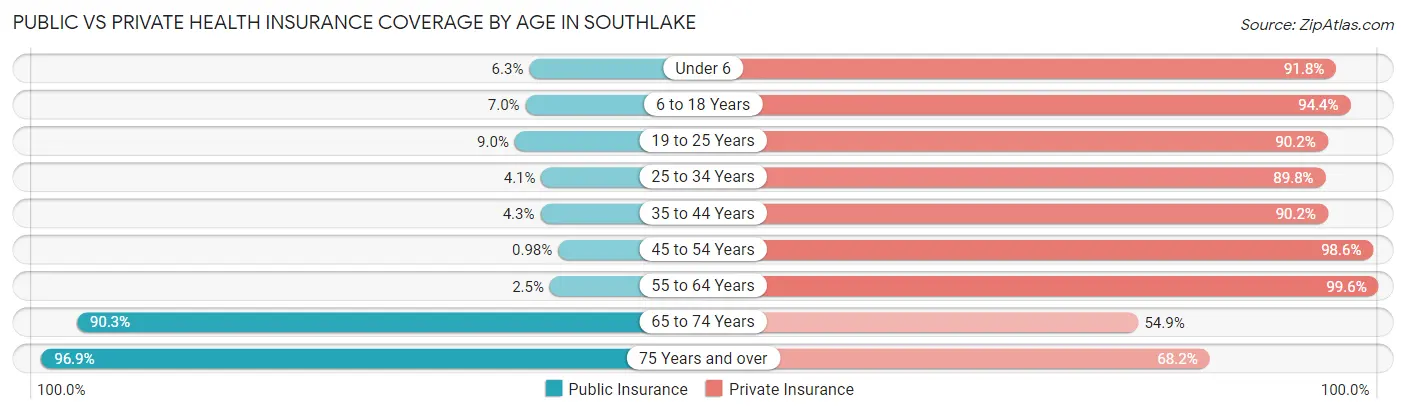
| Age Bracket | Public Insurance | Private Insurance |
| Under 6 | 122 (6.3%) | 1,768 (91.7%) |
| 6 to 18 Years | 610 (7.0%) | 8,183 (94.4%) |
| 19 to 25 Years | 87 (9.0%) | 869 (90.1%) |
| 25 to 34 Years | 39 (4.1%) | 859 (89.8%) |
| 35 to 44 Years | 176 (4.3%) | 3,708 (90.2%) |
| 45 to 54 Years | 56 (1.0%) | 5,638 (98.6%) |
| 55 to 64 Years | 110 (2.5%) | 4,351 (99.6%) |
| 65 to 74 Years | 2,139 (90.3%) | 1,300 (54.9%) |
| 75 Years and over | 1,559 (96.9%) | 1,098 (68.2%) |
| Total | 4,898 (16.0%) | 27,774 (90.5%) |
Disability Status by Sex by Age in Southlake
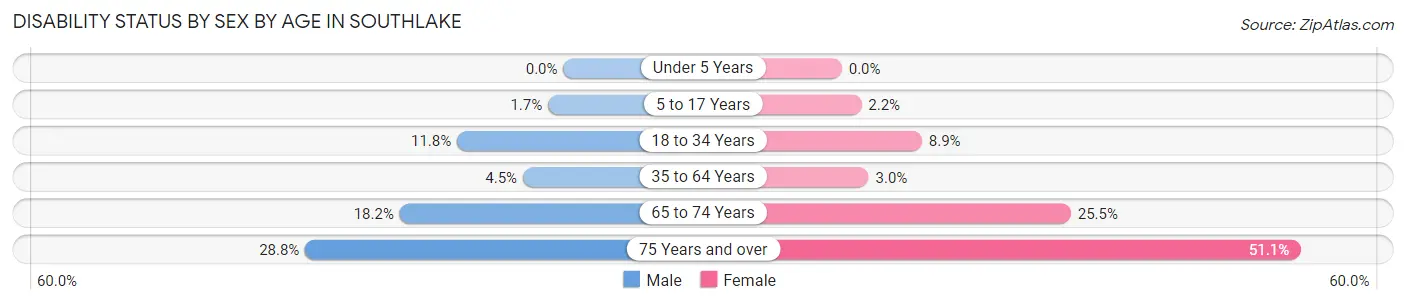
| Age Bracket | Male | Female |
| Under 5 Years | 0 (0.0%) | 0 (0.0%) |
| 5 to 17 Years | 68 (1.7%) | 95 (2.2%) |
| 18 to 34 Years | 136 (11.8%) | 124 (8.9%) |
| 35 to 64 Years | 324 (4.5%) | 208 (3.0%) |
| 65 to 74 Years | 213 (18.2%) | 306 (25.5%) |
| 75 Years and over | 186 (28.7%) | 492 (51.1%) |
Disability Class by Sex by Age in Southlake
Disability Class: Hearing Difficulty
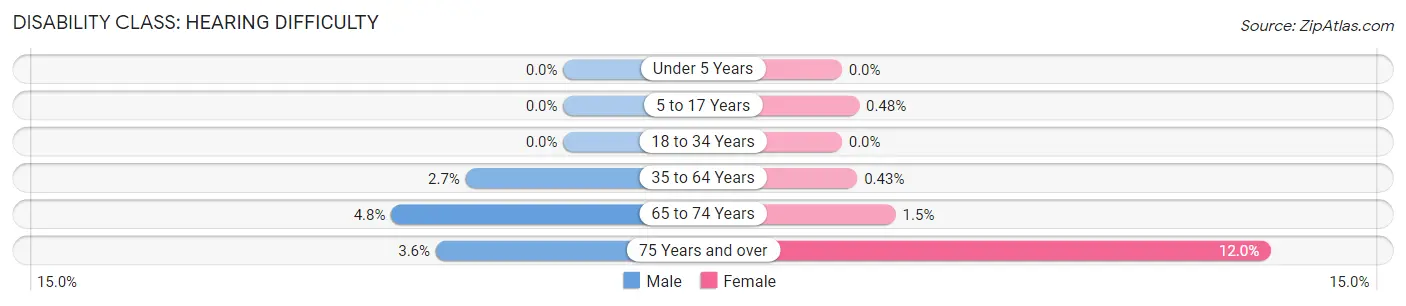
| Age Bracket | Male | Female |
| Under 5 Years | 0 (0.0%) | 0 (0.0%) |
| 5 to 17 Years | 0 (0.0%) | 21 (0.5%) |
| 18 to 34 Years | 0 (0.0%) | 0 (0.0%) |
| 35 to 64 Years | 196 (2.7%) | 30 (0.4%) |
| 65 to 74 Years | 56 (4.8%) | 18 (1.5%) |
| 75 Years and over | 23 (3.5%) | 115 (11.9%) |
Disability Class: Vision Difficulty
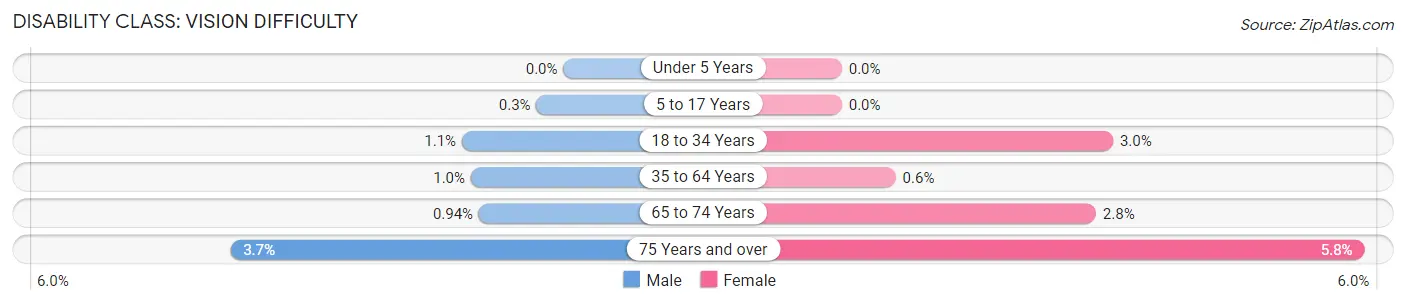
| Age Bracket | Male | Female |
| Under 5 Years | 0 (0.0%) | 0 (0.0%) |
| 5 to 17 Years | 12 (0.3%) | 0 (0.0%) |
| 18 to 34 Years | 13 (1.1%) | 42 (3.0%) |
| 35 to 64 Years | 74 (1.0%) | 42 (0.6%) |
| 65 to 74 Years | 11 (0.9%) | 34 (2.8%) |
| 75 Years and over | 24 (3.7%) | 56 (5.8%) |
Disability Class: Cognitive Difficulty
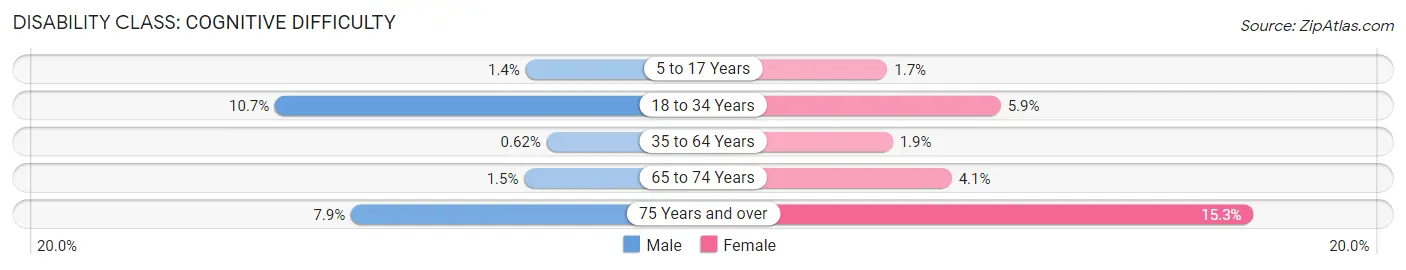
| Age Bracket | Male | Female |
| 5 to 17 Years | 56 (1.4%) | 74 (1.7%) |
| 18 to 34 Years | 123 (10.7%) | 82 (5.9%) |
| 35 to 64 Years | 45 (0.6%) | 132 (1.9%) |
| 65 to 74 Years | 17 (1.5%) | 49 (4.1%) |
| 75 Years and over | 51 (7.9%) | 147 (15.3%) |
Disability Class: Ambulatory Difficulty
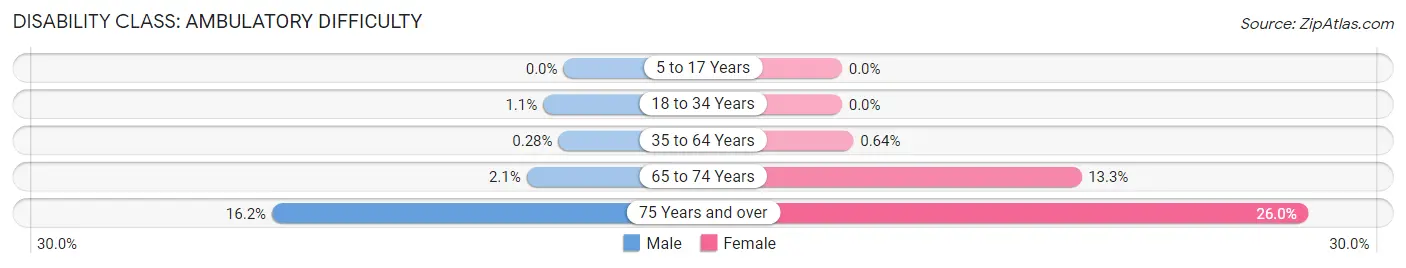
| Age Bracket | Male | Female |
| 5 to 17 Years | 0 (0.0%) | 0 (0.0%) |
| 18 to 34 Years | 13 (1.1%) | 0 (0.0%) |
| 35 to 64 Years | 20 (0.3%) | 45 (0.6%) |
| 65 to 74 Years | 24 (2.1%) | 160 (13.3%) |
| 75 Years and over | 105 (16.2%) | 250 (26.0%) |
Disability Class: Self-Care Difficulty
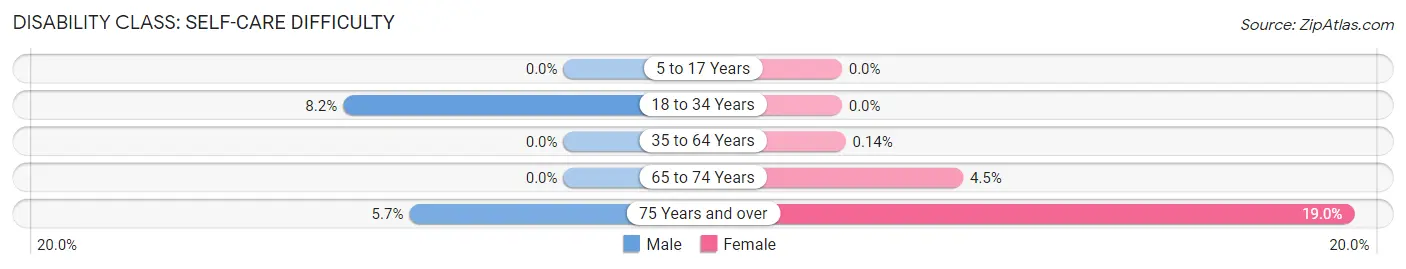
| Age Bracket | Male | Female |
| 5 to 17 Years | 0 (0.0%) | 0 (0.0%) |
| 18 to 34 Years | 94 (8.2%) | 0 (0.0%) |
| 35 to 64 Years | 0 (0.0%) | 10 (0.1%) |
| 65 to 74 Years | 0 (0.0%) | 54 (4.5%) |
| 75 Years and over | 37 (5.7%) | 183 (19.0%) |
Technology Access in Southlake
Computing Device Access in Southlake
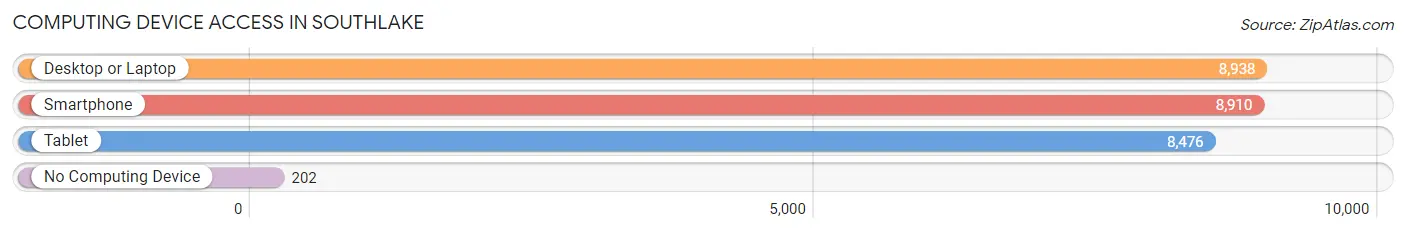
| Device Type | # Households | % Households |
| Desktop or Laptop | 8,938 | 96.1% |
| Smartphone | 8,910 | 95.8% |
| Tablet | 8,476 | 91.2% |
| No Computing Device | 202 | 2.2% |
| Total | 9,298 | 100.0% |
Internet Access in Southlake
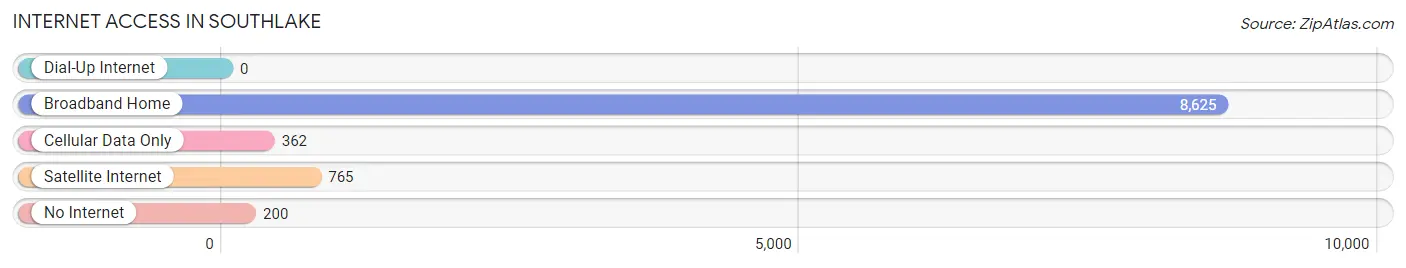
| Internet Type | # Households | % Households |
| Dial-Up Internet | 0 | 0.0% |
| Broadband Home | 8,625 | 92.8% |
| Cellular Data Only | 362 | 3.9% |
| Satellite Internet | 765 | 8.2% |
| No Internet | 200 | 2.1% |
| Total | 9,298 | 100.0% |
Southlake Summary
Southlake, Texas is a city located in the Dallas-Fort Worth metropolitan area in Tarrant County. It is a suburb of Fort Worth and is located about 25 miles northwest of Dallas. The city is known for its high quality of life, excellent schools, and strong economy.
History
Southlake was first settled in the late 1800s by a group of settlers from Kentucky. The town was originally called “Union Church” and was located near the intersection of what is now State Highway 114 and Southlake Boulevard. The town was renamed Southlake in 1925 when the Southlake post office was established.
In the 1950s, Southlake began to experience rapid growth due to its proximity to the Dallas-Fort Worth metropolitan area. The city was officially incorporated in 1956 and has since grown to a population of over 30,000.
Geography
Southlake is located in the Dallas-Fort Worth metropolitan area in Tarrant County. It is situated on the northern edge of the Dallas-Fort Worth Metroplex, about 25 miles northwest of Dallas. The city is bordered by Grapevine to the east, Keller to the south, and Westlake to the west.
The city has a total area of 21.2 square miles, of which 21.1 square miles is land and 0.1 square miles is water. The terrain is mostly flat with some rolling hills. The city is located in the Blackland Prairie region of Texas, which is characterized by its rich, fertile soil.
Economy
Southlake is home to a strong and diverse economy. The city is home to several major employers, including Sabre Corporation, Charles Schwab, and Fidelity Investments. The city is also home to several corporate headquarters, including GameStop, Dr Pepper Snapple Group, and RadioShack.
The city’s economy is also bolstered by its thriving retail sector. Southlake Town Square is a popular shopping destination, featuring over 100 stores and restaurants. The city is also home to several major hotels, including the Hilton Southlake Town Square and the Marriott Solana.
Demographics
As of the 2010 census, Southlake had a population of 26,575. The racial makeup of the city was 79.2% White, 8.3% African American, 0.3% Native American, 8.2% Asian, 0.1% Pacific Islander, 1.7% from other races, and 2.4% from two or more races. Hispanic or Latino of any race were 6.7% of the population.
The median income for a household in the city was $118,845, and the median income for a family was $136,867. The per capita income for the city was $50,945. About 2.7% of families and 3.3% of the population were below the poverty line, including 3.7% of those under age 18 and 3.2% of those age 65 or over.
Southlake is a vibrant and prosperous city with a high quality of life. The city is home to excellent schools, a strong economy, and a diverse population. Southlake is a great place to live, work, and play.
Common Questions
What is Per Capita Income in Southlake?
Per Capita income in Southlake is $110,228.
What is the Median Family Income in Southlake?
Median Family Income in Southlake is $250,001.
What is the Median Household income in Southlake?
Median Household Income in Southlake is $250,001.
What is Income or Wage Gap in Southlake?
Income or Wage Gap in Southlake is 68.7%.
Women in Southlake earn 31.3 cents for every dollar earned by a man.
What is Inequality or Gini Index in Southlake?
Inequality or Gini Index in Southlake is 0.44.
What is the Total Population of Southlake?
Total Population of Southlake is 30,779.
What is the Total Male Population of Southlake?
Total Male Population of Southlake is 15,078.
What is the Total Female Population of Southlake?
Total Female Population of Southlake is 15,701.
What is the Ratio of Males per 100 Females in Southlake?
There are 96.03 Males per 100 Females in Southlake.
What is the Ratio of Females per 100 Males in Southlake?
There are 104.13 Females per 100 Males in Southlake.
What is the Median Population Age in Southlake?
Median Population Age in Southlake is 42.3 Years.
What is the Average Family Size in Southlake
Average Family Size in Southlake is 3.5 People.
What is the Average Household Size in Southlake
Average Household Size in Southlake is 3.3 People.
How Large is the Labor Force in Southlake?
There are 13,276 People in the Labor Forcein in Southlake.
What is the Percentage of People in the Labor Force in Southlake?
60.0% of People are in the Labor Force in Southlake.
What is the Unemployment Rate in Southlake?
Unemployment Rate in Southlake is 2.5%.