Pecan Acres, TX Map & Demographics
Pecan Acres Map
Pecan Acres Overview
$59,514
PER CAPITA INCOME
$133,646
AVG FAMILY INCOME
$119,231
AVG HOUSEHOLD INCOME
38.3%
WAGE / INCOME GAP [ % ]
61.7¢/ $1
WAGE / INCOME GAP [ $ ]
$12,250
FAMILY INCOME DEFICIT
0.47
INEQUALITY / GINI INDEX
3,981
TOTAL POPULATION
2,114
MALE POPULATION
1,867
FEMALE POPULATION
113.23
MALES / 100 FEMALES
88.32
FEMALES / 100 MALES
43.2
MEDIAN AGE
3.1
AVG FAMILY SIZE
2.9
AVG HOUSEHOLD SIZE
1,909
LABOR FORCE [ PEOPLE ]
59.7%
PERCENT IN LABOR FORCE
12.4%
UNEMPLOYMENT RATE
Income in Pecan Acres
Income Overview in Pecan Acres
Per Capita Income in Pecan Acres is $59,514, while median incomes of families and households are $133,646 and $119,231 respectively.
| Characteristic | Number | Measure |
| Per Capita Income | 3,981 | $59,514 |
| Median Family Income | 1,177 | $133,646 |
| Mean Family Income | 1,177 | $186,333 |
| Median Household Income | 1,388 | $119,231 |
| Mean Household Income | 1,388 | $169,118 |
| Income Deficit | 1,177 | $12,250 |
| Wage / Income Gap (%) | 3,981 | 38.31% |
| Wage / Income Gap ($) | 3,981 | 61.69¢ per $1 |
| Gini / Inequality Index | 3,981 | 0.47 |
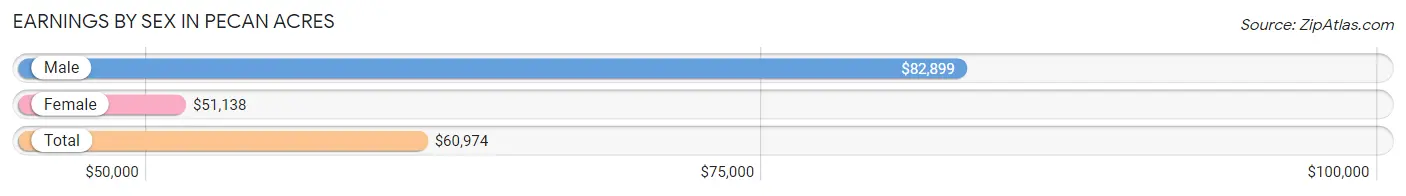
Earnings by Sex in Pecan Acres
Average Earnings in Pecan Acres are $60,974, $82,899 for men and $51,138 for women, a difference of 38.3%.
| Sex | Number | Average Earnings |
| Male | 1,023 (55.4%) | $82,899 |
| Female | 823 (44.6%) | $51,138 |
| Total | 1,846 (100.0%) | $60,974 |
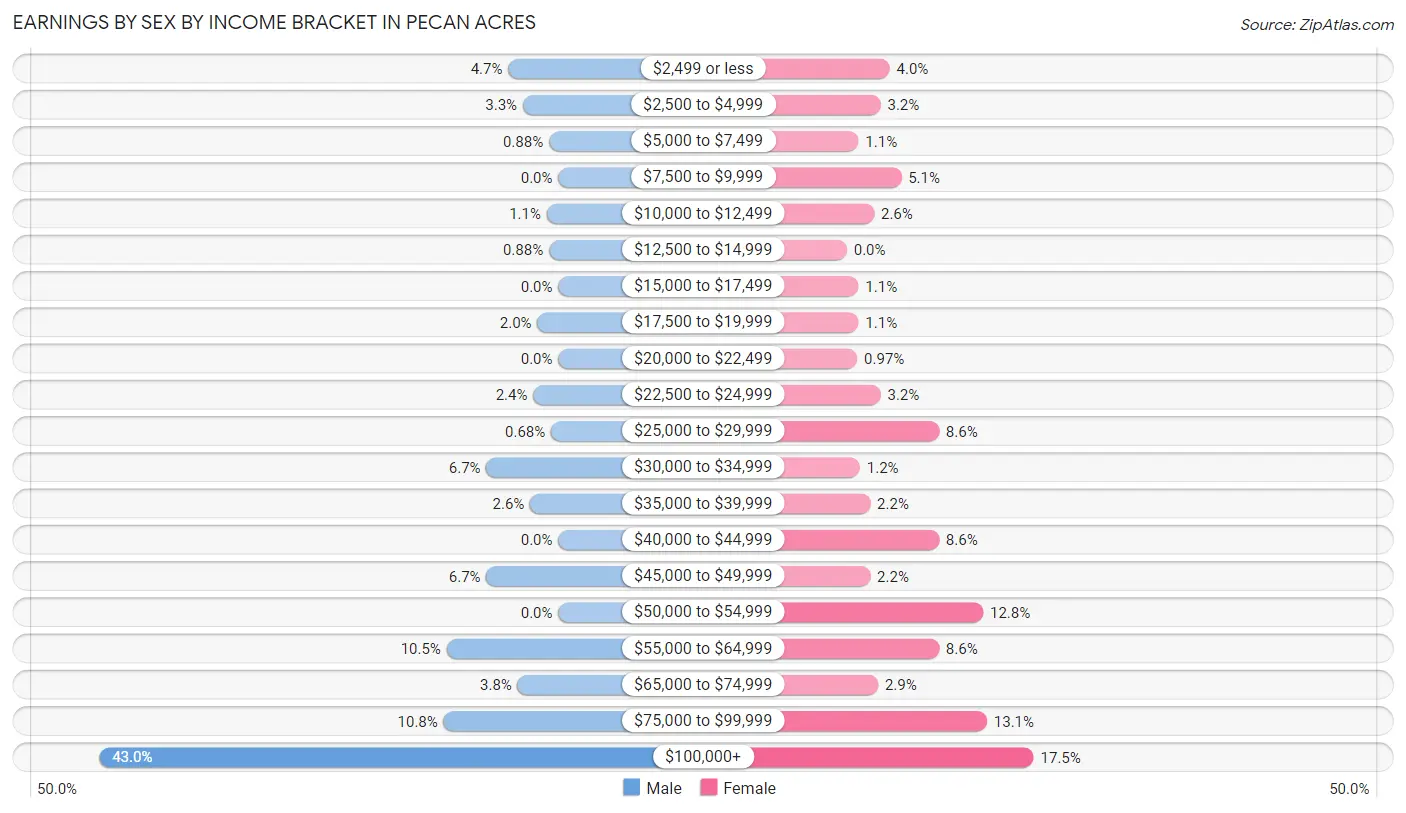
Earnings by Sex by Income Bracket in Pecan Acres
The most common earnings brackets in Pecan Acres are $100,000+ for men (440 | 43.0%) and $100,000+ for women (144 | 17.5%).
| Income | Male | Female |
| $2,499 or less | 48 (4.7%) | 33 (4.0%) |
| $2,500 to $4,999 | 34 (3.3%) | 26 (3.2%) |
| $5,000 to $7,499 | 9 (0.9%) | 9 (1.1%) |
| $7,500 to $9,999 | 0 (0.0%) | 42 (5.1%) |
| $10,000 to $12,499 | 11 (1.1%) | 21 (2.5%) |
| $12,500 to $14,999 | 9 (0.9%) | 0 (0.0%) |
| $15,000 to $17,499 | 0 (0.0%) | 9 (1.1%) |
| $17,500 to $19,999 | 20 (2.0%) | 9 (1.1%) |
| $20,000 to $22,499 | 0 (0.0%) | 8 (1.0%) |
| $22,500 to $24,999 | 24 (2.4%) | 26 (3.2%) |
| $25,000 to $29,999 | 7 (0.7%) | 71 (8.6%) |
| $30,000 to $34,999 | 69 (6.7%) | 10 (1.2%) |
| $35,000 to $39,999 | 27 (2.6%) | 18 (2.2%) |
| $40,000 to $44,999 | 0 (0.0%) | 71 (8.6%) |
| $45,000 to $49,999 | 69 (6.7%) | 18 (2.2%) |
| $50,000 to $54,999 | 0 (0.0%) | 105 (12.8%) |
| $55,000 to $64,999 | 107 (10.5%) | 71 (8.6%) |
| $65,000 to $74,999 | 39 (3.8%) | 24 (2.9%) |
| $75,000 to $99,999 | 110 (10.7%) | 108 (13.1%) |
| $100,000+ | 440 (43.0%) | 144 (17.5%) |
| Total | 1,023 (100.0%) | 823 (100.0%) |
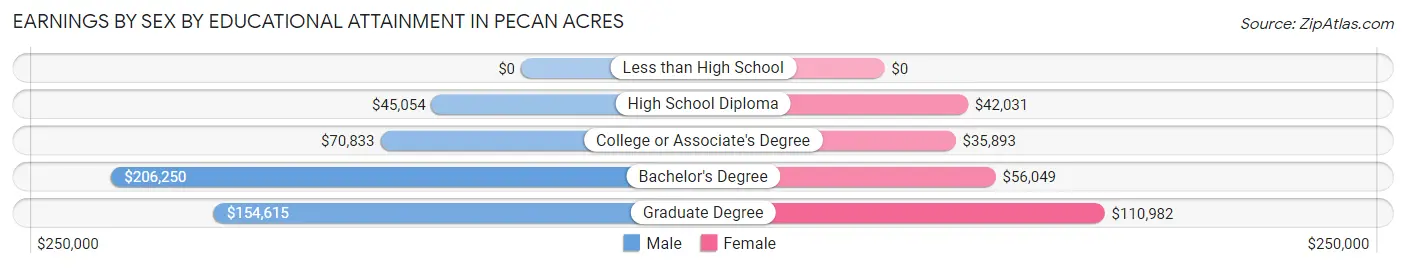
Earnings by Sex by Educational Attainment in Pecan Acres
Average earnings in Pecan Acres are $85,875 for men and $51,742 for women, a difference of 39.8%. Men with an educational attainment of bachelor's degree enjoy the highest average annual earnings of $206,250, while those with high school diploma education earn the least with $45,054. Women with an educational attainment of graduate degree earn the most with the average annual earnings of $110,982, while those with college or associate's degree education have the smallest earnings of $35,893.
| Educational Attainment | Male Income | Female Income |
| Less than High School | - | - |
| High School Diploma | $45,054 | $42,031 |
| College or Associate's Degree | $70,833 | $35,893 |
| Bachelor's Degree | $206,250 | $56,049 |
| Graduate Degree | $154,615 | $110,982 |
| Total | $85,875 | $51,742 |
Family Income in Pecan Acres
Family Income Brackets in Pecan Acres
According to the Pecan Acres family income data, there are 331 families falling into the $200,000+ income range, which is the most common income bracket and makes up 28.1% of all families. Conversely, the $10,000 to $14,999 income bracket is the least frequent group with only 8 families (0.7%) belonging to this category.
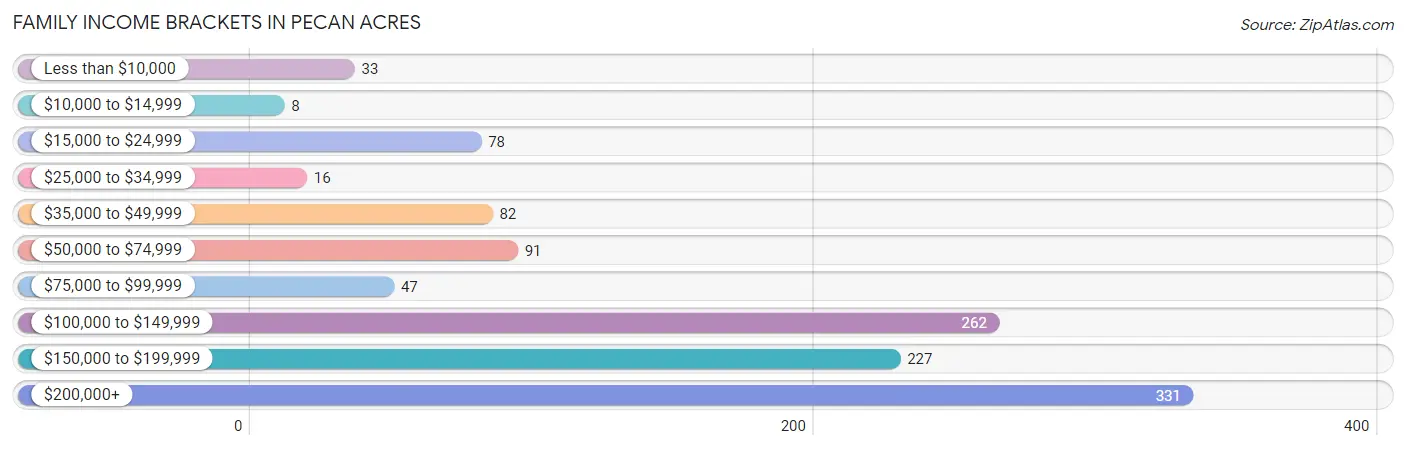
| Income Bracket | # Families | % Families |
| Less than $10,000 | 33 | 2.8% |
| $10,000 to $14,999 | 8 | 0.7% |
| $15,000 to $24,999 | 78 | 6.6% |
| $25,000 to $34,999 | 16 | 1.4% |
| $35,000 to $49,999 | 82 | 7.0% |
| $50,000 to $74,999 | 91 | 7.7% |
| $75,000 to $99,999 | 47 | 4.0% |
| $100,000 to $149,999 | 262 | 22.3% |
| $150,000 to $199,999 | 227 | 19.3% |
| $200,000+ | 331 | 28.1% |
Family Income by Famaliy Size in Pecan Acres
5-person families (181 | 15.4%) account for the highest median family income in Pecan Acres with $161,114 per family, while 2-person families (602 | 51.1%) have the highest median income of $62,059 per family member.
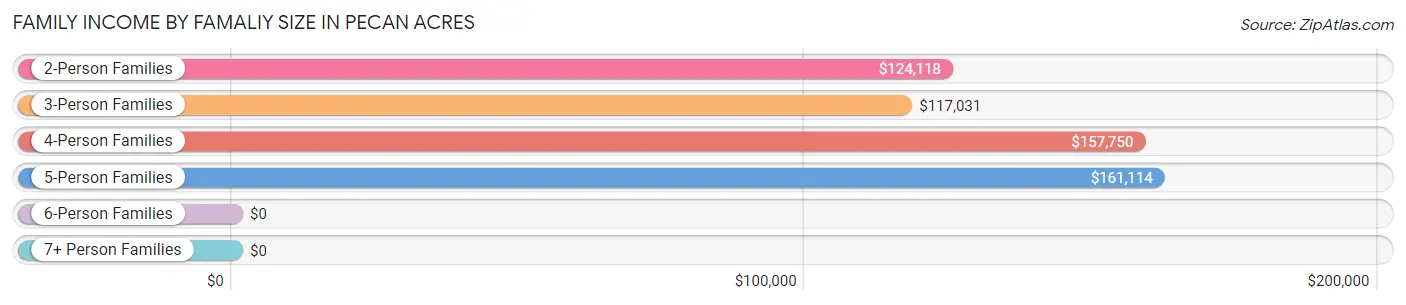
| Income Bracket | # Families | Median Income |
| 2-Person Families | 602 (51.1%) | $124,118 |
| 3-Person Families | 181 (15.4%) | $117,031 |
| 4-Person Families | 192 (16.3%) | $157,750 |
| 5-Person Families | 181 (15.4%) | $161,114 |
| 6-Person Families | 10 (0.9%) | $0 |
| 7+ Person Families | 11 (0.9%) | $0 |
| Total | 1,177 (100.0%) | $133,646 |
Family Income by Number of Earners in Pecan Acres
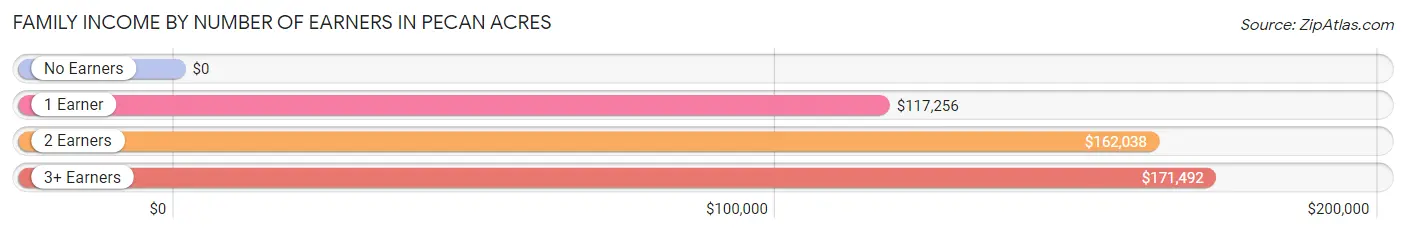
| Number of Earners | # Families | Median Income |
| No Earners | 239 (20.3%) | $0 |
| 1 Earner | 412 (35.0%) | $117,256 |
| 2 Earners | 441 (37.5%) | $162,038 |
| 3+ Earners | 85 (7.2%) | $171,492 |
| Total | 1,177 (100.0%) | $133,646 |
Household Income in Pecan Acres
Household Income Brackets in Pecan Acres
With 339 households falling in the category, the $200,000+ income range is the most frequent in Pecan Acres, accounting for 24.4% of all households. In contrast, only 8 households (0.6%) fall into the $10,000 to $14,999 income bracket, making it the least populous group.
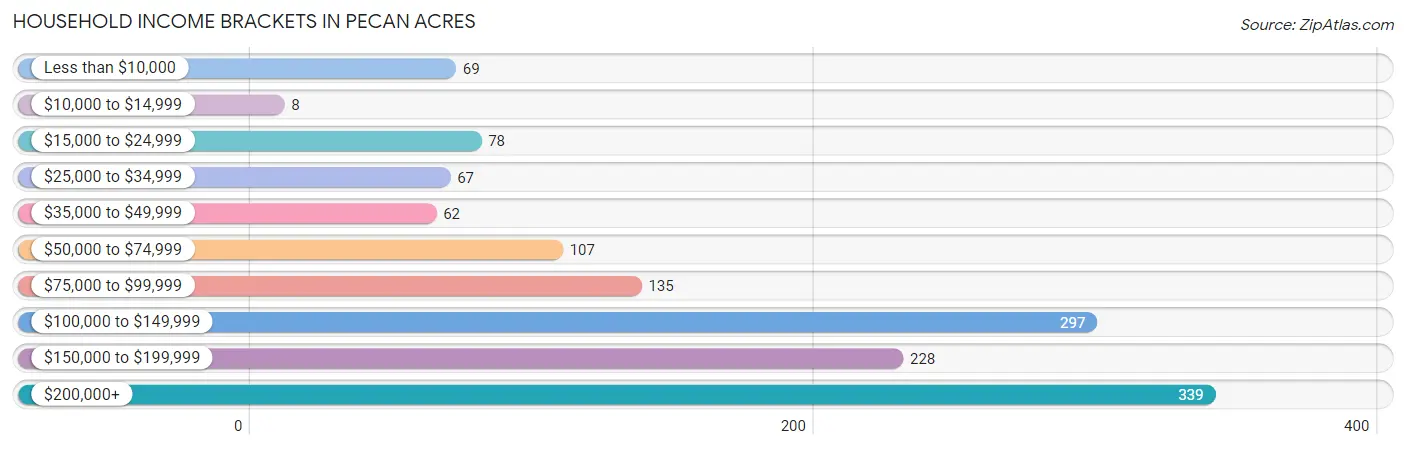
| Income Bracket | # Households | % Households |
| Less than $10,000 | 69 | 5.0% |
| $10,000 to $14,999 | 8 | 0.6% |
| $15,000 to $24,999 | 78 | 5.6% |
| $25,000 to $34,999 | 67 | 4.8% |
| $35,000 to $49,999 | 62 | 4.5% |
| $50,000 to $74,999 | 107 | 7.7% |
| $75,000 to $99,999 | 135 | 9.7% |
| $100,000 to $149,999 | 297 | 21.4% |
| $150,000 to $199,999 | 228 | 16.4% |
| $200,000+ | 339 | 24.4% |
Household Income by Householder Age in Pecan Acres
The median household income in Pecan Acres is $119,231, with the highest median household income of $136,964 found in the 45 to 64 years age bracket for the primary householder. A total of 743 households (53.5%) fall into this category. Meanwhile, the 15 to 24 years age bracket for the primary householder has the lowest median household income of $0, with 9 households (0.6%) in this group.
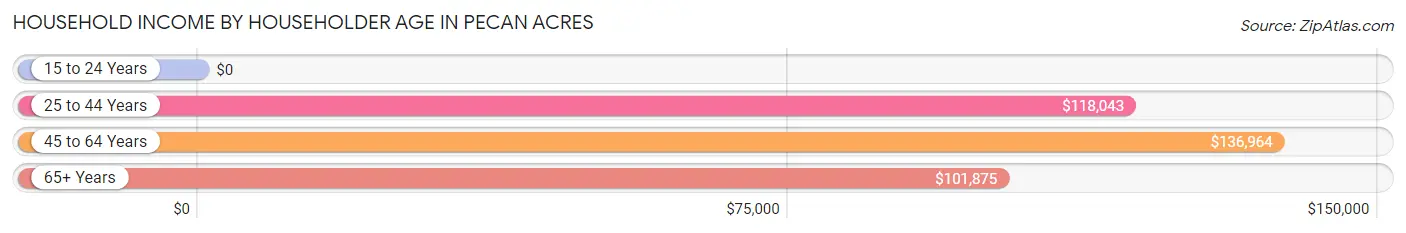
| Income Bracket | # Households | Median Income |
| 15 to 24 Years | 9 (0.6%) | $0 |
| 25 to 44 Years | 386 (27.8%) | $118,043 |
| 45 to 64 Years | 743 (53.5%) | $136,964 |
| 65+ Years | 250 (18.0%) | $101,875 |
| Total | 1,388 (100.0%) | $119,231 |
Poverty in Pecan Acres
Income Below Poverty by Sex and Age in Pecan Acres
With 16.3% poverty level for males and 12.6% for females among the residents of Pecan Acres, 5 year old males and 35 to 44 year old females are the most vulnerable to poverty, with 21 males (100.0%) and 106 females (35.1%) in their respective age groups living below the poverty level.
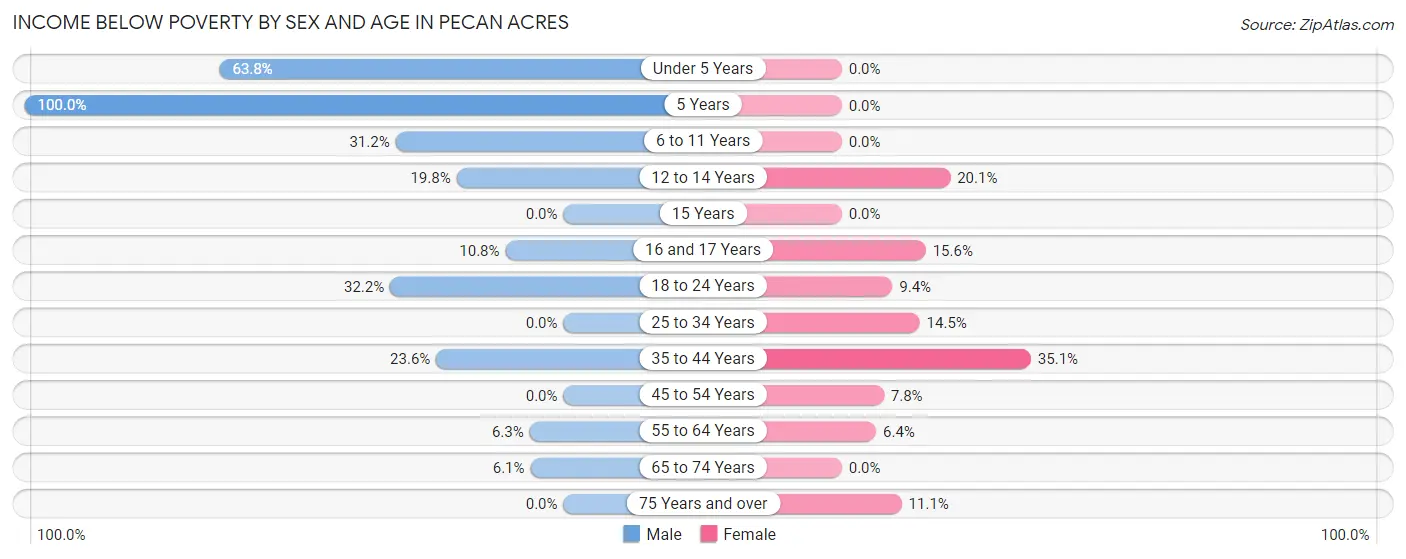
| Age Bracket | Male | Female |
| Under 5 Years | 30 (63.8%) | 0 (0.0%) |
| 5 Years | 21 (100.0%) | 0 (0.0%) |
| 6 to 11 Years | 86 (31.2%) | 0 (0.0%) |
| 12 to 14 Years | 25 (19.8%) | 31 (20.1%) |
| 15 Years | 0 (0.0%) | 0 (0.0%) |
| 16 and 17 Years | 17 (10.8%) | 12 (15.6%) |
| 18 to 24 Years | 64 (32.2%) | 9 (9.4%) |
| 25 to 34 Years | 0 (0.0%) | 25 (14.4%) |
| 35 to 44 Years | 68 (23.6%) | 106 (35.1%) |
| 45 to 54 Years | 0 (0.0%) | 28 (7.8%) |
| 55 to 64 Years | 24 (6.3%) | 18 (6.4%) |
| 65 to 74 Years | 9 (6.1%) | 0 (0.0%) |
| 75 Years and over | 0 (0.0%) | 7 (11.1%) |
| Total | 344 (16.3%) | 236 (12.6%) |
Income Above Poverty by Sex and Age in Pecan Acres
According to the poverty statistics in Pecan Acres, males aged 25 to 34 years and females aged under 5 years are the age groups that are most secure financially, with 100.0% of males and 100.0% of females in these age groups living above the poverty line.
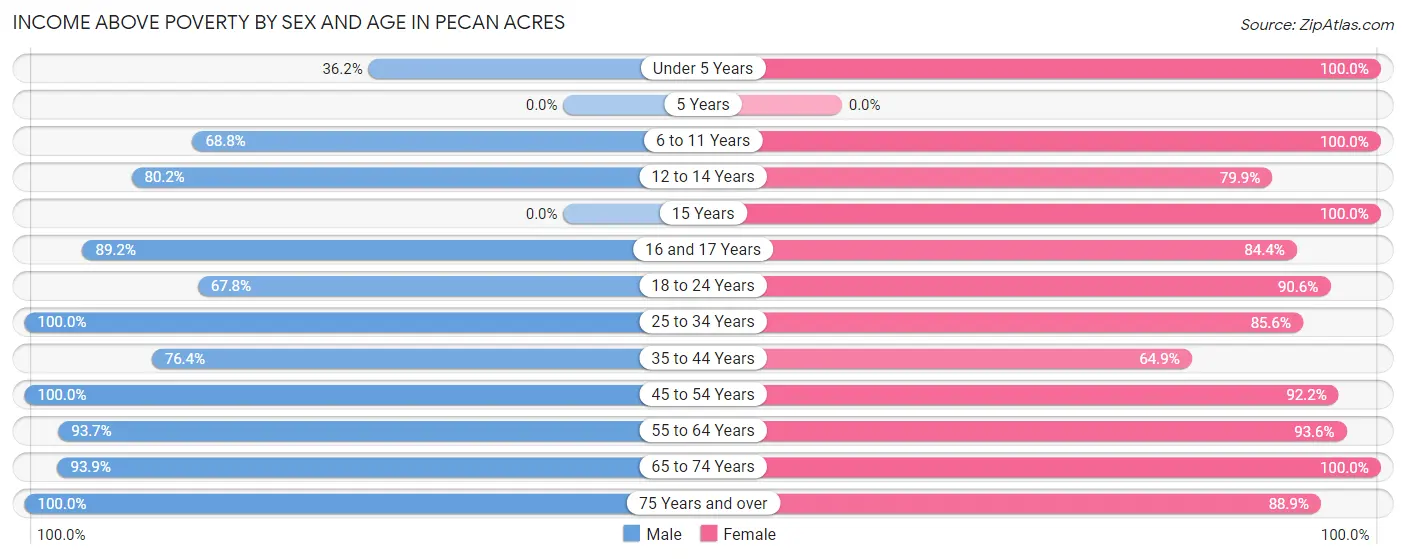
| Age Bracket | Male | Female |
| Under 5 Years | 17 (36.2%) | 13 (100.0%) |
| 5 Years | 0 (0.0%) | 0 (0.0%) |
| 6 to 11 Years | 190 (68.8%) | 71 (100.0%) |
| 12 to 14 Years | 101 (80.2%) | 123 (79.9%) |
| 15 Years | 0 (0.0%) | 75 (100.0%) |
| 16 and 17 Years | 141 (89.2%) | 65 (84.4%) |
| 18 to 24 Years | 135 (67.8%) | 87 (90.6%) |
| 25 to 34 Years | 118 (100.0%) | 148 (85.6%) |
| 35 to 44 Years | 220 (76.4%) | 196 (64.9%) |
| 45 to 54 Years | 267 (100.0%) | 331 (92.2%) |
| 55 to 64 Years | 359 (93.7%) | 265 (93.6%) |
| 65 to 74 Years | 138 (93.9%) | 201 (100.0%) |
| 75 Years and over | 84 (100.0%) | 56 (88.9%) |
| Total | 1,770 (83.7%) | 1,631 (87.4%) |
Income Below Poverty Among Married-Couple Families in Pecan Acres
The poverty statistics for married-couple families in Pecan Acres show that 4.4% or 43 of the total 976 families live below the poverty line. Families with 3 or 4 children have the highest poverty rate of 39.0%, comprising of 32 families. On the other hand, families with 1 or 2 children have the lowest poverty rate of 0.0%, which includes 0 families.
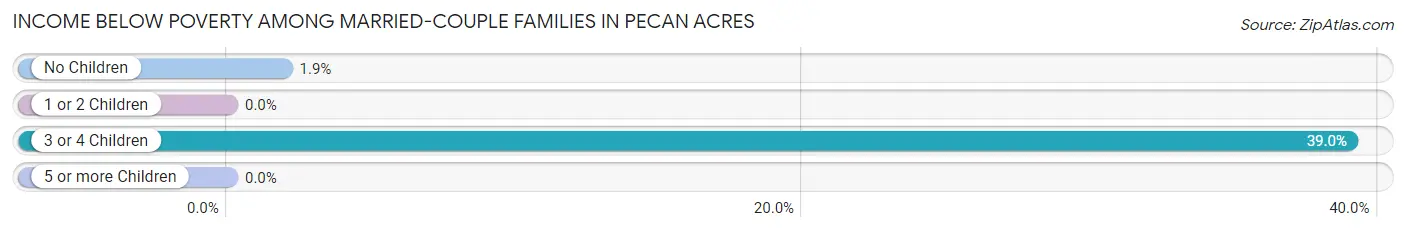
| Children | Above Poverty | Below Poverty |
| No Children | 569 (98.1%) | 11 (1.9%) |
| 1 or 2 Children | 314 (100.0%) | 0 (0.0%) |
| 3 or 4 Children | 50 (61.0%) | 32 (39.0%) |
| 5 or more Children | 0 (0.0%) | 0 (0.0%) |
| Total | 933 (95.6%) | 43 (4.4%) |
Income Below Poverty Among Single-Parent Households in Pecan Acres
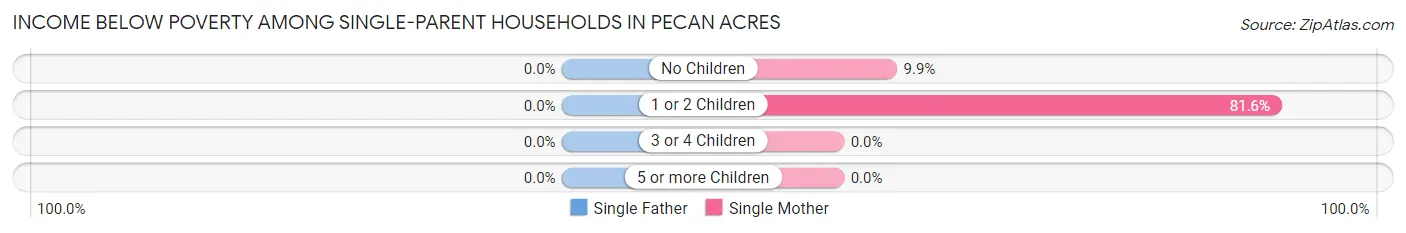
| Children | Single Father | Single Mother |
| No Children | 0 (0.0%) | 7 (9.9%) |
| 1 or 2 Children | 0 (0.0%) | 71 (81.6%) |
| 3 or 4 Children | 0 (0.0%) | 0 (0.0%) |
| 5 or more Children | 0 (0.0%) | 0 (0.0%) |
| Total | 0 (0.0%) | 78 (49.4%) |
Income Below Poverty Among Married-Couple vs Single-Parent Households in Pecan Acres
The poverty data for Pecan Acres shows that 43 of the married-couple family households (4.4%) and 78 of the single-parent households (38.8%) are living below the poverty level. Within the married-couple family households, those with 3 or 4 children have the highest poverty rate, with 32 households (39.0%) falling below the poverty line. Among the single-parent households, those with 1 or 2 children have the highest poverty rate, with 71 household (66.4%) living below poverty.
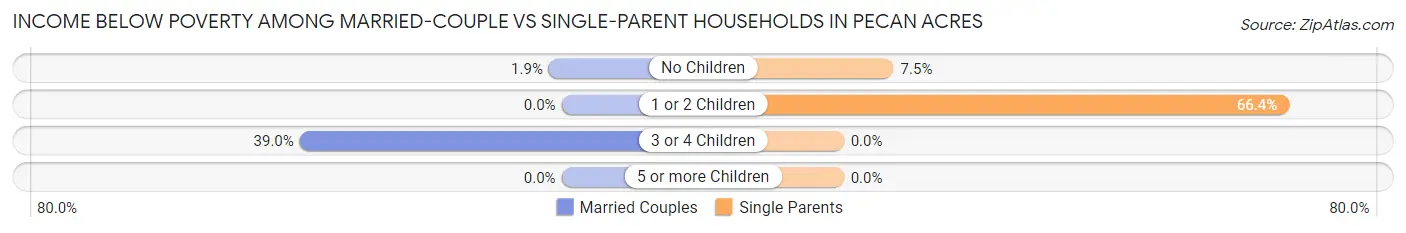
| Children | Married-Couple Families | Single-Parent Households |
| No Children | 11 (1.9%) | 7 (7.4%) |
| 1 or 2 Children | 0 (0.0%) | 71 (66.4%) |
| 3 or 4 Children | 32 (39.0%) | 0 (0.0%) |
| 5 or more Children | 0 (0.0%) | 0 (0.0%) |
| Total | 43 (4.4%) | 78 (38.8%) |
Race in Pecan Acres
The most populous races in Pecan Acres are White / Caucasian (3,787 | 95.1%), Hispanic or Latino (517 | 13.0%), and Two or more Races (130 | 3.3%).
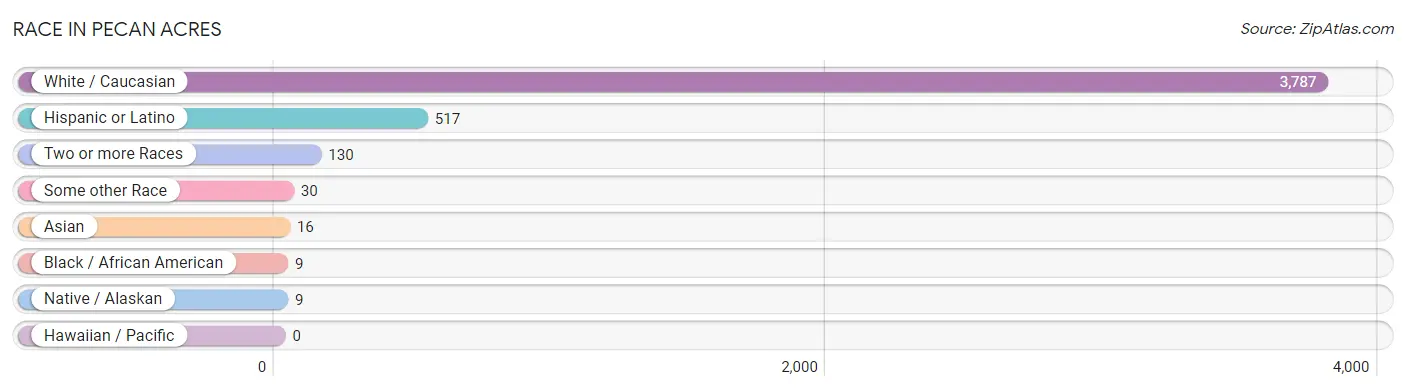
| Race | # Population | % Population |
| Asian | 16 | 0.4% |
| Black / African American | 9 | 0.2% |
| Hawaiian / Pacific | 0 | 0.0% |
| Hispanic or Latino | 517 | 13.0% |
| Native / Alaskan | 9 | 0.2% |
| White / Caucasian | 3,787 | 95.1% |
| Two or more Races | 130 | 3.3% |
| Some other Race | 30 | 0.7% |
| Total | 3,981 | 100.0% |
Ancestry in Pecan Acres
The most populous ancestries reported in Pecan Acres are English (819 | 20.6%), German (581 | 14.6%), Irish (544 | 13.7%), Mexican (345 | 8.7%), and American (174 | 4.4%), together accounting for 61.9% of all Pecan Acres residents.
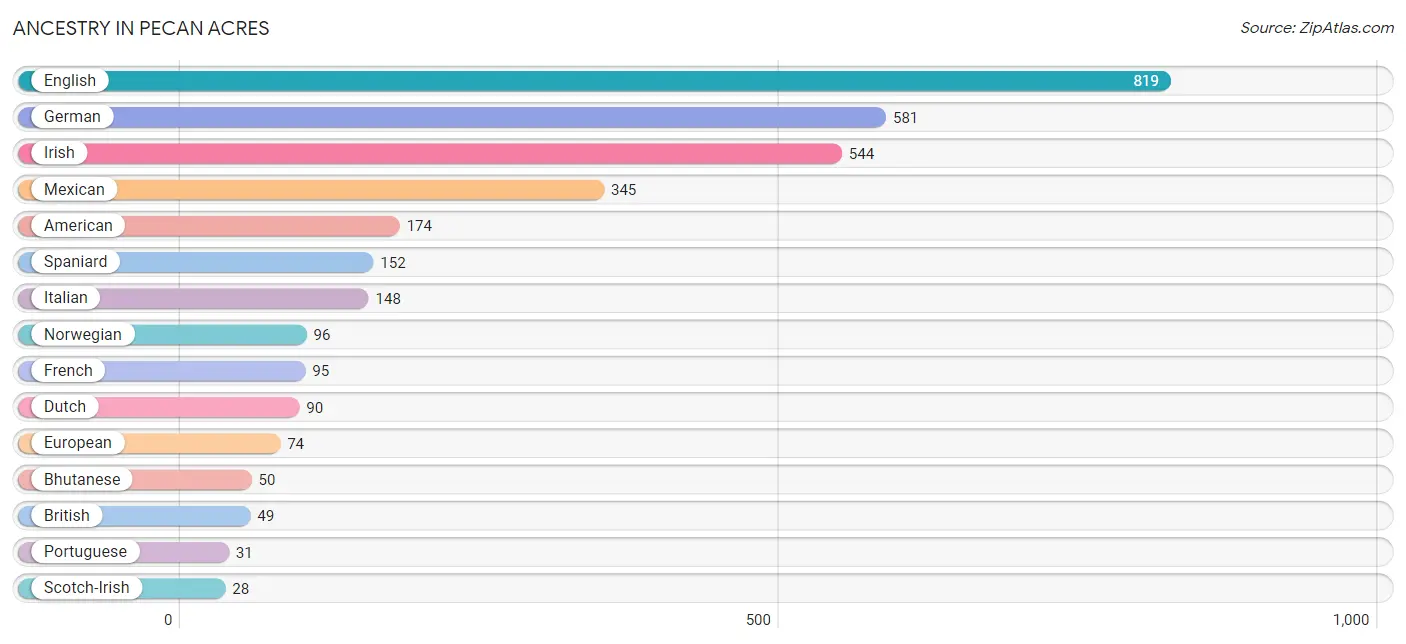
| Ancestry | # Population | % Population |
| African | 9 | 0.2% |
| American | 174 | 4.4% |
| Arab | 20 | 0.5% |
| Argentinean | 20 | 0.5% |
| Bhutanese | 50 | 1.3% |
| Brazilian | 21 | 0.5% |
| British | 49 | 1.2% |
| Cherokee | 9 | 0.2% |
| Choctaw | 9 | 0.2% |
| Czech | 21 | 0.5% |
| Dutch | 90 | 2.3% |
| English | 819 | 20.6% |
| European | 74 | 1.9% |
| Finnish | 9 | 0.2% |
| French | 95 | 2.4% |
| German | 581 | 14.6% |
| Hungarian | 9 | 0.2% |
| Irish | 544 | 13.7% |
| Italian | 148 | 3.7% |
| Mexican | 345 | 8.7% |
| Norwegian | 96 | 2.4% |
| Palestinian | 20 | 0.5% |
| Polish | 17 | 0.4% |
| Portuguese | 31 | 0.8% |
| Romanian | 17 | 0.4% |
| Scandinavian | 9 | 0.2% |
| Scotch-Irish | 28 | 0.7% |
| Scottish | 22 | 0.5% |
| South American | 20 | 0.5% |
| Spaniard | 152 | 3.8% |
| Subsaharan African | 9 | 0.2% | View All 31 Rows |
Immigrants in Pecan Acres
The most numerous immigrant groups reported in Pecan Acres came from Latin America (79 | 2.0%), Europe (41 | 1.0%), South America (41 | 1.0%), Central America (38 | 0.9%), and Mexico (38 | 0.9%), together accounting for 5.9% of all Pecan Acres residents.
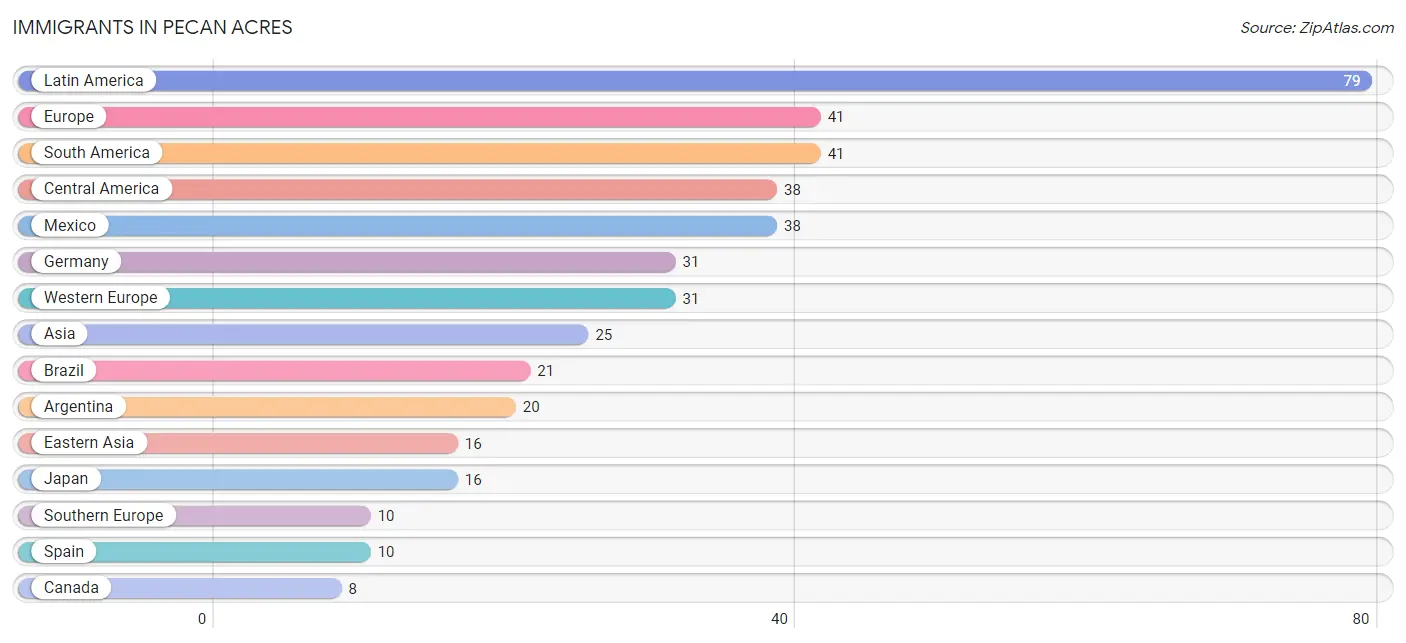
| Immigration Origin | # Population | % Population |
| Argentina | 20 | 0.5% |
| Asia | 25 | 0.6% |
| Brazil | 21 | 0.5% |
| Canada | 8 | 0.2% |
| Central America | 38 | 0.9% |
| Eastern Asia | 16 | 0.4% |
| Europe | 41 | 1.0% |
| Germany | 31 | 0.8% |
| Japan | 16 | 0.4% |
| Latin America | 79 | 2.0% |
| Mexico | 38 | 0.9% |
| South America | 41 | 1.0% |
| Southern Europe | 10 | 0.3% |
| Spain | 10 | 0.3% |
| Western Europe | 31 | 0.8% | View All 15 Rows |
Sex and Age in Pecan Acres
Sex and Age in Pecan Acres
The most populous age groups in Pecan Acres are 15 to 19 Years (321 | 15.2%) for men and 50 to 54 Years (273 | 14.6%) for women.
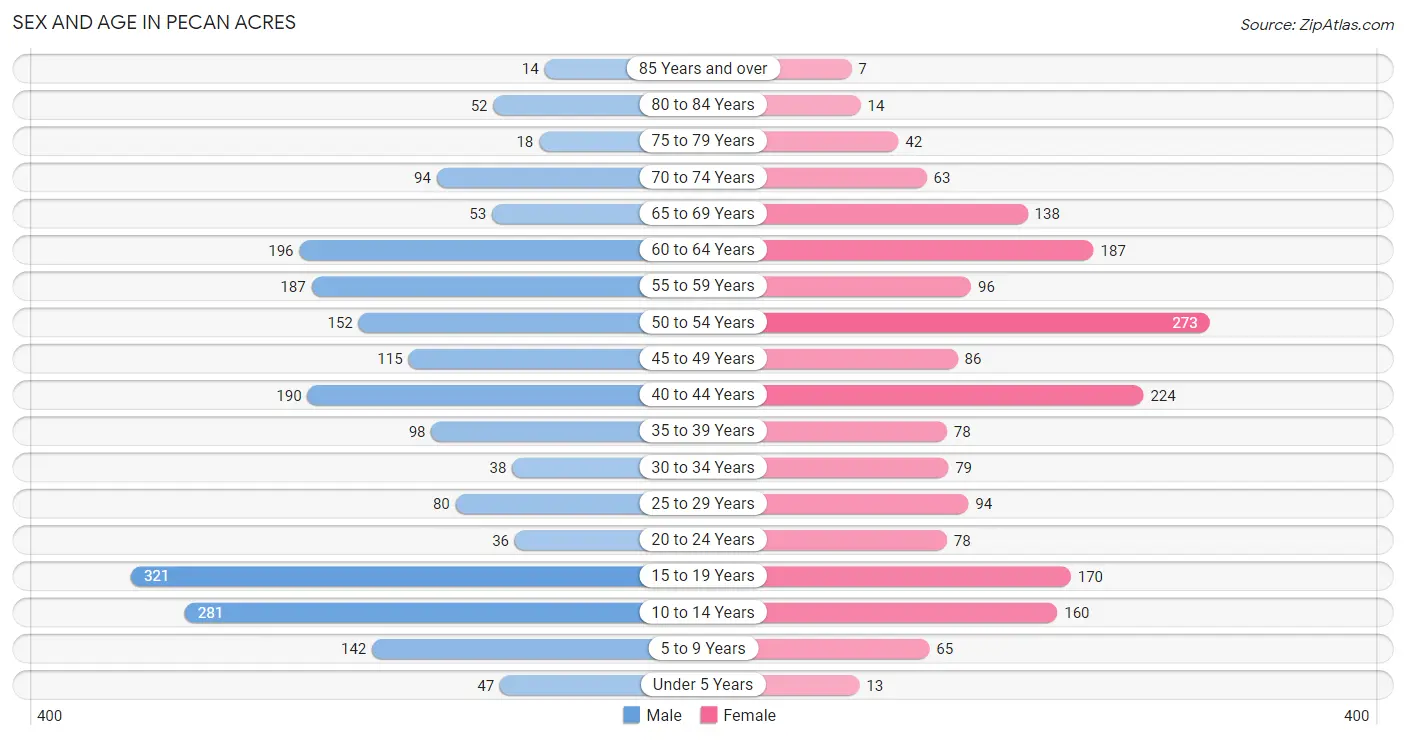
| Age Bracket | Male | Female |
| Under 5 Years | 47 (2.2%) | 13 (0.7%) |
| 5 to 9 Years | 142 (6.7%) | 65 (3.5%) |
| 10 to 14 Years | 281 (13.3%) | 160 (8.6%) |
| 15 to 19 Years | 321 (15.2%) | 170 (9.1%) |
| 20 to 24 Years | 36 (1.7%) | 78 (4.2%) |
| 25 to 29 Years | 80 (3.8%) | 94 (5.0%) |
| 30 to 34 Years | 38 (1.8%) | 79 (4.2%) |
| 35 to 39 Years | 98 (4.6%) | 78 (4.2%) |
| 40 to 44 Years | 190 (9.0%) | 224 (12.0%) |
| 45 to 49 Years | 115 (5.4%) | 86 (4.6%) |
| 50 to 54 Years | 152 (7.2%) | 273 (14.6%) |
| 55 to 59 Years | 187 (8.8%) | 96 (5.1%) |
| 60 to 64 Years | 196 (9.3%) | 187 (10.0%) |
| 65 to 69 Years | 53 (2.5%) | 138 (7.4%) |
| 70 to 74 Years | 94 (4.4%) | 63 (3.4%) |
| 75 to 79 Years | 18 (0.9%) | 42 (2.2%) |
| 80 to 84 Years | 52 (2.5%) | 14 (0.7%) |
| 85 Years and over | 14 (0.7%) | 7 (0.4%) |
| Total | 2,114 (100.0%) | 1,867 (100.0%) |
Families and Households in Pecan Acres
Median Family Size in Pecan Acres
The median family size in Pecan Acres is 3.10 persons per family, with married-couple families (976 | 82.9%) accounting for the largest median family size of 3.15 persons per family. On the other hand, single male/father families (43 | 3.6%) represent the smallest median family size with 2.07 persons per family.
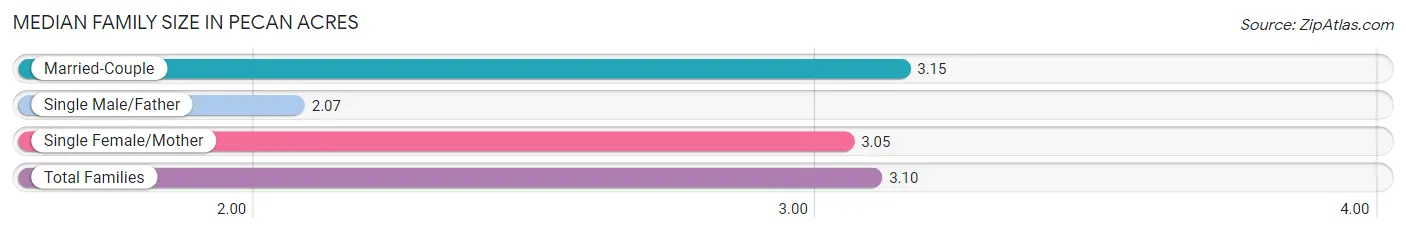
| Family Type | # Families | Family Size |
| Married-Couple | 976 (82.9%) | 3.15 |
| Single Male/Father | 43 (3.6%) | 2.07 |
| Single Female/Mother | 158 (13.4%) | 3.05 |
| Total Families | 1,177 (100.0%) | 3.10 |
Median Household Size in Pecan Acres
The median household size in Pecan Acres is 2.87 persons per household, with single female/mother households (158 | 11.4%) accounting for the largest median household size of 3.42 persons per household. non-family households (211 | 15.2%) represent the smallest median household size with 1.18 persons per household.
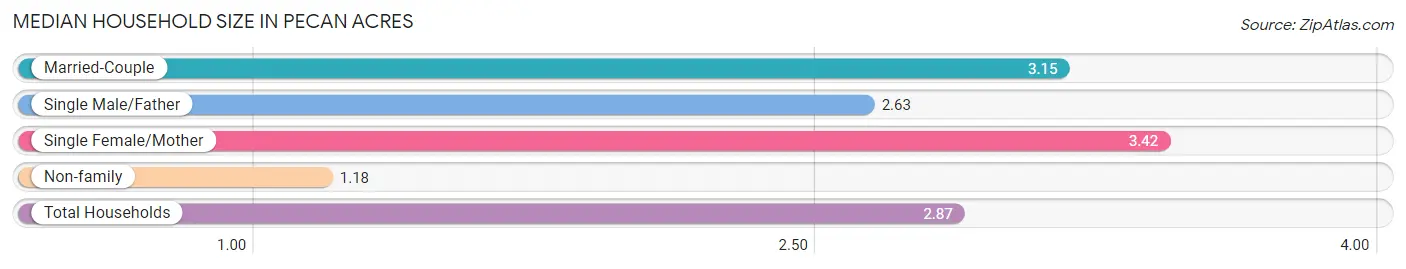
| Household Type | # Households | Household Size |
| Married-Couple | 976 (70.3%) | 3.15 |
| Single Male/Father | 43 (3.1%) | 2.63 |
| Single Female/Mother | 158 (11.4%) | 3.42 |
| Non-family | 211 (15.2%) | 1.18 |
| Total Households | 1,388 (100.0%) | 2.87 |
Household Size by Marriage Status in Pecan Acres
Out of a total of 1,388 households in Pecan Acres, 1,177 (84.8%) are family households, while 211 (15.2%) are nonfamily households. The most numerous type of family households are 2-person households, comprising 532, and the most common type of nonfamily households are 1-person households, comprising 180.
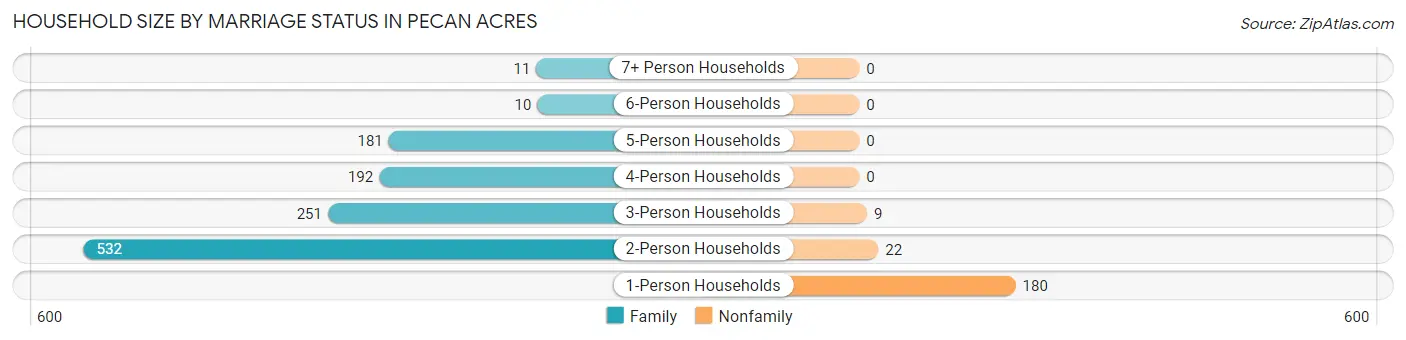
| Household Size | Family Households | Nonfamily Households |
| 1-Person Households | - | 180 (13.0%) |
| 2-Person Households | 532 (38.3%) | 22 (1.6%) |
| 3-Person Households | 251 (18.1%) | 9 (0.6%) |
| 4-Person Households | 192 (13.8%) | 0 (0.0%) |
| 5-Person Households | 181 (13.0%) | 0 (0.0%) |
| 6-Person Households | 10 (0.7%) | 0 (0.0%) |
| 7+ Person Households | 11 (0.8%) | 0 (0.0%) |
| Total | 1,177 (84.8%) | 211 (15.2%) |
Female Fertility in Pecan Acres
Fertility by Age in Pecan Acres
Average fertility rate in Pecan Acres is 29.0 births per 1,000 women. Women in the age bracket of 20 to 34 years have the highest fertility rate with 96.0 births per 1,000 women. Women in the age bracket of 20 to 34 years acount for 100.0% of all women with births.
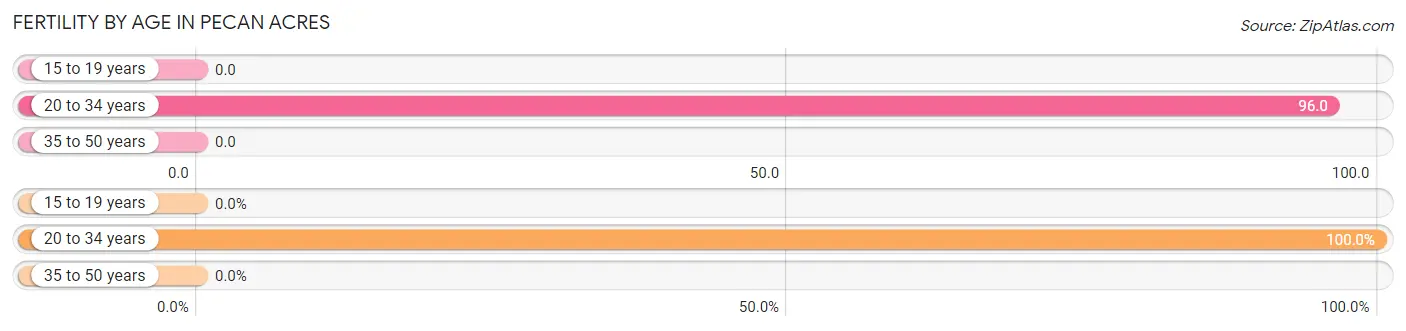
| Age Bracket | Women with Births | Births / 1,000 Women |
| 15 to 19 years | 0 (0.0%) | 0.0 |
| 20 to 34 years | 24 (100.0%) | 96.0 |
| 35 to 50 years | 0 (0.0%) | 0.0 |
| Total | 24 (100.0%) | 29.0 |
Fertility by Age by Marriage Status in Pecan Acres
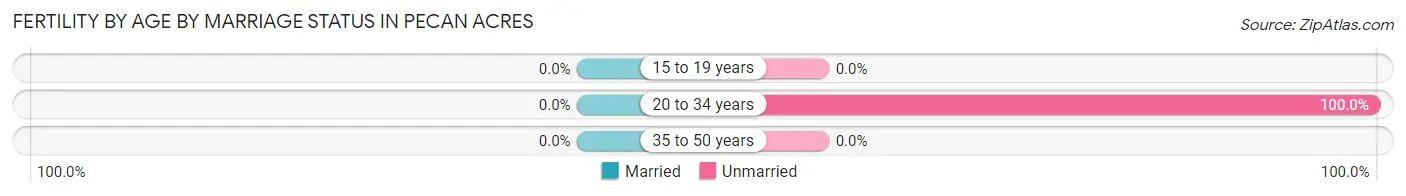
| Age Bracket | Married | Unmarried |
| 15 to 19 years | 0 (0.0%) | 0 (0.0%) |
| 20 to 34 years | 0 (0.0%) | 24 (100.0%) |
| 35 to 50 years | 0 (0.0%) | 0 (0.0%) |
| Total | 0 (0.0%) | 24 (100.0%) |
Fertility by Education in Pecan Acres
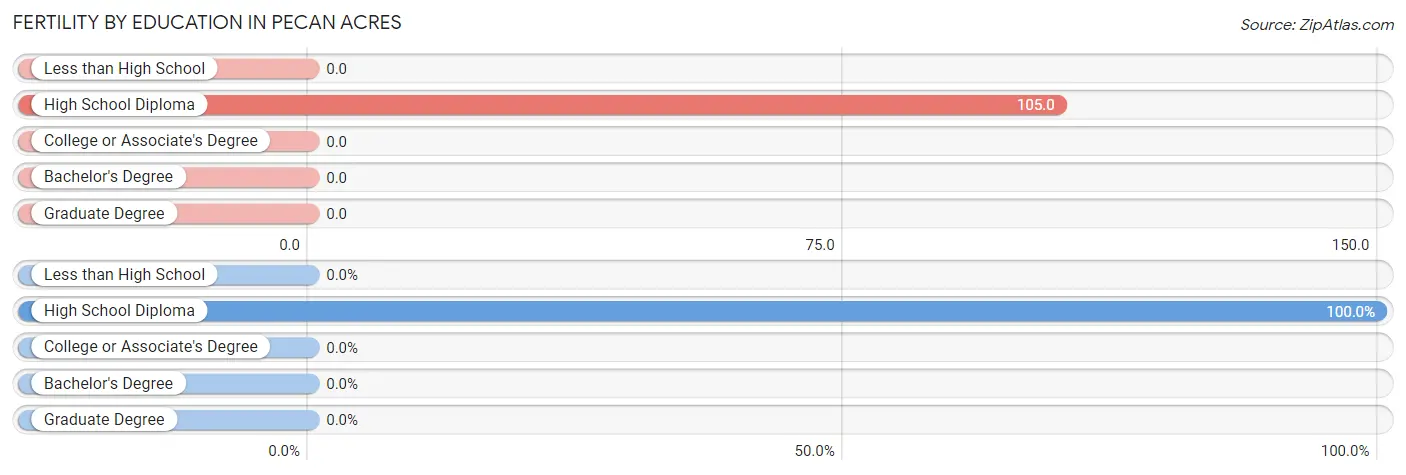
| Educational Attainment | Women with Births | Births / 1,000 Women |
| Less than High School | 0 (0.0%) | 0.0 |
| High School Diploma | 24 (100.0%) | 105.0 |
| College or Associate's Degree | 0 (0.0%) | 0.0 |
| Bachelor's Degree | 0 (0.0%) | 0.0 |
| Graduate Degree | 0 (0.0%) | 0.0 |
| Total | 24 (100.0%) | 29.0 |
Fertility by Education by Marriage Status in Pecan Acres
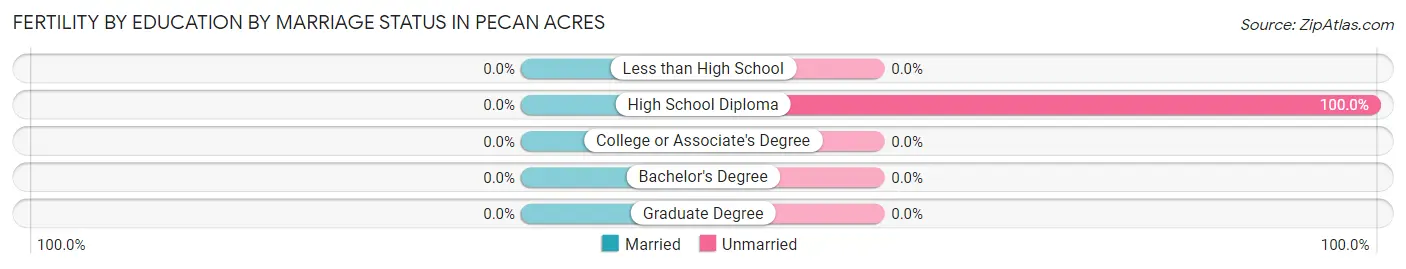
| Educational Attainment | Married | Unmarried |
| Less than High School | 0 (0.0%) | 0 (0.0%) |
| High School Diploma | 0 (0.0%) | 24 (100.0%) |
| College or Associate's Degree | 0 (0.0%) | 0 (0.0%) |
| Bachelor's Degree | 0 (0.0%) | 0 (0.0%) |
| Graduate Degree | 0 (0.0%) | 0 (0.0%) |
| Total | 0 (0.0%) | 24 (100.0%) |
Employment Characteristics in Pecan Acres
Employment by Class of Employer in Pecan Acres
Among the 1,640 employed individuals in Pecan Acres, private company employees (1,106 | 67.4%), not-for-profit organizations (185 | 11.3%), and local government employees (92 | 5.6%) make up the most common classes of employment.
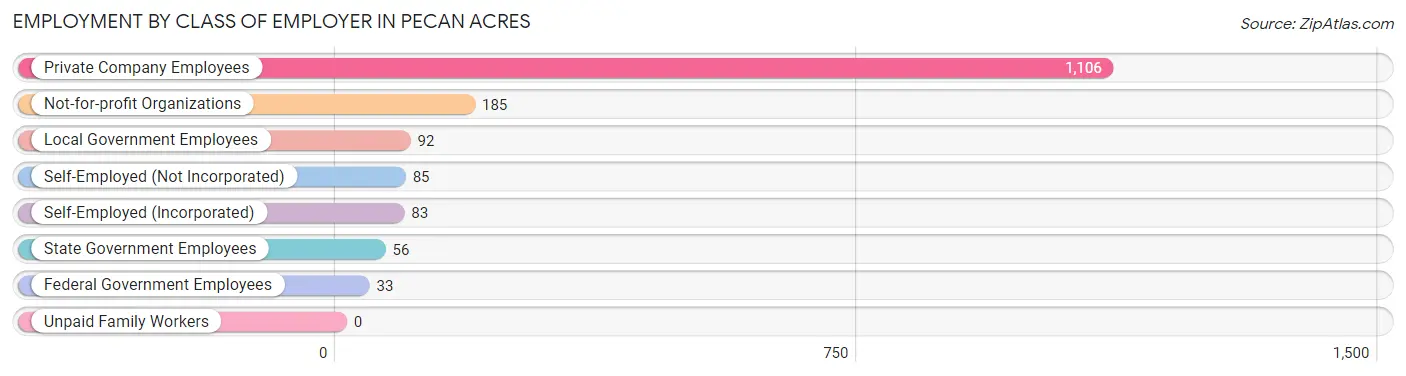
| Employer Class | # Employees | % Employees |
| Private Company Employees | 1,106 | 67.4% |
| Self-Employed (Incorporated) | 83 | 5.1% |
| Self-Employed (Not Incorporated) | 85 | 5.2% |
| Not-for-profit Organizations | 185 | 11.3% |
| Local Government Employees | 92 | 5.6% |
| State Government Employees | 56 | 3.4% |
| Federal Government Employees | 33 | 2.0% |
| Unpaid Family Workers | 0 | 0.0% |
| Total | 1,640 | 100.0% |
Employment Status by Age in Pecan Acres
According to the labor force statistics for Pecan Acres, out of the total population over 16 years of age (3,198), 59.7% or 1,909 individuals are in the labor force, with 12.4% or 237 of them unemployed. The age group with the highest labor force participation rate is 25 to 29 years, with 93.7% or 163 individuals in the labor force. Within the labor force, the 16 to 19 years age range has the highest percentage of unemployed individuals, with 100.0% or 122 of them being unemployed.
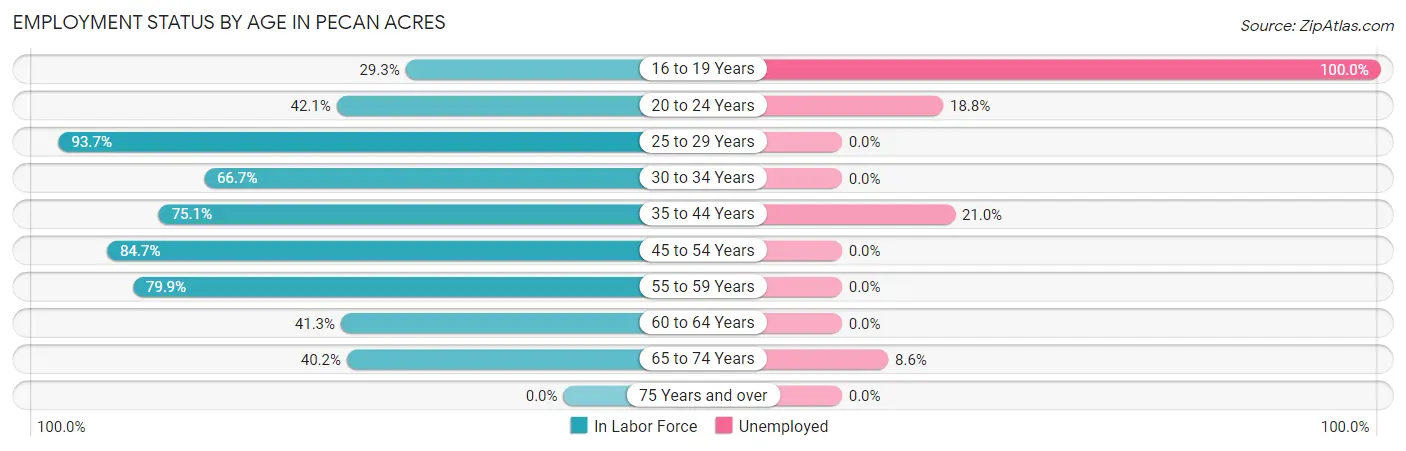
| Age Bracket | In Labor Force | Unemployed |
| 16 to 19 Years | 122 (29.3%) | 122 (100.0%) |
| 20 to 24 Years | 48 (42.1%) | 9 (18.8%) |
| 25 to 29 Years | 163 (93.7%) | 0 (0.0%) |
| 30 to 34 Years | 78 (66.7%) | 0 (0.0%) |
| 35 to 44 Years | 443 (75.1%) | 93 (21.0%) |
| 45 to 54 Years | 530 (84.7%) | 0 (0.0%) |
| 55 to 59 Years | 226 (79.9%) | 0 (0.0%) |
| 60 to 64 Years | 158 (41.3%) | 0 (0.0%) |
| 65 to 74 Years | 140 (40.2%) | 12 (8.6%) |
| 75 Years and over | 0 (0.0%) | 0 (0.0%) |
| Total | 1,909 (59.7%) | 237 (12.4%) |
Employment Status by Educational Attainment in Pecan Acres
According to labor force statistics for Pecan Acres, 73.5% of individuals (1,597) out of the total population between 25 and 64 years of age (2,173) are in the labor force, with 5.8% or 93 of them being unemployed. The group with the highest labor force participation rate are those with the educational attainment of high school diploma, with 84.1% or 445 individuals in the labor force. Within the labor force, individuals with less than high school education have the highest percentage of unemployment, with 44.8% or 26 of them being unemployed.
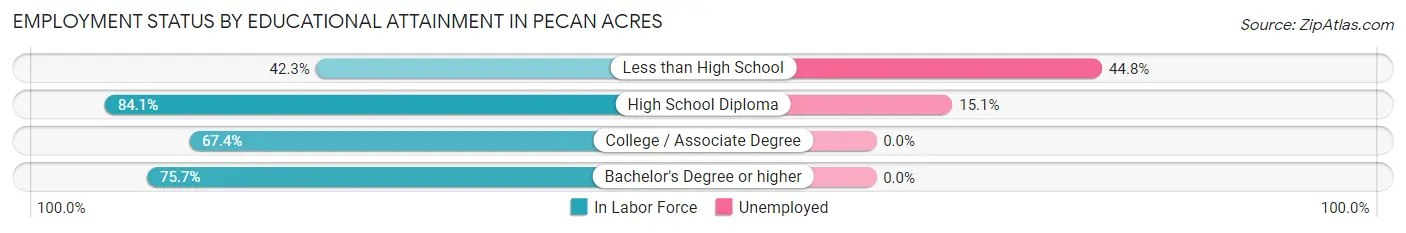
| Educational Attainment | In Labor Force | Unemployed |
| Less than High School | 58 (42.3%) | 61 (44.8%) |
| High School Diploma | 445 (84.1%) | 80 (15.1%) |
| College / Associate Degree | 372 (67.4%) | 0 (0.0%) |
| Bachelor's Degree or higher | 723 (75.7%) | 0 (0.0%) |
| Total | 1,597 (73.5%) | 126 (5.8%) |
Employment Occupations by Sex in Pecan Acres
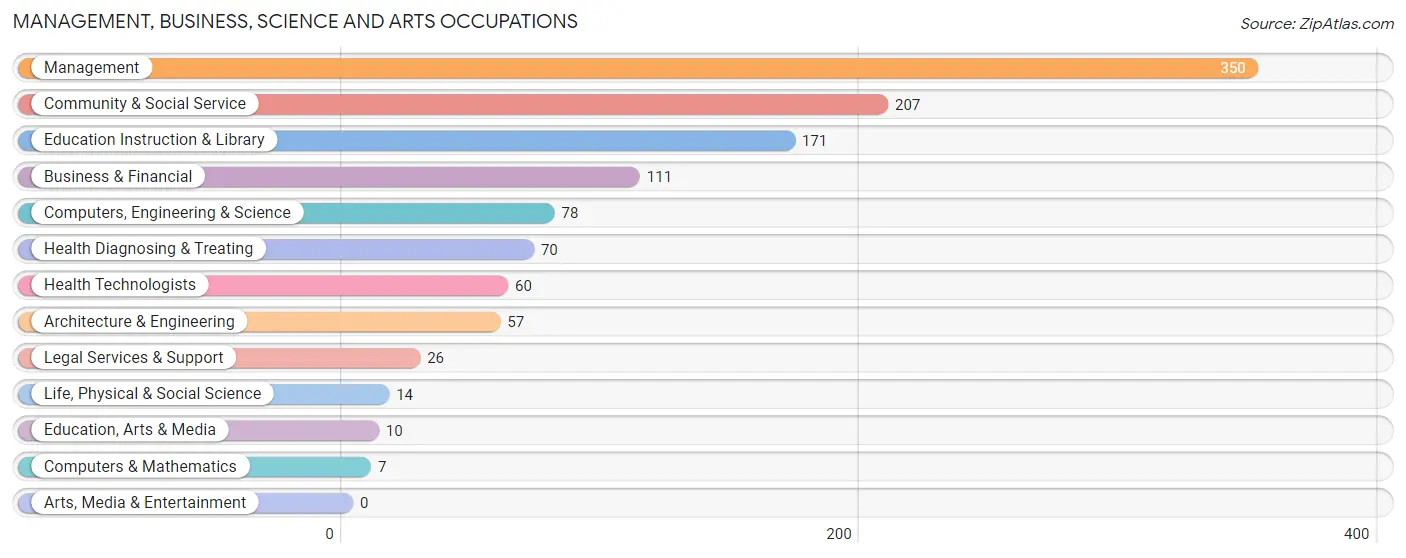
Management, Business, Science and Arts Occupations
The most common Management, Business, Science and Arts occupations in Pecan Acres are Management (350 | 20.9%), Community & Social Service (207 | 12.4%), Education Instruction & Library (171 | 10.2%), Business & Financial (111 | 6.6%), and Computers, Engineering & Science (78 | 4.7%).
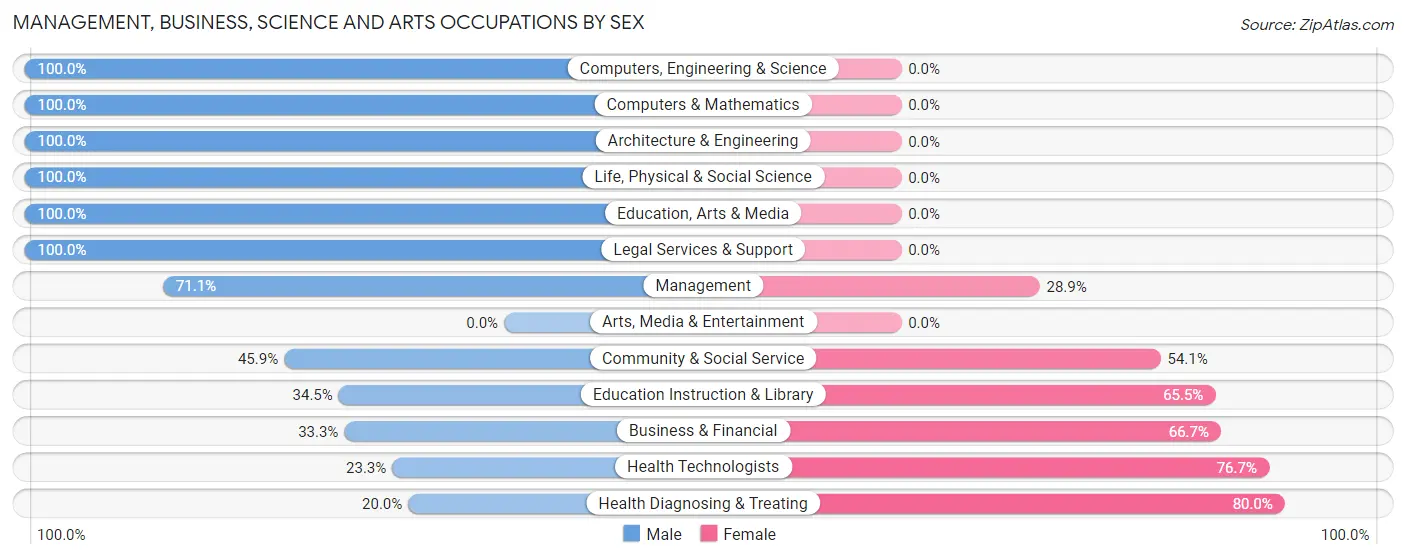
Management, Business, Science and Arts Occupations by Sex
Within the Management, Business, Science and Arts occupations in Pecan Acres, the most male-oriented occupations are Computers, Engineering & Science (100.0%), Computers & Mathematics (100.0%), and Architecture & Engineering (100.0%), while the most female-oriented occupations are Health Diagnosing & Treating (80.0%), Health Technologists (76.7%), and Business & Financial (66.7%).
| Occupation | Male | Female |
| Management | 249 (71.1%) | 101 (28.9%) |
| Business & Financial | 37 (33.3%) | 74 (66.7%) |
| Computers, Engineering & Science | 78 (100.0%) | 0 (0.0%) |
| Computers & Mathematics | 7 (100.0%) | 0 (0.0%) |
| Architecture & Engineering | 57 (100.0%) | 0 (0.0%) |
| Life, Physical & Social Science | 14 (100.0%) | 0 (0.0%) |
| Community & Social Service | 95 (45.9%) | 112 (54.1%) |
| Education, Arts & Media | 10 (100.0%) | 0 (0.0%) |
| Legal Services & Support | 26 (100.0%) | 0 (0.0%) |
| Education Instruction & Library | 59 (34.5%) | 112 (65.5%) |
| Arts, Media & Entertainment | 0 (0.0%) | 0 (0.0%) |
| Health Diagnosing & Treating | 14 (20.0%) | 56 (80.0%) |
| Health Technologists | 14 (23.3%) | 46 (76.7%) |
| Total (Category) | 473 (58.0%) | 343 (42.0%) |
| Total (Overall) | 927 (55.4%) | 745 (44.6%) |
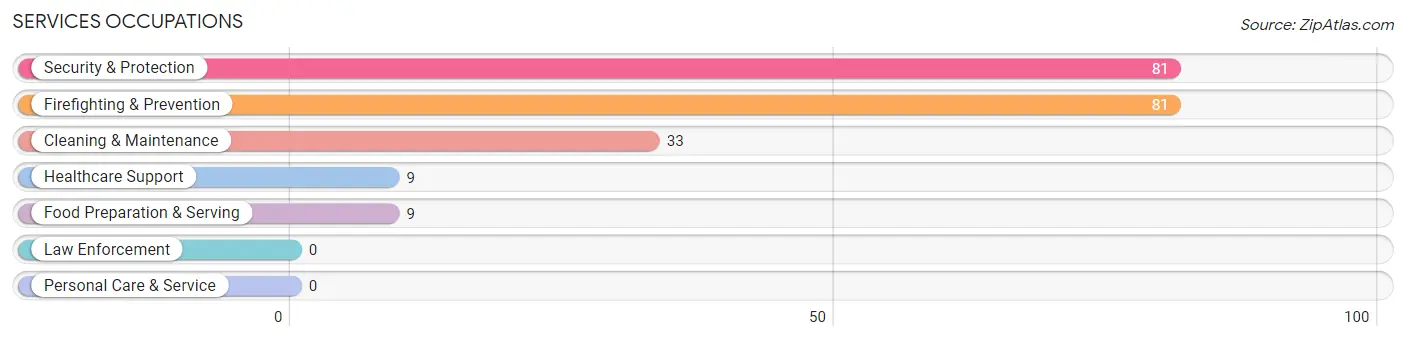
Services Occupations
The most common Services occupations in Pecan Acres are Security & Protection (81 | 4.8%), Firefighting & Prevention (81 | 4.8%), Cleaning & Maintenance (33 | 2.0%), Healthcare Support (9 | 0.5%), and Food Preparation & Serving (9 | 0.5%).
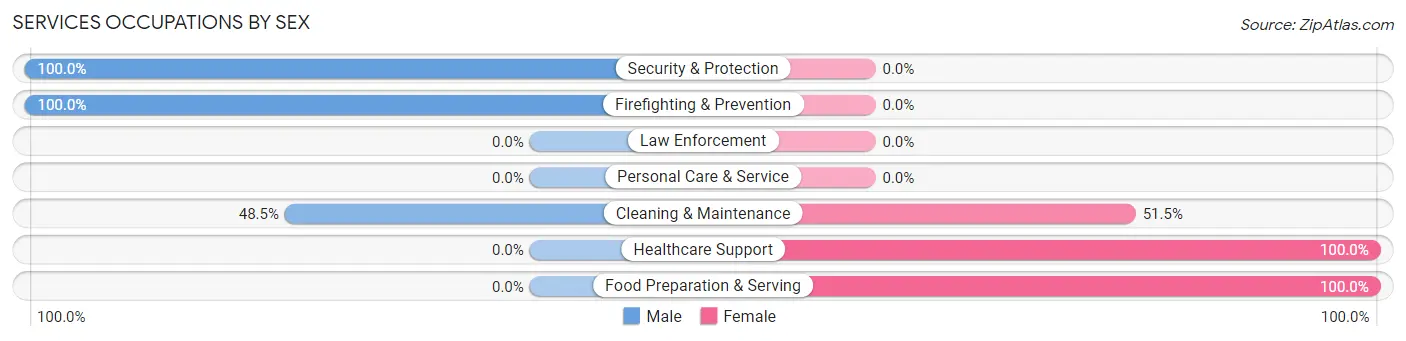
Services Occupations by Sex
Within the Services occupations in Pecan Acres, the most male-oriented occupations are Security & Protection (100.0%), Firefighting & Prevention (100.0%), and Cleaning & Maintenance (48.5%), while the most female-oriented occupations are Healthcare Support (100.0%), Food Preparation & Serving (100.0%), and Cleaning & Maintenance (51.5%).
| Occupation | Male | Female |
| Healthcare Support | 0 (0.0%) | 9 (100.0%) |
| Security & Protection | 81 (100.0%) | 0 (0.0%) |
| Firefighting & Prevention | 81 (100.0%) | 0 (0.0%) |
| Law Enforcement | 0 (0.0%) | 0 (0.0%) |
| Food Preparation & Serving | 0 (0.0%) | 9 (100.0%) |
| Cleaning & Maintenance | 16 (48.5%) | 17 (51.5%) |
| Personal Care & Service | 0 (0.0%) | 0 (0.0%) |
| Total (Category) | 97 (73.5%) | 35 (26.5%) |
| Total (Overall) | 927 (55.4%) | 745 (44.6%) |
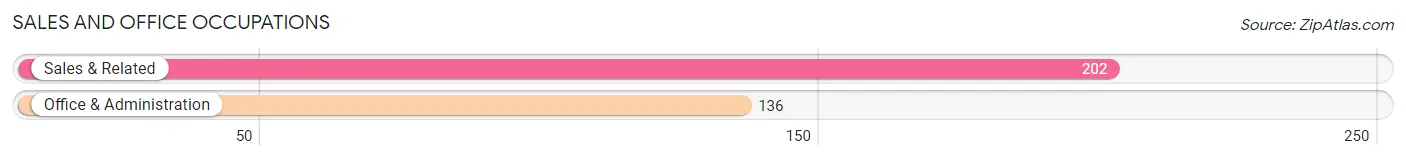
Sales and Office Occupations
The most common Sales and Office occupations in Pecan Acres are Sales & Related (202 | 12.1%), and Office & Administration (136 | 8.1%).
Sales and Office Occupations by Sex
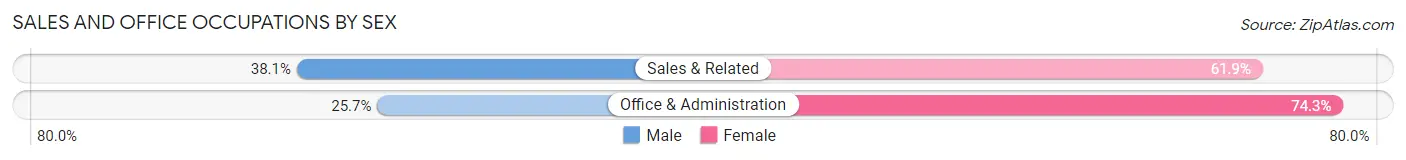
| Occupation | Male | Female |
| Sales & Related | 77 (38.1%) | 125 (61.9%) |
| Office & Administration | 35 (25.7%) | 101 (74.3%) |
| Total (Category) | 112 (33.1%) | 226 (66.9%) |
| Total (Overall) | 927 (55.4%) | 745 (44.6%) |
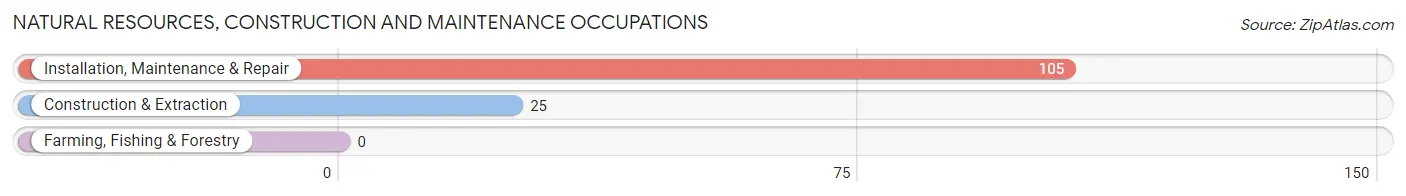
Natural Resources, Construction and Maintenance Occupations
The most common Natural Resources, Construction and Maintenance occupations in Pecan Acres are Installation, Maintenance & Repair (105 | 6.3%), and Construction & Extraction (25 | 1.5%).
Natural Resources, Construction and Maintenance Occupations by Sex
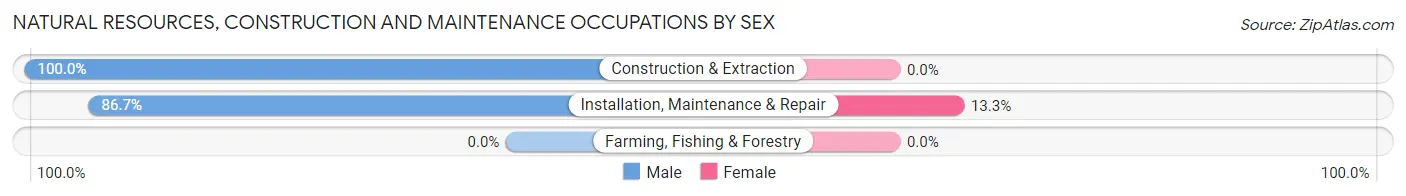
| Occupation | Male | Female |
| Farming, Fishing & Forestry | 0 (0.0%) | 0 (0.0%) |
| Construction & Extraction | 25 (100.0%) | 0 (0.0%) |
| Installation, Maintenance & Repair | 91 (86.7%) | 14 (13.3%) |
| Total (Category) | 116 (89.2%) | 14 (10.8%) |
| Total (Overall) | 927 (55.4%) | 745 (44.6%) |
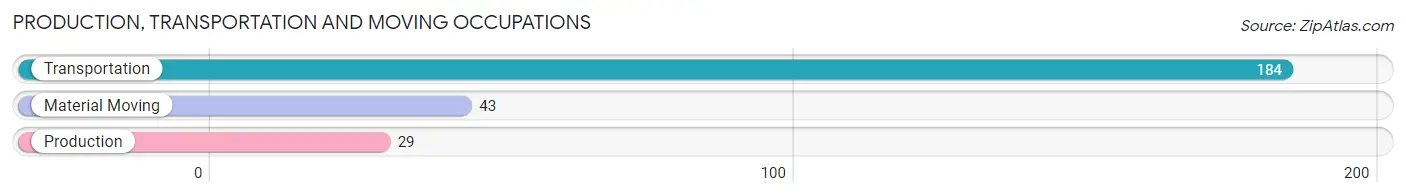
Production, Transportation and Moving Occupations
The most common Production, Transportation and Moving occupations in Pecan Acres are Transportation (184 | 11.0%), Material Moving (43 | 2.6%), and Production (29 | 1.7%).
Production, Transportation and Moving Occupations by Sex
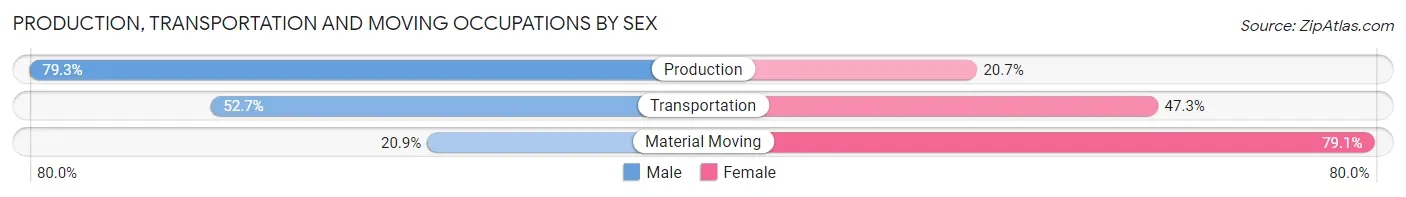
| Occupation | Male | Female |
| Production | 23 (79.3%) | 6 (20.7%) |
| Transportation | 97 (52.7%) | 87 (47.3%) |
| Material Moving | 9 (20.9%) | 34 (79.1%) |
| Total (Category) | 129 (50.4%) | 127 (49.6%) |
| Total (Overall) | 927 (55.4%) | 745 (44.6%) |
Employment Industries by Sex in Pecan Acres
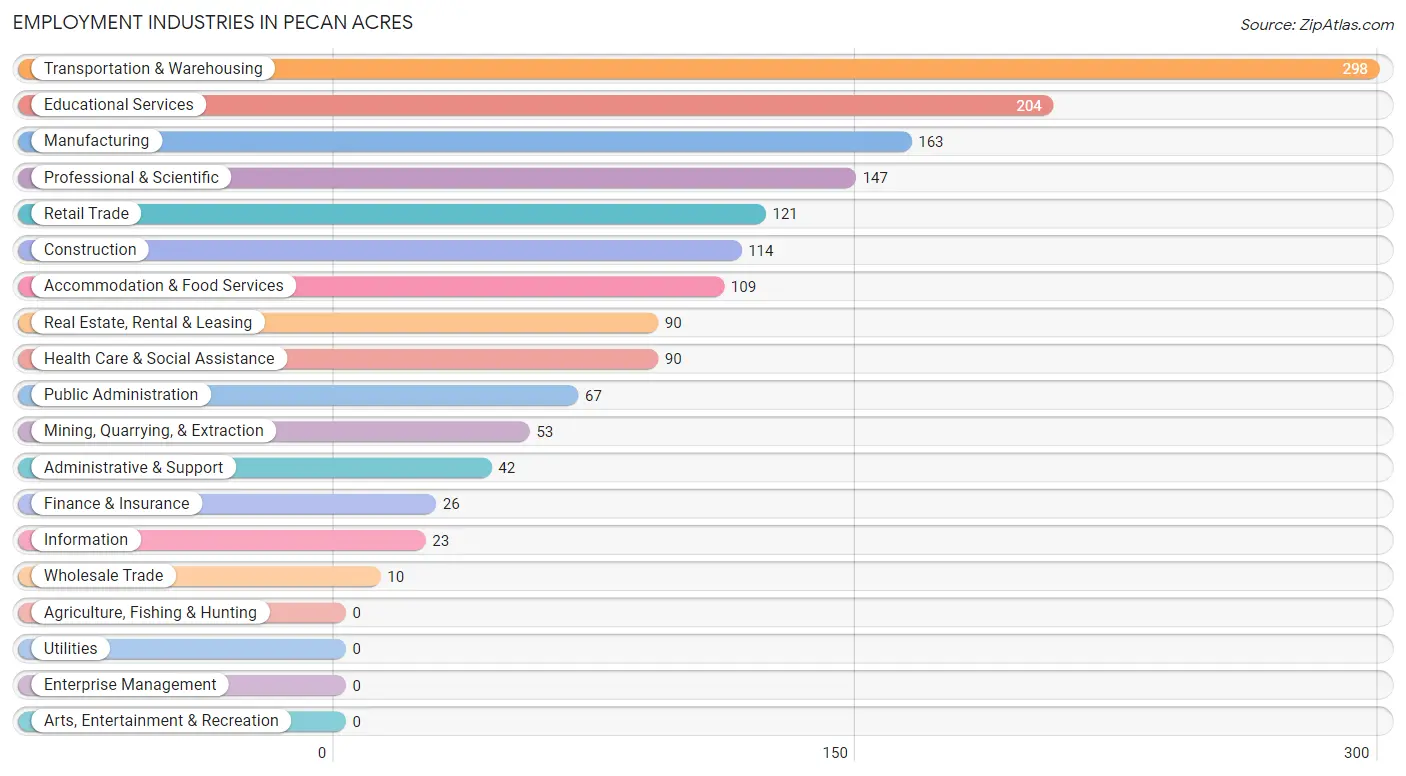
Employment Industries in Pecan Acres
The major employment industries in Pecan Acres include Transportation & Warehousing (298 | 17.8%), Educational Services (204 | 12.2%), Manufacturing (163 | 9.8%), Professional & Scientific (147 | 8.8%), and Retail Trade (121 | 7.2%).
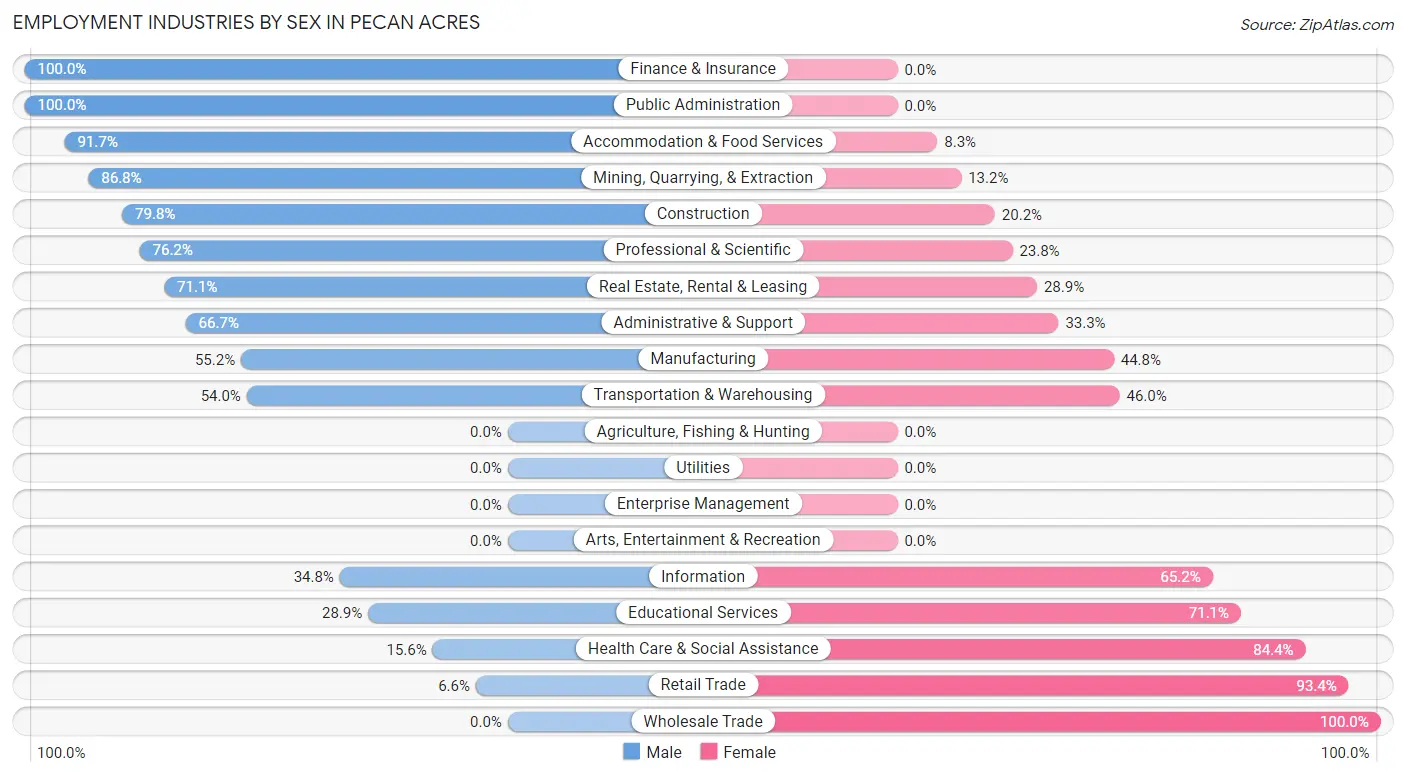
Employment Industries by Sex in Pecan Acres
The Pecan Acres industries that see more men than women are Finance & Insurance (100.0%), Public Administration (100.0%), and Accommodation & Food Services (91.7%), whereas the industries that tend to have a higher number of women are Wholesale Trade (100.0%), Retail Trade (93.4%), and Health Care & Social Assistance (84.4%).
| Industry | Male | Female |
| Agriculture, Fishing & Hunting | 0 (0.0%) | 0 (0.0%) |
| Mining, Quarrying, & Extraction | 46 (86.8%) | 7 (13.2%) |
| Construction | 91 (79.8%) | 23 (20.2%) |
| Manufacturing | 90 (55.2%) | 73 (44.8%) |
| Wholesale Trade | 0 (0.0%) | 10 (100.0%) |
| Retail Trade | 8 (6.6%) | 113 (93.4%) |
| Transportation & Warehousing | 161 (54.0%) | 137 (46.0%) |
| Utilities | 0 (0.0%) | 0 (0.0%) |
| Information | 8 (34.8%) | 15 (65.2%) |
| Finance & Insurance | 26 (100.0%) | 0 (0.0%) |
| Real Estate, Rental & Leasing | 64 (71.1%) | 26 (28.9%) |
| Professional & Scientific | 112 (76.2%) | 35 (23.8%) |
| Enterprise Management | 0 (0.0%) | 0 (0.0%) |
| Administrative & Support | 28 (66.7%) | 14 (33.3%) |
| Educational Services | 59 (28.9%) | 145 (71.1%) |
| Health Care & Social Assistance | 14 (15.6%) | 76 (84.4%) |
| Arts, Entertainment & Recreation | 0 (0.0%) | 0 (0.0%) |
| Accommodation & Food Services | 100 (91.7%) | 9 (8.3%) |
| Public Administration | 67 (100.0%) | 0 (0.0%) |
| Total | 927 (55.4%) | 745 (44.6%) |
Education in Pecan Acres
School Enrollment in Pecan Acres
The most common levels of schooling among the 1,284 students in Pecan Acres are high school (485 | 37.8%), middle school (332 | 25.9%), and elementary school (200 | 15.6%).
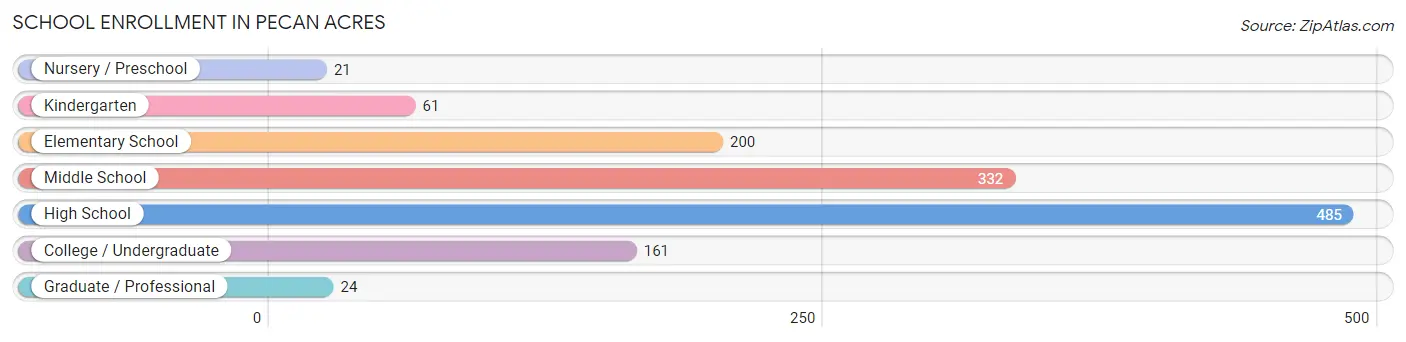
| School Level | # Students | % Students |
| Nursery / Preschool | 21 | 1.6% |
| Kindergarten | 61 | 4.8% |
| Elementary School | 200 | 15.6% |
| Middle School | 332 | 25.9% |
| High School | 485 | 37.8% |
| College / Undergraduate | 161 | 12.5% |
| Graduate / Professional | 24 | 1.9% |
| Total | 1,284 | 100.0% |
School Enrollment by Age by Funding Source in Pecan Acres
Out of a total of 1,284 students who are enrolled in schools in Pecan Acres, 173 (13.5%) attend a private institution, while the remaining 1,111 (86.5%) are enrolled in public schools. The age group of 3 to 4 year olds has the highest likelihood of being enrolled in private schools, with 21 (100.0% in the age bracket) enrolled. Conversely, the age group of 15 to 17 year olds has the lowest likelihood of being enrolled in a private school, with 310 (100.0% in the age bracket) attending a public institution.
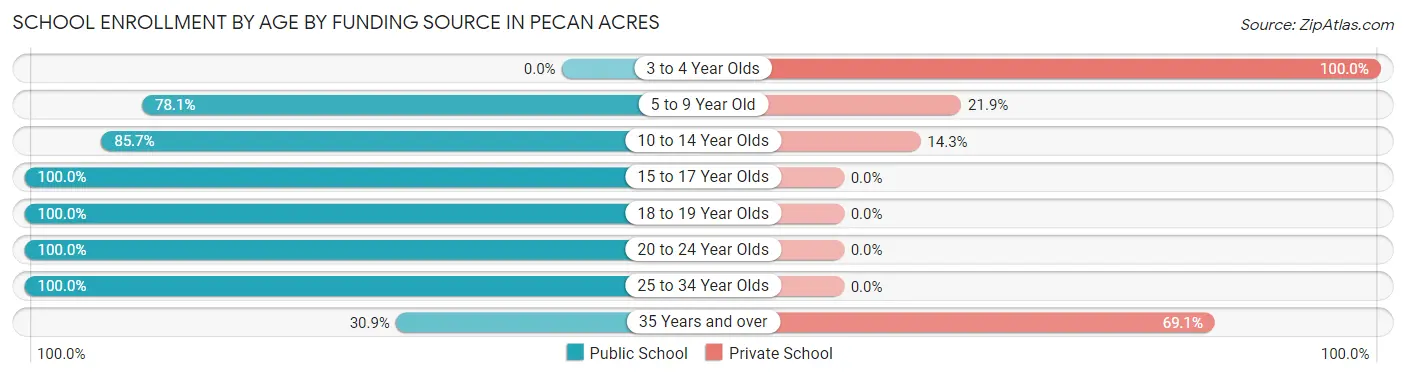
| Age Bracket | Public School | Private School |
| 3 to 4 Year Olds | 0 (0.0%) | 21 (100.0%) |
| 5 to 9 Year Old | 150 (78.1%) | 42 (21.9%) |
| 10 to 14 Year Olds | 378 (85.7%) | 63 (14.3%) |
| 15 to 17 Year Olds | 310 (100.0%) | 0 (0.0%) |
| 18 to 19 Year Olds | 181 (100.0%) | 0 (0.0%) |
| 20 to 24 Year Olds | 60 (100.0%) | 0 (0.0%) |
| 25 to 34 Year Olds | 11 (100.0%) | 0 (0.0%) |
| 35 Years and over | 21 (30.9%) | 47 (69.1%) |
| Total | 1,111 (86.5%) | 173 (13.5%) |
Educational Attainment by Field of Study in Pecan Acres
Business (454 | 34.7%), social sciences (206 | 15.8%), psychology (126 | 9.6%), engineering (106 | 8.1%), and bio, nature & agricultural (88 | 6.7%) are the most common fields of study among 1,308 individuals in Pecan Acres who have obtained a bachelor's degree or higher.
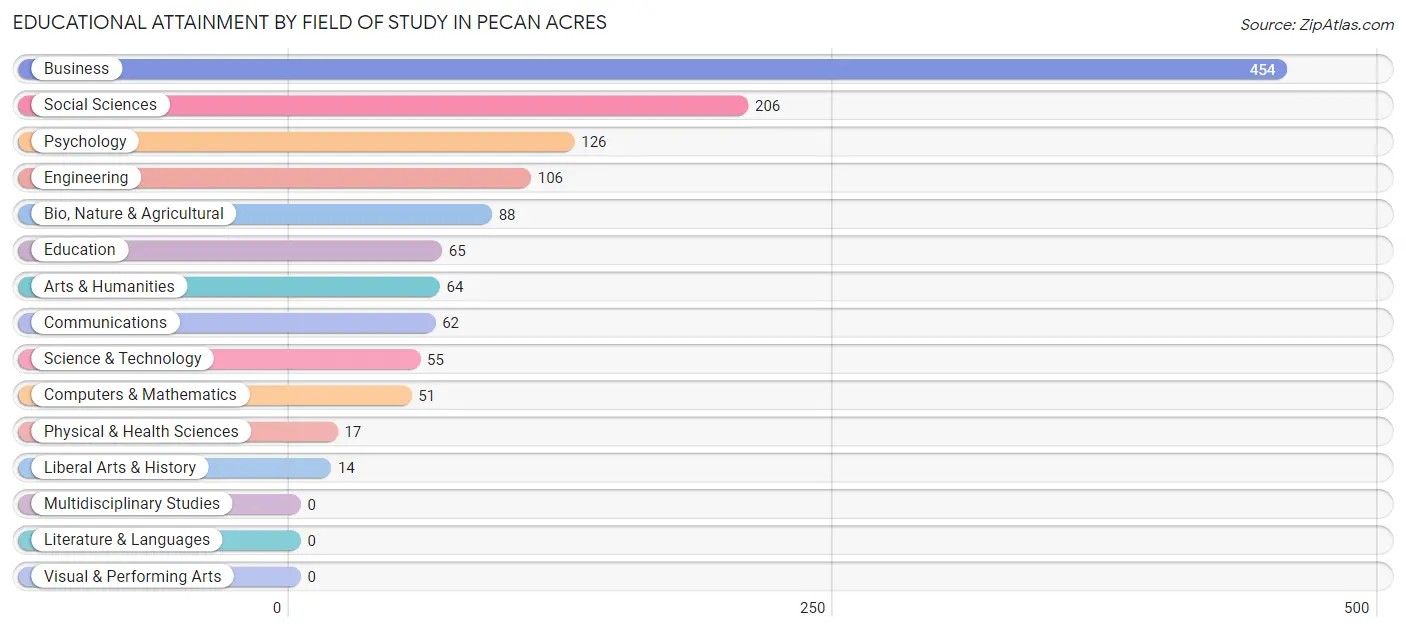
| Field of Study | # Graduates | % Graduates |
| Computers & Mathematics | 51 | 3.9% |
| Bio, Nature & Agricultural | 88 | 6.7% |
| Physical & Health Sciences | 17 | 1.3% |
| Psychology | 126 | 9.6% |
| Social Sciences | 206 | 15.8% |
| Engineering | 106 | 8.1% |
| Multidisciplinary Studies | 0 | 0.0% |
| Science & Technology | 55 | 4.2% |
| Business | 454 | 34.7% |
| Education | 65 | 5.0% |
| Literature & Languages | 0 | 0.0% |
| Liberal Arts & History | 14 | 1.1% |
| Visual & Performing Arts | 0 | 0.0% |
| Communications | 62 | 4.7% |
| Arts & Humanities | 64 | 4.9% |
| Total | 1,308 | 100.0% |
Transportation & Commute in Pecan Acres
Vehicle Availability by Sex in Pecan Acres
The most prevalent vehicle ownership categories in Pecan Acres are males with 3 vehicles (479, accounting for 52.1%) and females with 3 vehicles (376, making up 66.4%).
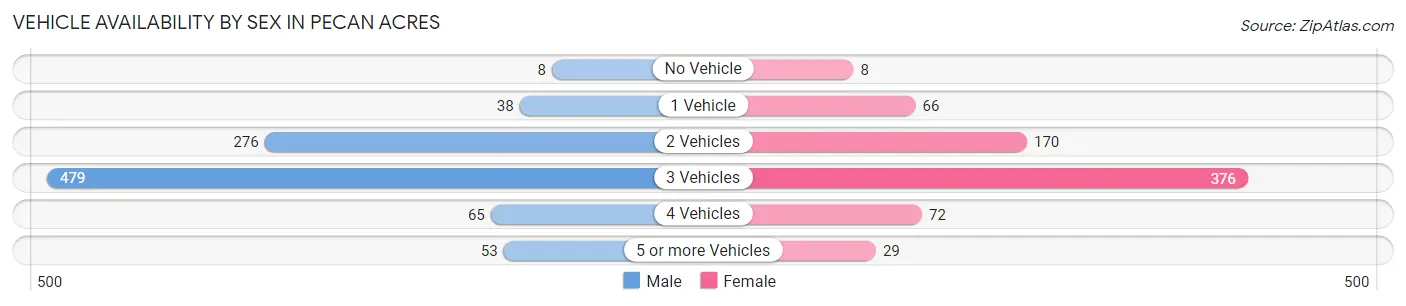
| Vehicles Available | Male | Female |
| No Vehicle | 8 (0.9%) | 8 (1.1%) |
| 1 Vehicle | 38 (4.1%) | 66 (9.1%) |
| 2 Vehicles | 276 (30.0%) | 170 (23.6%) |
| 3 Vehicles | 479 (52.1%) | 376 (52.1%) |
| 4 Vehicles | 65 (7.1%) | 72 (10.0%) |
| 5 or more Vehicles | 53 (5.8%) | 29 (4.0%) |
| Total | 919 (100.0%) | 721 (100.0%) |
Commute Time in Pecan Acres
The most frequently occuring commute durations in Pecan Acres are 30 to 34 minutes (385 commuters, 28.7%), 45 to 59 minutes (203 commuters, 15.1%), and 35 to 39 minutes (185 commuters, 13.8%).
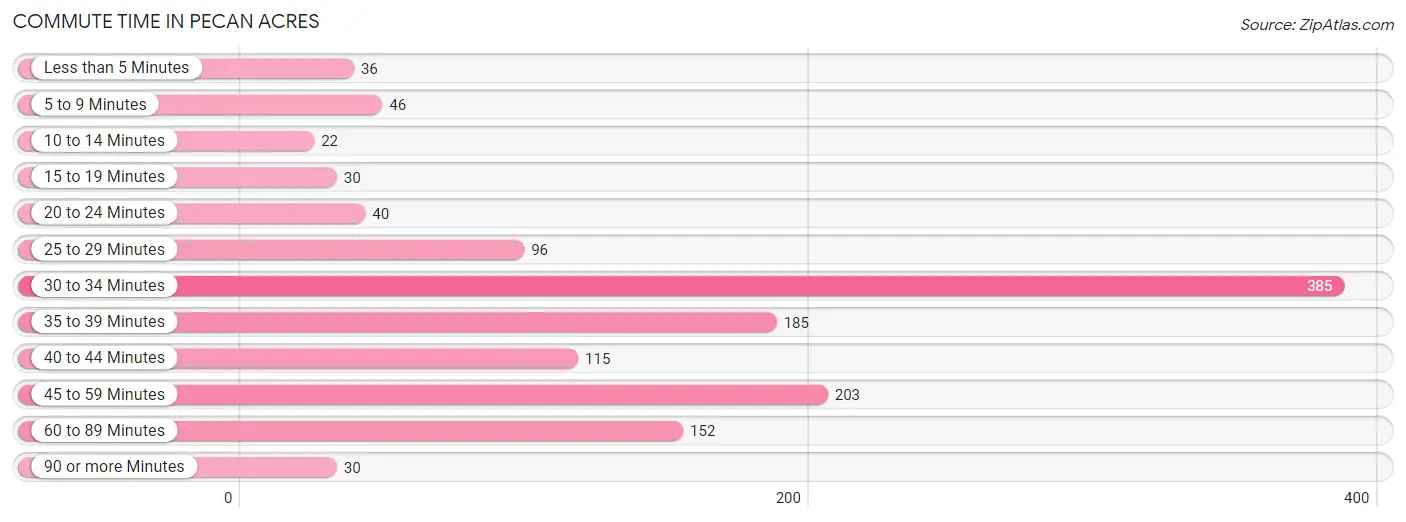
| Commute Time | # Commuters | % Commuters |
| Less than 5 Minutes | 36 | 2.7% |
| 5 to 9 Minutes | 46 | 3.4% |
| 10 to 14 Minutes | 22 | 1.6% |
| 15 to 19 Minutes | 30 | 2.2% |
| 20 to 24 Minutes | 40 | 3.0% |
| 25 to 29 Minutes | 96 | 7.2% |
| 30 to 34 Minutes | 385 | 28.7% |
| 35 to 39 Minutes | 185 | 13.8% |
| 40 to 44 Minutes | 115 | 8.6% |
| 45 to 59 Minutes | 203 | 15.1% |
| 60 to 89 Minutes | 152 | 11.3% |
| 90 or more Minutes | 30 | 2.2% |
Commute Time by Sex in Pecan Acres
The most common commute times in Pecan Acres are 30 to 34 minutes (207 commuters, 28.0%) for males and 30 to 34 minutes (178 commuters, 29.6%) for females.
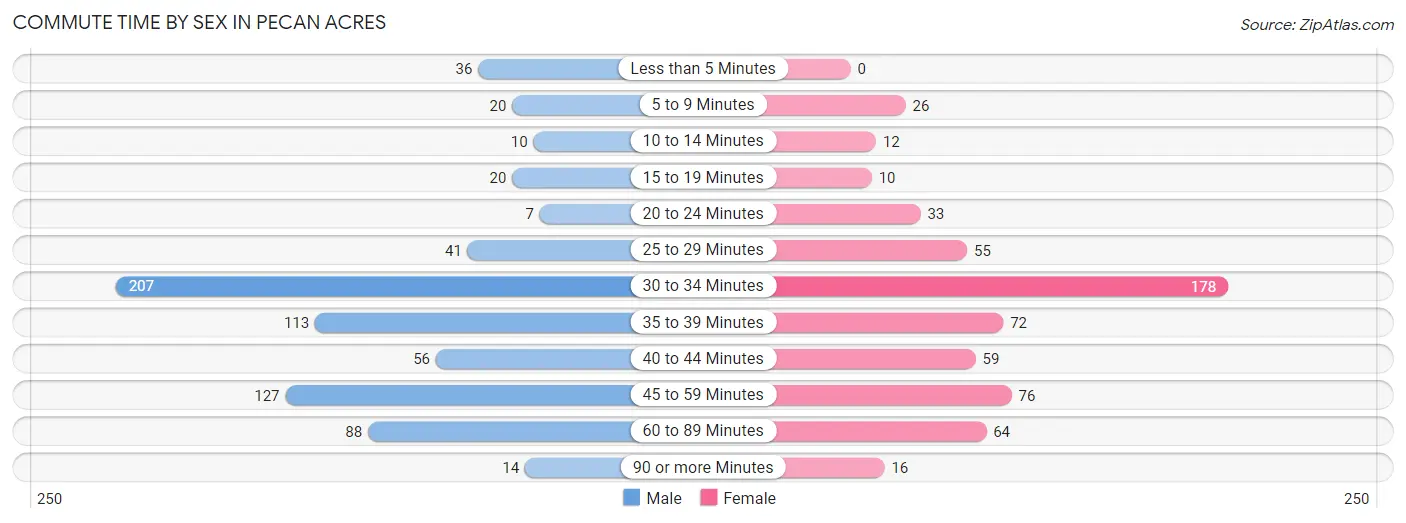
| Commute Time | Male | Female |
| Less than 5 Minutes | 36 (4.9%) | 0 (0.0%) |
| 5 to 9 Minutes | 20 (2.7%) | 26 (4.3%) |
| 10 to 14 Minutes | 10 (1.3%) | 12 (2.0%) |
| 15 to 19 Minutes | 20 (2.7%) | 10 (1.7%) |
| 20 to 24 Minutes | 7 (0.9%) | 33 (5.5%) |
| 25 to 29 Minutes | 41 (5.6%) | 55 (9.1%) |
| 30 to 34 Minutes | 207 (28.0%) | 178 (29.6%) |
| 35 to 39 Minutes | 113 (15.3%) | 72 (12.0%) |
| 40 to 44 Minutes | 56 (7.6%) | 59 (9.8%) |
| 45 to 59 Minutes | 127 (17.2%) | 76 (12.7%) |
| 60 to 89 Minutes | 88 (11.9%) | 64 (10.6%) |
| 90 or more Minutes | 14 (1.9%) | 16 (2.7%) |
Time of Departure to Work by Sex in Pecan Acres
The most frequent times of departure to work in Pecan Acres are 7:30 AM to 7:59 AM (162, 21.9%) for males and 6:00 AM to 6:29 AM (153, 25.5%) for females.
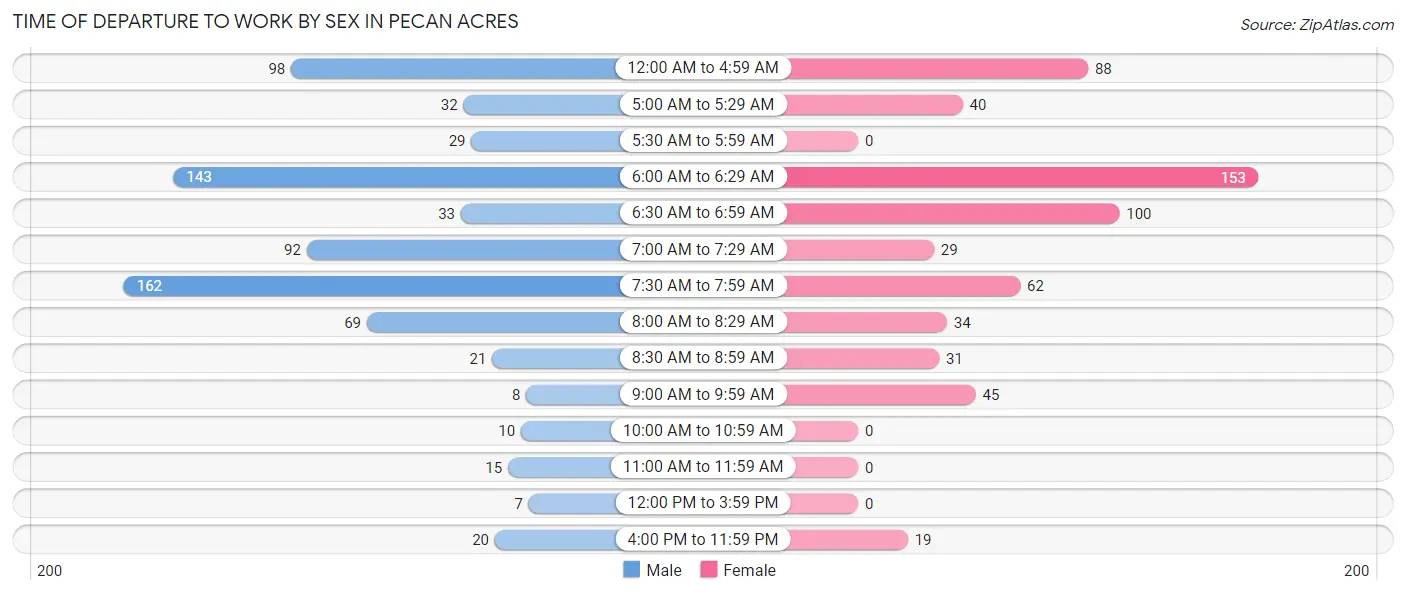
| Time of Departure | Male | Female |
| 12:00 AM to 4:59 AM | 98 (13.3%) | 88 (14.6%) |
| 5:00 AM to 5:29 AM | 32 (4.3%) | 40 (6.7%) |
| 5:30 AM to 5:59 AM | 29 (3.9%) | 0 (0.0%) |
| 6:00 AM to 6:29 AM | 143 (19.4%) | 153 (25.5%) |
| 6:30 AM to 6:59 AM | 33 (4.5%) | 100 (16.6%) |
| 7:00 AM to 7:29 AM | 92 (12.4%) | 29 (4.8%) |
| 7:30 AM to 7:59 AM | 162 (21.9%) | 62 (10.3%) |
| 8:00 AM to 8:29 AM | 69 (9.3%) | 34 (5.7%) |
| 8:30 AM to 8:59 AM | 21 (2.8%) | 31 (5.2%) |
| 9:00 AM to 9:59 AM | 8 (1.1%) | 45 (7.5%) |
| 10:00 AM to 10:59 AM | 10 (1.3%) | 0 (0.0%) |
| 11:00 AM to 11:59 AM | 15 (2.0%) | 0 (0.0%) |
| 12:00 PM to 3:59 PM | 7 (0.9%) | 0 (0.0%) |
| 4:00 PM to 11:59 PM | 20 (2.7%) | 19 (3.2%) |
| Total | 739 (100.0%) | 601 (100.0%) |
Housing Occupancy in Pecan Acres
Occupancy by Ownership in Pecan Acres
Of the total 1,388 dwellings in Pecan Acres, owner-occupied units account for 1,263 (91.0%), while renter-occupied units make up 125 (9.0%).
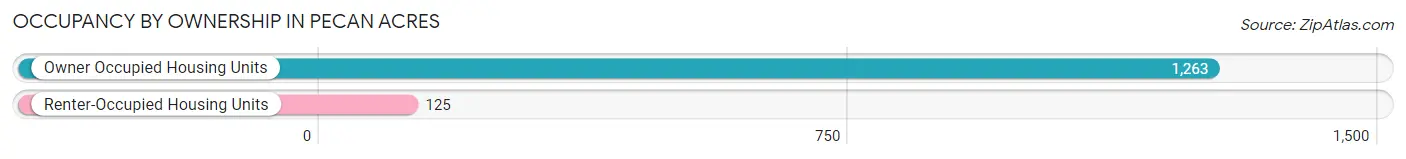
| Occupancy | # Housing Units | % Housing Units |
| Owner Occupied Housing Units | 1,263 | 91.0% |
| Renter-Occupied Housing Units | 125 | 9.0% |
| Total Occupied Housing Units | 1,388 | 100.0% |
Occupancy by Household Size in Pecan Acres
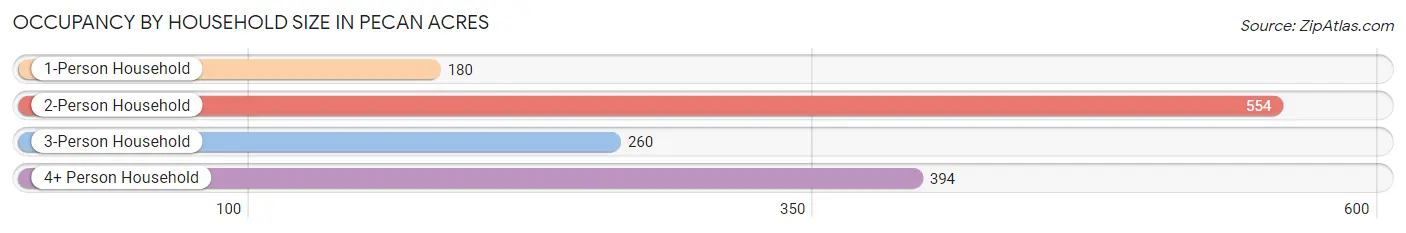
| Household Size | # Housing Units | % Housing Units |
| 1-Person Household | 180 | 13.0% |
| 2-Person Household | 554 | 39.9% |
| 3-Person Household | 260 | 18.7% |
| 4+ Person Household | 394 | 28.4% |
| Total Housing Units | 1,388 | 100.0% |
Occupancy by Ownership by Household Size in Pecan Acres
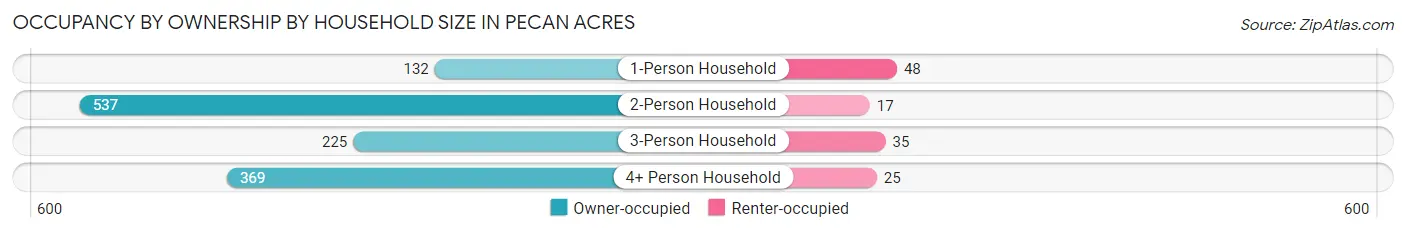
| Household Size | Owner-occupied | Renter-occupied |
| 1-Person Household | 132 (73.3%) | 48 (26.7%) |
| 2-Person Household | 537 (96.9%) | 17 (3.1%) |
| 3-Person Household | 225 (86.5%) | 35 (13.5%) |
| 4+ Person Household | 369 (93.6%) | 25 (6.4%) |
| Total Housing Units | 1,263 (91.0%) | 125 (9.0%) |
Occupancy by Educational Attainment in Pecan Acres
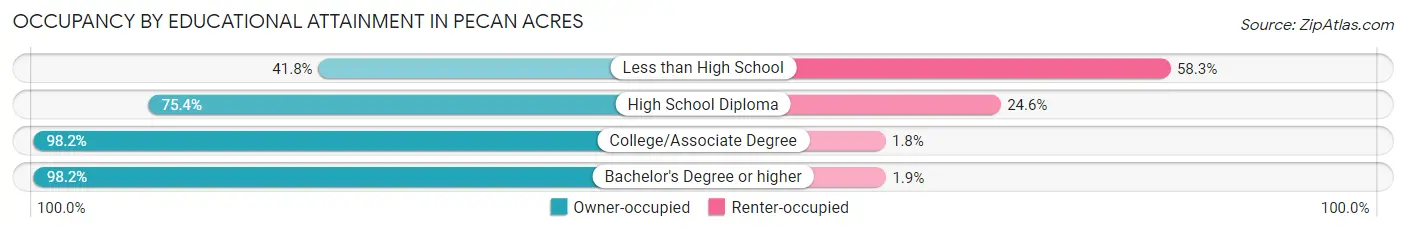
| Household Size | Owner-occupied | Renter-occupied |
| Less than High School | 43 (41.7%) | 60 (58.3%) |
| High School Diploma | 138 (75.4%) | 45 (24.6%) |
| College/Associate Degree | 446 (98.2%) | 8 (1.8%) |
| Bachelor's Degree or higher | 636 (98.2%) | 12 (1.8%) |
Occupancy by Age of Householder in Pecan Acres
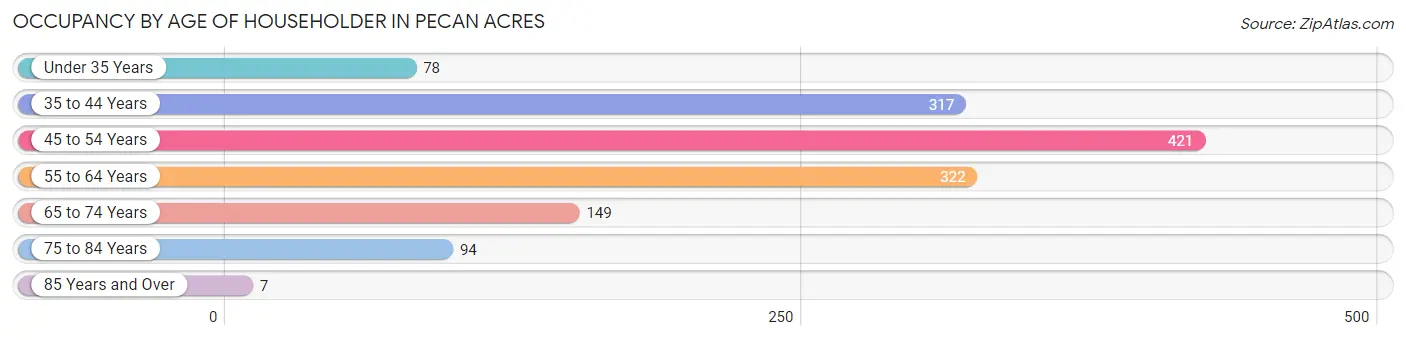
| Age Bracket | # Households | % Households |
| Under 35 Years | 78 | 5.6% |
| 35 to 44 Years | 317 | 22.8% |
| 45 to 54 Years | 421 | 30.3% |
| 55 to 64 Years | 322 | 23.2% |
| 65 to 74 Years | 149 | 10.7% |
| 75 to 84 Years | 94 | 6.8% |
| 85 Years and Over | 7 | 0.5% |
| Total | 1,388 | 100.0% |
Housing Finances in Pecan Acres
Median Income by Occupancy in Pecan Acres

| Occupancy Type | # Households | Median Income |
| Owner-Occupied | 1,263 (91.0%) | $129,183 |
| Renter-Occupied | 125 (9.0%) | $23,407 |
| Average | 1,388 (100.0%) | $119,231 |
Occupancy by Householder Income Bracket in Pecan Acres
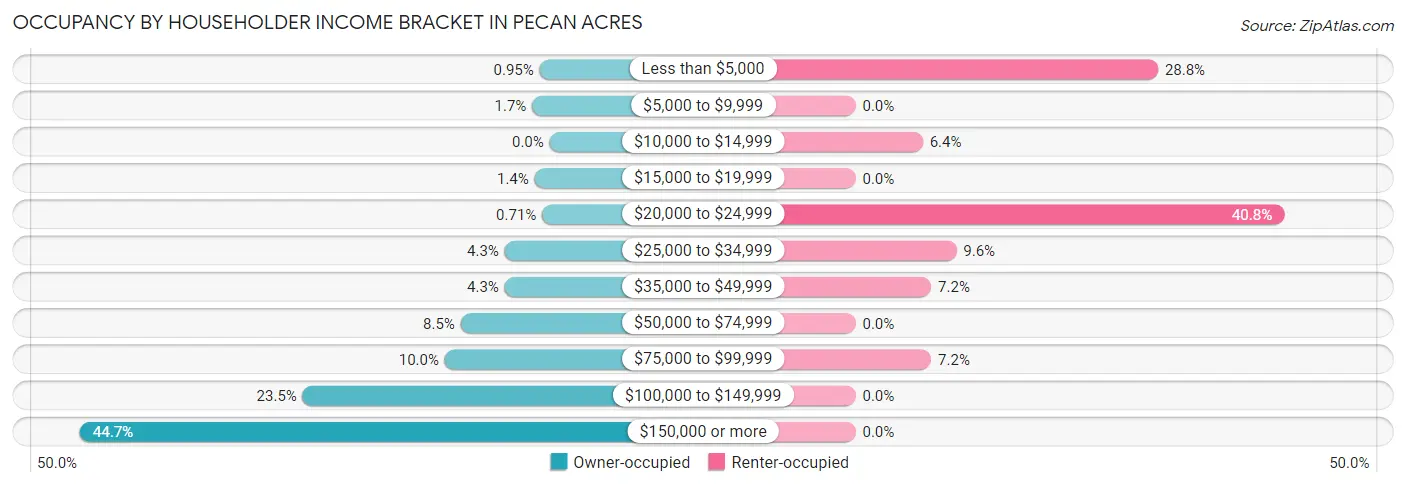
| Income Bracket | Owner-occupied | Renter-occupied |
| Less than $5,000 | 12 (0.9%) | 36 (28.8%) |
| $5,000 to $9,999 | 21 (1.7%) | 0 (0.0%) |
| $10,000 to $14,999 | 0 (0.0%) | 8 (6.4%) |
| $15,000 to $19,999 | 18 (1.4%) | 0 (0.0%) |
| $20,000 to $24,999 | 9 (0.7%) | 51 (40.8%) |
| $25,000 to $34,999 | 54 (4.3%) | 12 (9.6%) |
| $35,000 to $49,999 | 54 (4.3%) | 9 (7.2%) |
| $50,000 to $74,999 | 107 (8.5%) | 0 (0.0%) |
| $75,000 to $99,999 | 126 (10.0%) | 9 (7.2%) |
| $100,000 to $149,999 | 297 (23.5%) | 0 (0.0%) |
| $150,000 or more | 565 (44.7%) | 0 (0.0%) |
| Total | 1,263 (100.0%) | 125 (100.0%) |
Monthly Housing Cost Tiers in Pecan Acres
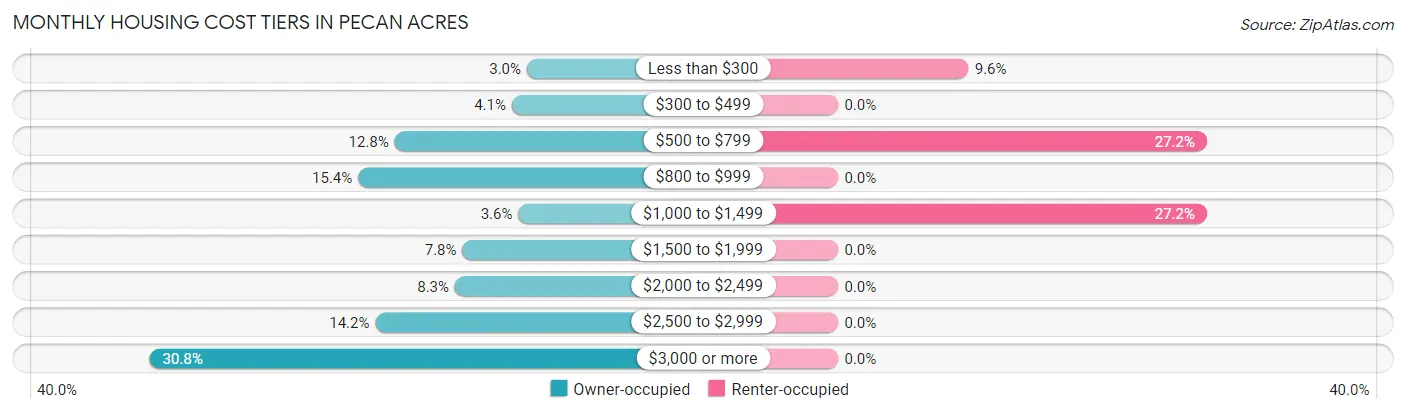
| Monthly Cost | Owner-occupied | Renter-occupied |
| Less than $300 | 38 (3.0%) | 12 (9.6%) |
| $300 to $499 | 52 (4.1%) | 0 (0.0%) |
| $500 to $799 | 161 (12.8%) | 34 (27.2%) |
| $800 to $999 | 195 (15.4%) | 0 (0.0%) |
| $1,000 to $1,499 | 46 (3.6%) | 34 (27.2%) |
| $1,500 to $1,999 | 98 (7.8%) | 0 (0.0%) |
| $2,000 to $2,499 | 105 (8.3%) | 0 (0.0%) |
| $2,500 to $2,999 | 179 (14.2%) | 0 (0.0%) |
| $3,000 or more | 389 (30.8%) | 0 (0.0%) |
| Total | 1,263 (100.0%) | 125 (100.0%) |
Physical Housing Characteristics in Pecan Acres
Housing Structures in Pecan Acres
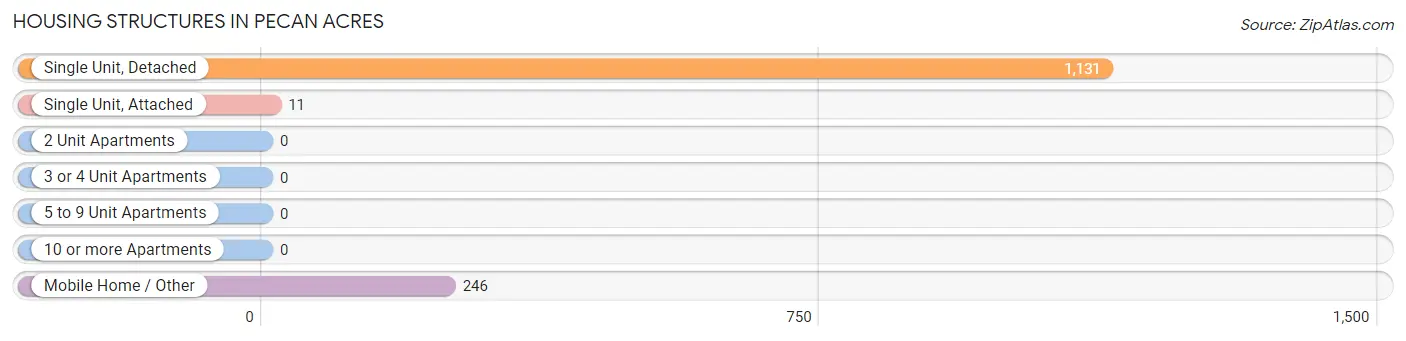
| Structure Type | # Housing Units | % Housing Units |
| Single Unit, Detached | 1,131 | 81.5% |
| Single Unit, Attached | 11 | 0.8% |
| 2 Unit Apartments | 0 | 0.0% |
| 3 or 4 Unit Apartments | 0 | 0.0% |
| 5 to 9 Unit Apartments | 0 | 0.0% |
| 10 or more Apartments | 0 | 0.0% |
| Mobile Home / Other | 246 | 17.7% |
| Total | 1,388 | 100.0% |
Housing Structures by Occupancy in Pecan Acres
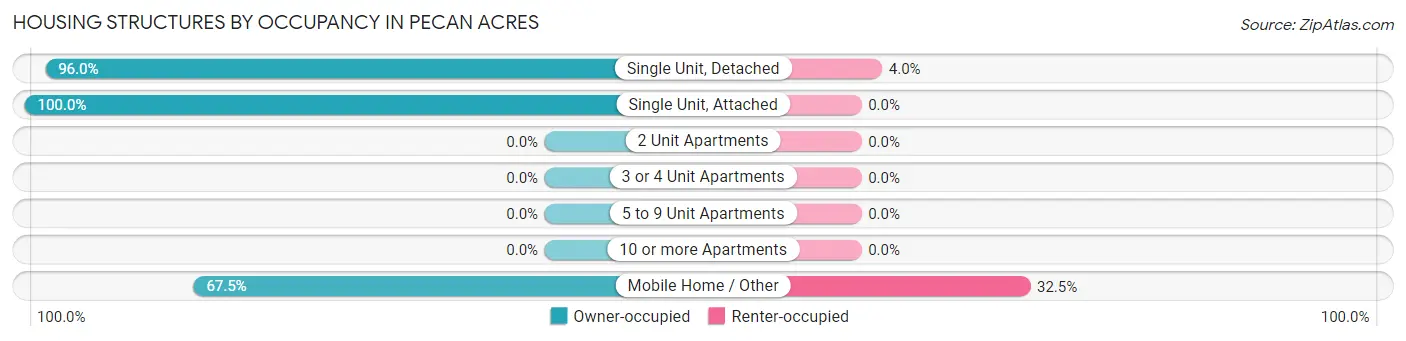
| Structure Type | Owner-occupied | Renter-occupied |
| Single Unit, Detached | 1,086 (96.0%) | 45 (4.0%) |
| Single Unit, Attached | 11 (100.0%) | 0 (0.0%) |
| 2 Unit Apartments | 0 (0.0%) | 0 (0.0%) |
| 3 or 4 Unit Apartments | 0 (0.0%) | 0 (0.0%) |
| 5 to 9 Unit Apartments | 0 (0.0%) | 0 (0.0%) |
| 10 or more Apartments | 0 (0.0%) | 0 (0.0%) |
| Mobile Home / Other | 166 (67.5%) | 80 (32.5%) |
| Total | 1,263 (91.0%) | 125 (9.0%) |
Housing Structures by Number of Rooms in Pecan Acres
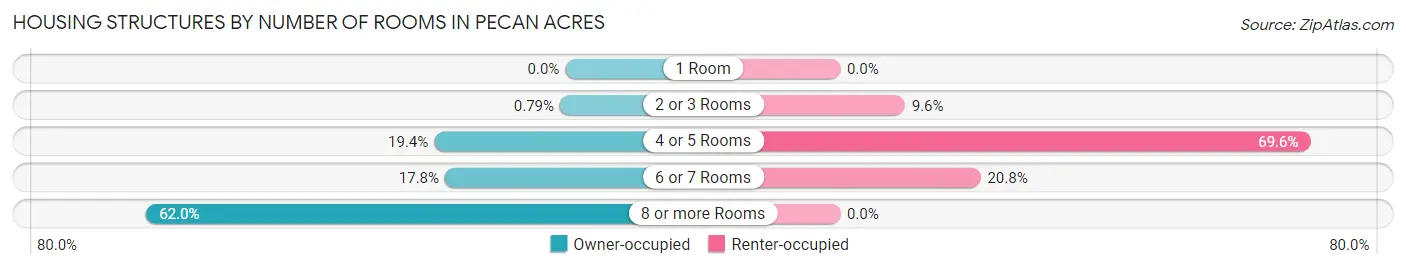
| Number of Rooms | Owner-occupied | Renter-occupied |
| 1 Room | 0 (0.0%) | 0 (0.0%) |
| 2 or 3 Rooms | 10 (0.8%) | 12 (9.6%) |
| 4 or 5 Rooms | 245 (19.4%) | 87 (69.6%) |
| 6 or 7 Rooms | 225 (17.8%) | 26 (20.8%) |
| 8 or more Rooms | 783 (62.0%) | 0 (0.0%) |
| Total | 1,263 (100.0%) | 125 (100.0%) |
Housing Structure by Heating Type in Pecan Acres
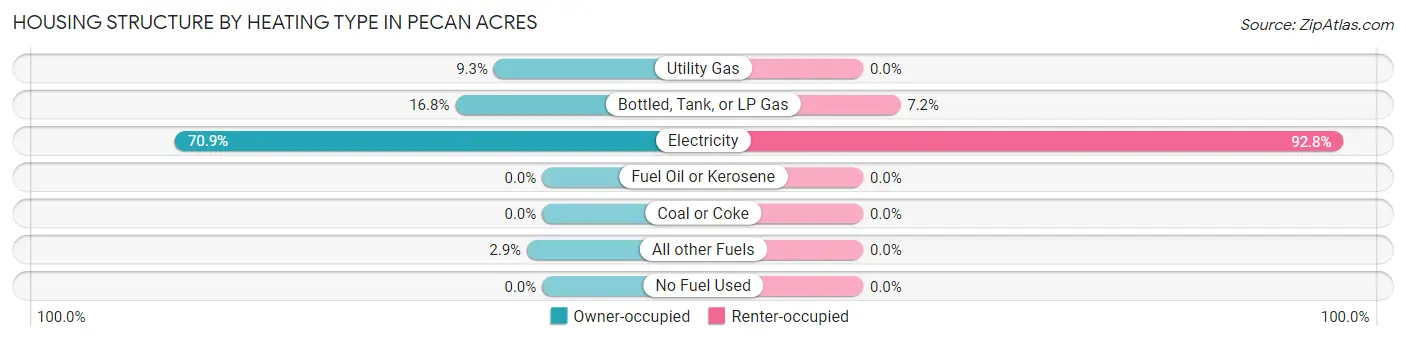
| Heating Type | Owner-occupied | Renter-occupied |
| Utility Gas | 118 (9.3%) | 0 (0.0%) |
| Bottled, Tank, or LP Gas | 212 (16.8%) | 9 (7.2%) |
| Electricity | 896 (70.9%) | 116 (92.8%) |
| Fuel Oil or Kerosene | 0 (0.0%) | 0 (0.0%) |
| Coal or Coke | 0 (0.0%) | 0 (0.0%) |
| All other Fuels | 37 (2.9%) | 0 (0.0%) |
| No Fuel Used | 0 (0.0%) | 0 (0.0%) |
| Total | 1,263 (100.0%) | 125 (100.0%) |
Household Vehicle Usage in Pecan Acres
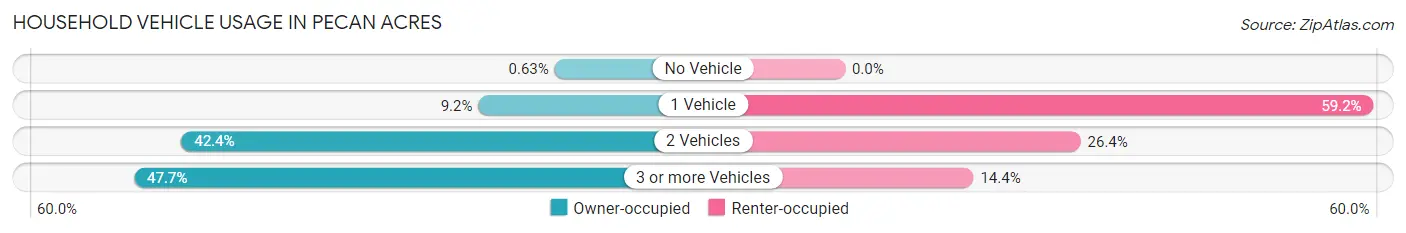
| Vehicles per Household | Owner-occupied | Renter-occupied |
| No Vehicle | 8 (0.6%) | 0 (0.0%) |
| 1 Vehicle | 116 (9.2%) | 74 (59.2%) |
| 2 Vehicles | 536 (42.4%) | 33 (26.4%) |
| 3 or more Vehicles | 603 (47.7%) | 18 (14.4%) |
| Total | 1,263 (100.0%) | 125 (100.0%) |
Real Estate & Mortgages in Pecan Acres
Real Estate and Mortgage Overview in Pecan Acres
| Characteristic | Without Mortgage | With Mortgage |
| Housing Units | 360 | 903 |
| Median Property Value | $344,100 | $548,100 |
| Median Household Income | $98,929 | $513 |
| Monthly Housing Costs | $591 | $389 |
| Real Estate Taxes | $2,767 | $34 |
Property Value by Mortgage Status in Pecan Acres
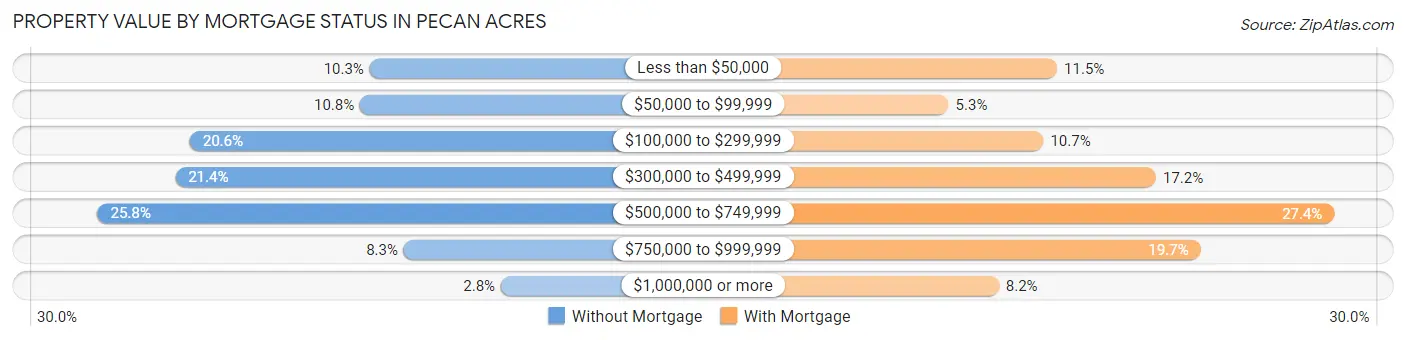
| Property Value | Without Mortgage | With Mortgage |
| Less than $50,000 | 37 (10.3%) | 104 (11.5%) |
| $50,000 to $99,999 | 39 (10.8%) | 48 (5.3%) |
| $100,000 to $299,999 | 74 (20.6%) | 97 (10.7%) |
| $300,000 to $499,999 | 77 (21.4%) | 155 (17.2%) |
| $500,000 to $749,999 | 93 (25.8%) | 247 (27.4%) |
| $750,000 to $999,999 | 30 (8.3%) | 178 (19.7%) |
| $1,000,000 or more | 10 (2.8%) | 74 (8.2%) |
| Total | 360 (100.0%) | 903 (100.0%) |
Household Income by Mortgage Status in Pecan Acres
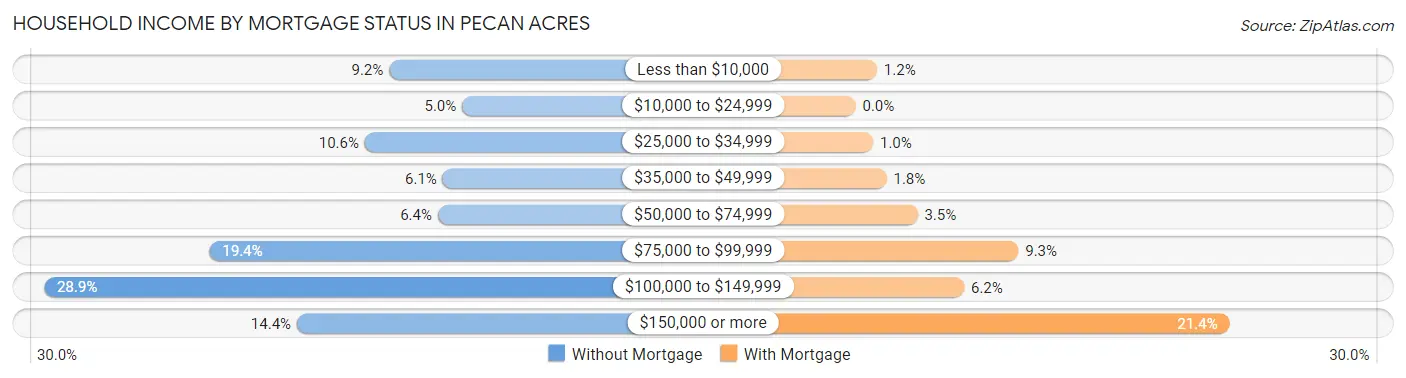
| Household Income | Without Mortgage | With Mortgage |
| Less than $10,000 | 33 (9.2%) | 11 (1.2%) |
| $10,000 to $24,999 | 18 (5.0%) | 0 (0.0%) |
| $25,000 to $34,999 | 38 (10.6%) | 9 (1.0%) |
| $35,000 to $49,999 | 22 (6.1%) | 16 (1.8%) |
| $50,000 to $74,999 | 23 (6.4%) | 32 (3.5%) |
| $75,000 to $99,999 | 70 (19.4%) | 84 (9.3%) |
| $100,000 to $149,999 | 104 (28.9%) | 56 (6.2%) |
| $150,000 or more | 52 (14.4%) | 193 (21.4%) |
| Total | 360 (100.0%) | 903 (100.0%) |
Property Value to Household Income Ratio in Pecan Acres
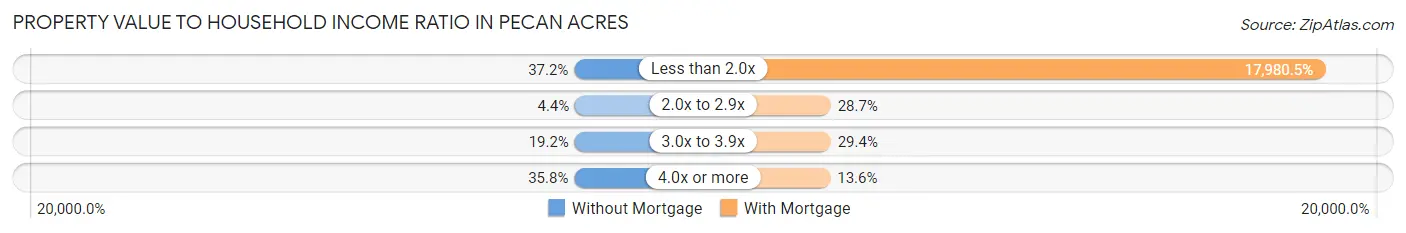
| Value-to-Income Ratio | Without Mortgage | With Mortgage |
| Less than 2.0x | 134 (37.2%) | 162,364 (17,980.5%) |
| 2.0x to 2.9x | 16 (4.4%) | 259 (28.7%) |
| 3.0x to 3.9x | 69 (19.2%) | 265 (29.3%) |
| 4.0x or more | 129 (35.8%) | 123 (13.6%) |
| Total | 360 (100.0%) | 903 (100.0%) |
Real Estate Taxes by Mortgage Status in Pecan Acres
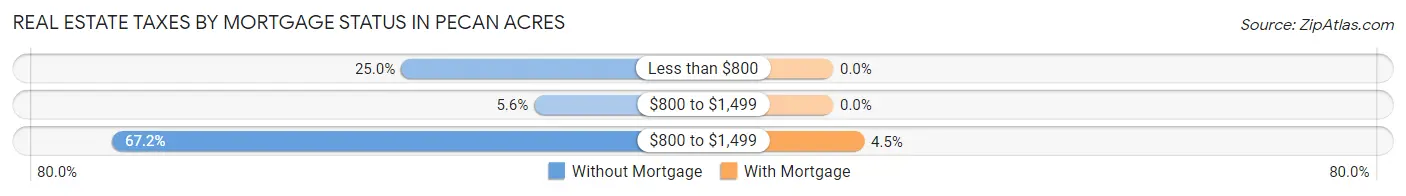
| Property Taxes | Without Mortgage | With Mortgage |
| Less than $800 | 90 (25.0%) | 0 (0.0%) |
| $800 to $1,499 | 20 (5.6%) | 0 (0.0%) |
| $800 to $1,499 | 242 (67.2%) | 41 (4.5%) |
| Total | 360 (100.0%) | 903 (100.0%) |
Health & Disability in Pecan Acres
Health Insurance Coverage by Age in Pecan Acres
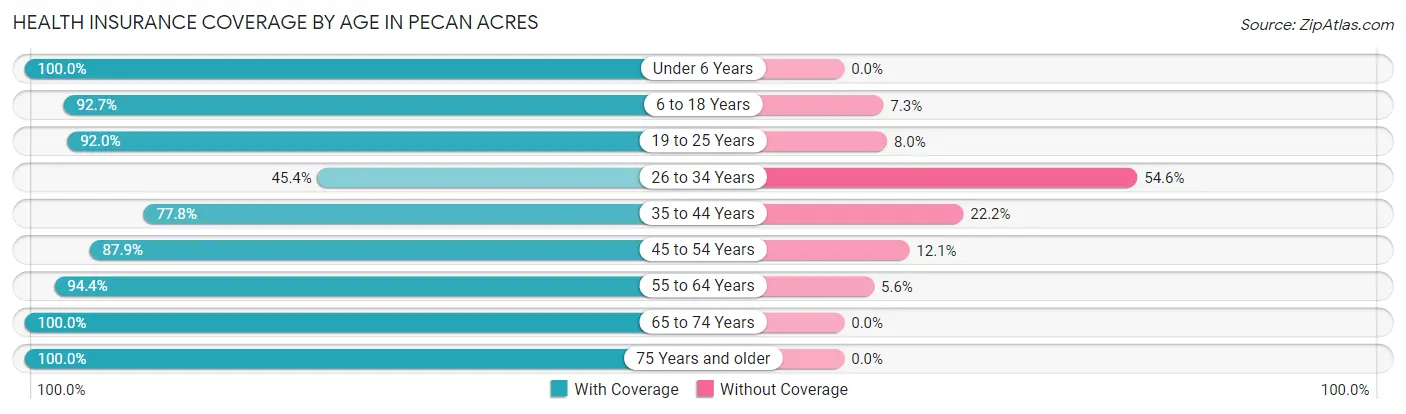
| Age Bracket | With Coverage | Without Coverage |
| Under 6 Years | 81 (100.0%) | 0 (0.0%) |
| 6 to 18 Years | 966 (92.7%) | 76 (7.3%) |
| 19 to 25 Years | 185 (92.0%) | 16 (8.0%) |
| 26 to 34 Years | 127 (45.4%) | 153 (54.6%) |
| 35 to 44 Years | 459 (77.8%) | 131 (22.2%) |
| 45 to 54 Years | 550 (87.9%) | 76 (12.1%) |
| 55 to 64 Years | 629 (94.4%) | 37 (5.6%) |
| 65 to 74 Years | 348 (100.0%) | 0 (0.0%) |
| 75 Years and older | 147 (100.0%) | 0 (0.0%) |
| Total | 3,492 (87.7%) | 489 (12.3%) |
Health Insurance Coverage by Citizenship Status in Pecan Acres
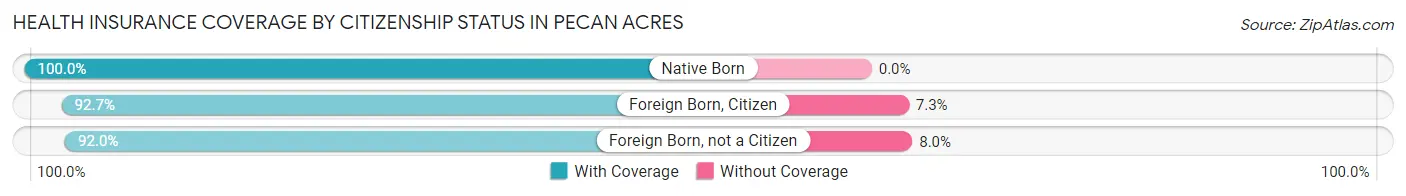
| Citizenship Status | With Coverage | Without Coverage |
| Native Born | 81 (100.0%) | 0 (0.0%) |
| Foreign Born, Citizen | 966 (92.7%) | 76 (7.3%) |
| Foreign Born, not a Citizen | 185 (92.0%) | 16 (8.0%) |
Health Insurance Coverage by Household Income in Pecan Acres
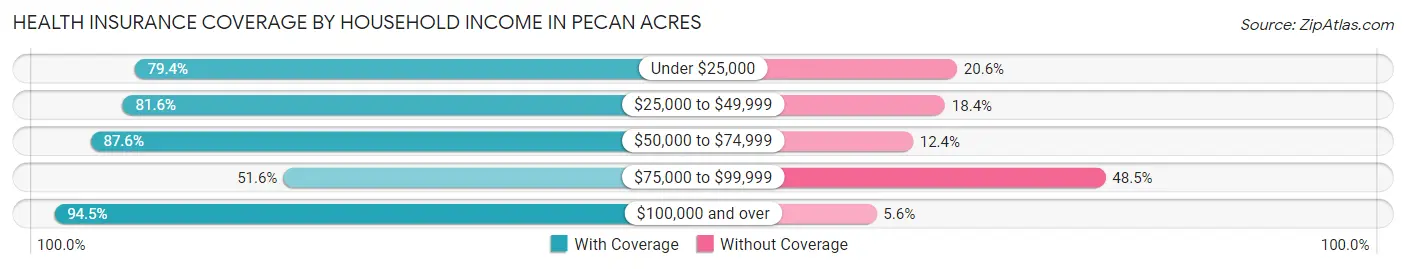
| Household Income | With Coverage | Without Coverage |
| Under $25,000 | 404 (79.4%) | 105 (20.6%) |
| $25,000 to $49,999 | 222 (81.6%) | 50 (18.4%) |
| $50,000 to $74,999 | 234 (87.6%) | 33 (12.4%) |
| $75,000 to $99,999 | 166 (51.5%) | 156 (48.4%) |
| $100,000 and over | 2,466 (94.5%) | 145 (5.6%) |
Public vs Private Health Insurance Coverage by Age in Pecan Acres
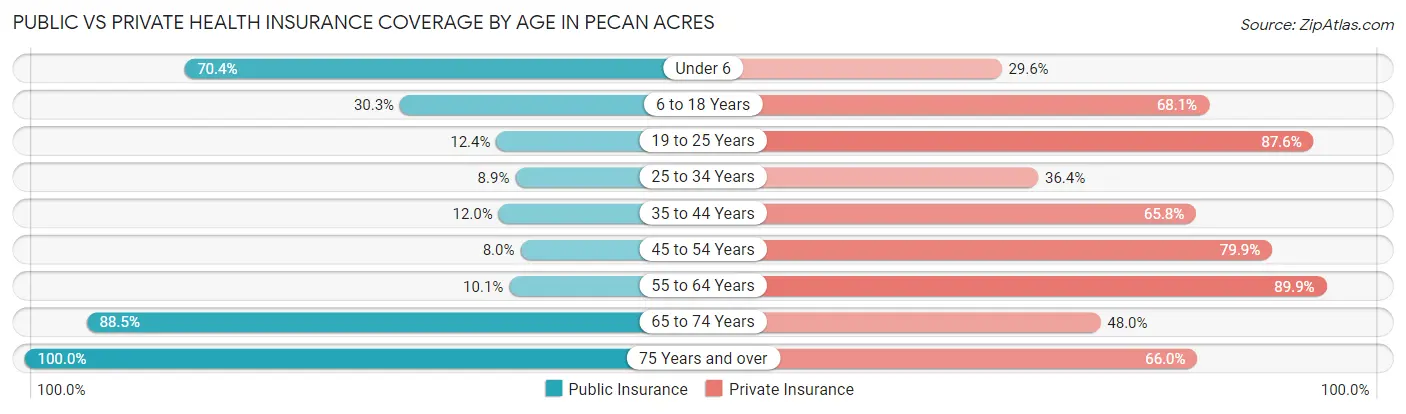
| Age Bracket | Public Insurance | Private Insurance |
| Under 6 | 57 (70.4%) | 24 (29.6%) |
| 6 to 18 Years | 316 (30.3%) | 710 (68.1%) |
| 19 to 25 Years | 25 (12.4%) | 176 (87.6%) |
| 25 to 34 Years | 25 (8.9%) | 102 (36.4%) |
| 35 to 44 Years | 71 (12.0%) | 388 (65.8%) |
| 45 to 54 Years | 50 (8.0%) | 500 (79.9%) |
| 55 to 64 Years | 67 (10.1%) | 599 (89.9%) |
| 65 to 74 Years | 308 (88.5%) | 167 (48.0%) |
| 75 Years and over | 147 (100.0%) | 97 (66.0%) |
| Total | 1,066 (26.8%) | 2,763 (69.4%) |
Disability Status by Sex by Age in Pecan Acres
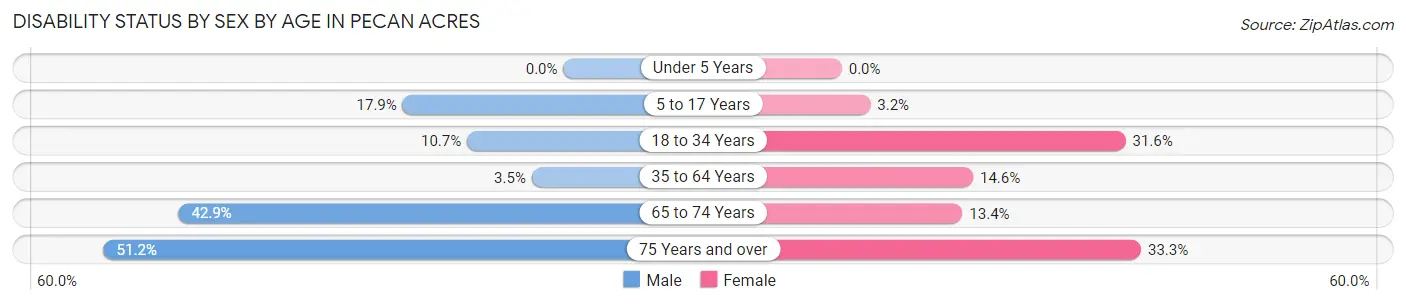
| Age Bracket | Male | Female |
| Under 5 Years | 0 (0.0%) | 0 (0.0%) |
| 5 to 17 Years | 104 (17.9%) | 12 (3.2%) |
| 18 to 34 Years | 34 (10.7%) | 85 (31.6%) |
| 35 to 64 Years | 33 (3.5%) | 138 (14.6%) |
| 65 to 74 Years | 63 (42.9%) | 27 (13.4%) |
| 75 Years and over | 43 (51.2%) | 21 (33.3%) |
Disability Class by Sex by Age in Pecan Acres
Disability Class: Hearing Difficulty
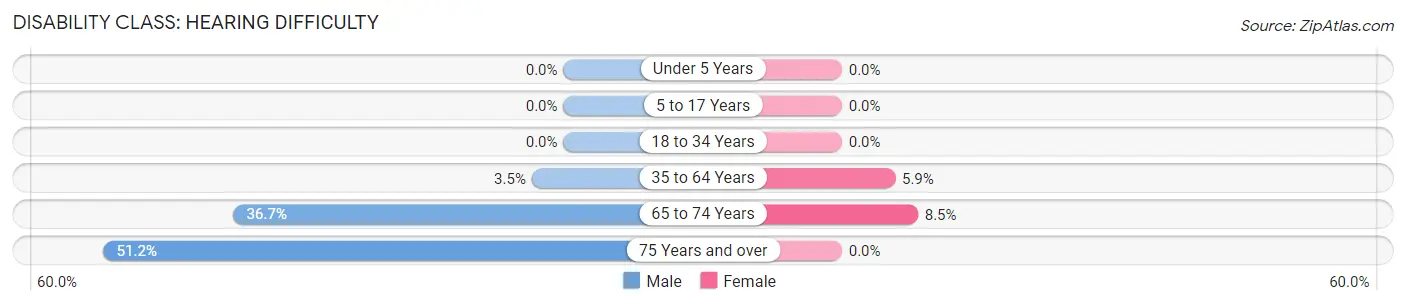
| Age Bracket | Male | Female |
| Under 5 Years | 0 (0.0%) | 0 (0.0%) |
| 5 to 17 Years | 0 (0.0%) | 0 (0.0%) |
| 18 to 34 Years | 0 (0.0%) | 0 (0.0%) |
| 35 to 64 Years | 33 (3.5%) | 56 (5.9%) |
| 65 to 74 Years | 54 (36.7%) | 17 (8.5%) |
| 75 Years and over | 43 (51.2%) | 0 (0.0%) |
Disability Class: Vision Difficulty
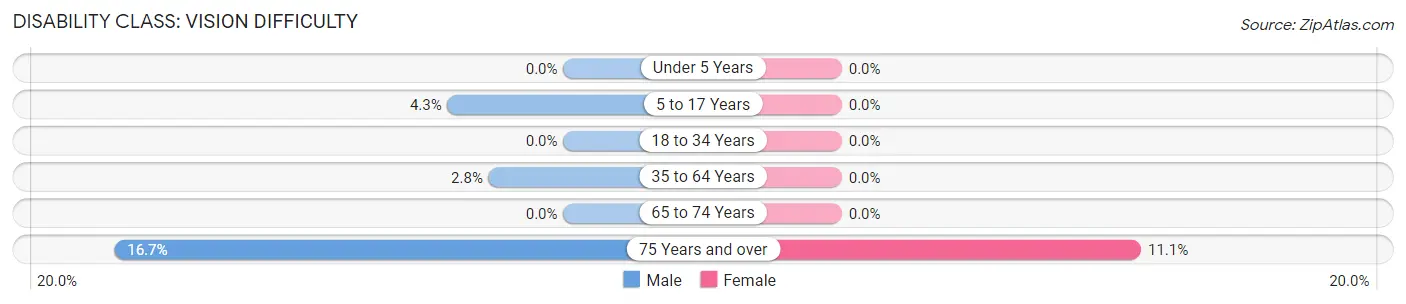
| Age Bracket | Male | Female |
| Under 5 Years | 0 (0.0%) | 0 (0.0%) |
| 5 to 17 Years | 25 (4.3%) | 0 (0.0%) |
| 18 to 34 Years | 0 (0.0%) | 0 (0.0%) |
| 35 to 64 Years | 26 (2.8%) | 0 (0.0%) |
| 65 to 74 Years | 0 (0.0%) | 0 (0.0%) |
| 75 Years and over | 14 (16.7%) | 7 (11.1%) |
Disability Class: Cognitive Difficulty
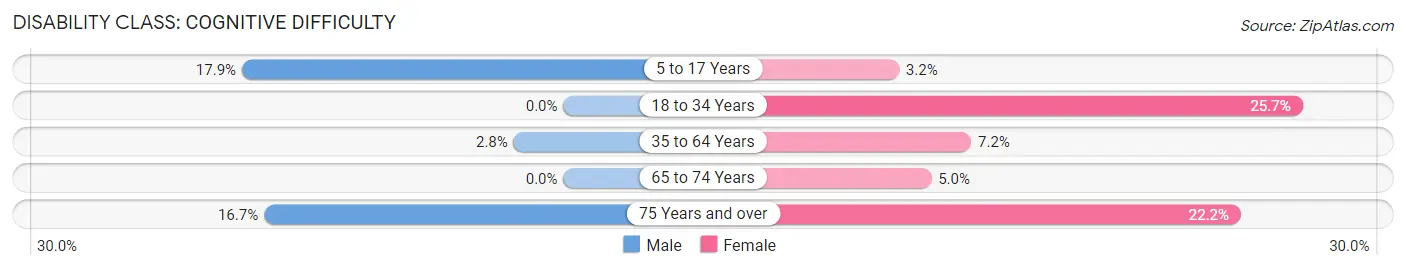
| Age Bracket | Male | Female |
| 5 to 17 Years | 104 (17.9%) | 12 (3.2%) |
| 18 to 34 Years | 0 (0.0%) | 69 (25.7%) |
| 35 to 64 Years | 26 (2.8%) | 68 (7.2%) |
| 65 to 74 Years | 0 (0.0%) | 10 (5.0%) |
| 75 Years and over | 14 (16.7%) | 14 (22.2%) |
Disability Class: Ambulatory Difficulty
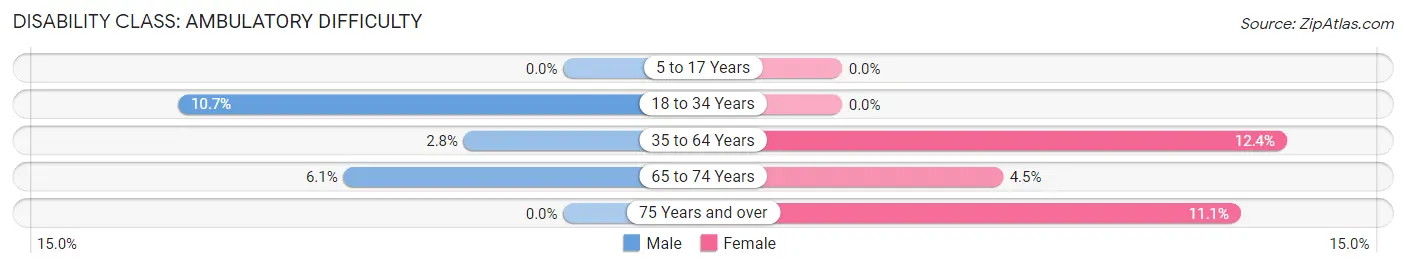
| Age Bracket | Male | Female |
| 5 to 17 Years | 0 (0.0%) | 0 (0.0%) |
| 18 to 34 Years | 34 (10.7%) | 0 (0.0%) |
| 35 to 64 Years | 26 (2.8%) | 117 (12.4%) |
| 65 to 74 Years | 9 (6.1%) | 9 (4.5%) |
| 75 Years and over | 0 (0.0%) | 7 (11.1%) |
Disability Class: Self-Care Difficulty
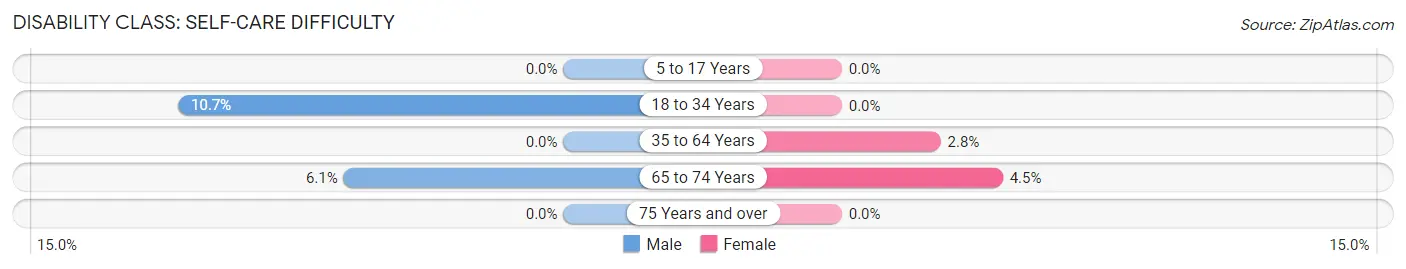
| Age Bracket | Male | Female |
| 5 to 17 Years | 0 (0.0%) | 0 (0.0%) |
| 18 to 34 Years | 34 (10.7%) | 0 (0.0%) |
| 35 to 64 Years | 0 (0.0%) | 26 (2.8%) |
| 65 to 74 Years | 9 (6.1%) | 9 (4.5%) |
| 75 Years and over | 0 (0.0%) | 0 (0.0%) |
Technology Access in Pecan Acres
Computing Device Access in Pecan Acres
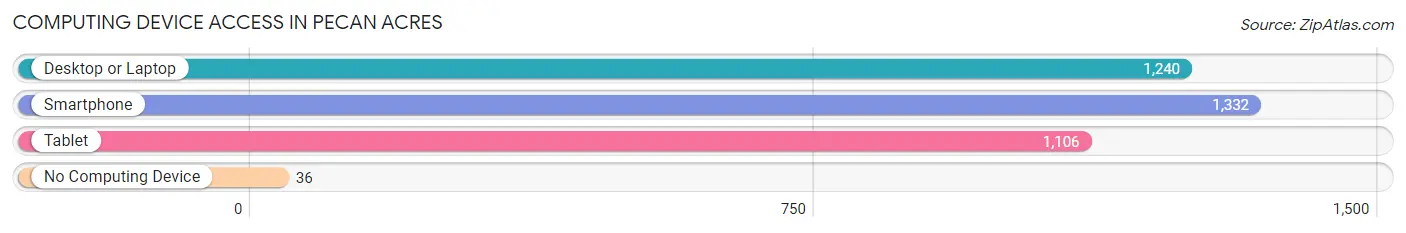
| Device Type | # Households | % Households |
| Desktop or Laptop | 1,240 | 89.3% |
| Smartphone | 1,332 | 96.0% |
| Tablet | 1,106 | 79.7% |
| No Computing Device | 36 | 2.6% |
| Total | 1,388 | 100.0% |
Internet Access in Pecan Acres
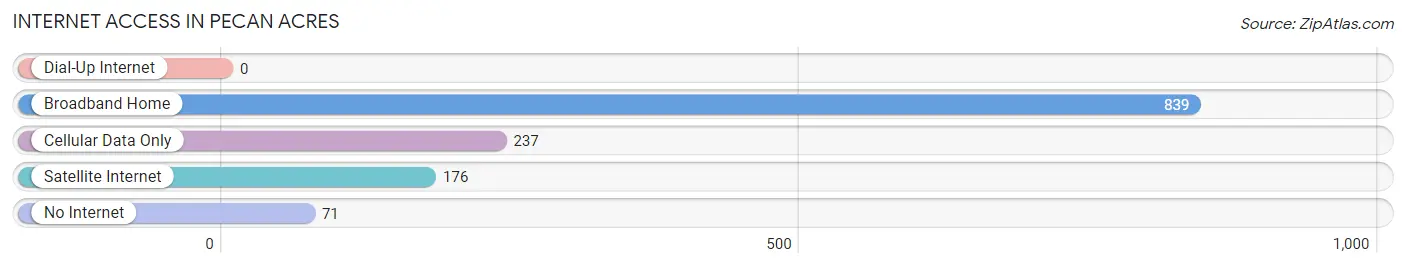
| Internet Type | # Households | % Households |
| Dial-Up Internet | 0 | 0.0% |
| Broadband Home | 839 | 60.5% |
| Cellular Data Only | 237 | 17.1% |
| Satellite Internet | 176 | 12.7% |
| No Internet | 71 | 5.1% |
| Total | 1,388 | 100.0% |
Pecan Acres Summary
Pecan Acres, Texas is a small town located in the southeastern corner of the state, just outside of Houston. It is a rural community with a population of just over 1,000 people. The town is known for its pecan orchards, which have been a major part of the local economy for generations.
Geography
Pecan Acres is located in the southeastern corner of Texas, just outside of Houston. It is situated in the Brazos River Valley, which is a fertile agricultural region. The town is surrounded by rolling hills and is home to several pecan orchards. The climate is humid and subtropical, with hot summers and mild winters.
History
Pecan Acres was founded in the late 1800s by a group of settlers who were looking for a place to grow pecans. The town was originally called Pecan Grove, but the name was changed to Pecan Acres in the early 1900s. The town grew slowly over the years, and by the mid-1900s it had become a thriving agricultural community.
Economy
Pecan Acres is a rural community with a strong agricultural economy. The town is known for its pecan orchards, which have been a major part of the local economy for generations. The town also has a few small businesses, including a grocery store, a hardware store, and a few restaurants.
Demographics
As of the 2010 census, the population of Pecan Acres was 1,072. The racial makeup of the town was 94.3% White, 2.2% African American, 0.7% Native American, 0.3% Asian, and 2.5% from other races. The median household income was $37,917, and the median age was 37.
Conclusion
Pecan Acres, Texas is a small rural town located in the southeastern corner of the state. It is known for its pecan orchards, which have been a major part of the local economy for generations. The town has a population of just over 1,000 people, and the racial makeup is predominantly White. The median household income is $37,917, and the median age is 37. Pecan Acres is a quiet, peaceful town with a strong sense of community.
Common Questions
What is Per Capita Income in Pecan Acres?
Per Capita income in Pecan Acres is $59,514.
What is the Median Family Income in Pecan Acres?
Median Family Income in Pecan Acres is $133,646.
What is the Median Household income in Pecan Acres?
Median Household Income in Pecan Acres is $119,231.
What is Income or Wage Gap in Pecan Acres?
Income or Wage Gap in Pecan Acres is 38.3%.
Women in Pecan Acres earn 61.7 cents for every dollar earned by a man.
What is Family Income Deficit in Pecan Acres?
Family Income Deficit in Pecan Acres is $12,250.
Families that are below poverty line in Pecan Acres earn $12,250 less on average than the poverty threshold level.
What is Inequality or Gini Index in Pecan Acres?
Inequality or Gini Index in Pecan Acres is 0.47.
What is the Total Population of Pecan Acres?
Total Population of Pecan Acres is 3,981.
What is the Total Male Population of Pecan Acres?
Total Male Population of Pecan Acres is 2,114.
What is the Total Female Population of Pecan Acres?
Total Female Population of Pecan Acres is 1,867.
What is the Ratio of Males per 100 Females in Pecan Acres?
There are 113.23 Males per 100 Females in Pecan Acres.
What is the Ratio of Females per 100 Males in Pecan Acres?
There are 88.32 Females per 100 Males in Pecan Acres.
What is the Median Population Age in Pecan Acres?
Median Population Age in Pecan Acres is 43.2 Years.
What is the Average Family Size in Pecan Acres
Average Family Size in Pecan Acres is 3.1 People.
What is the Average Household Size in Pecan Acres
Average Household Size in Pecan Acres is 2.9 People.
How Large is the Labor Force in Pecan Acres?
There are 1,909 People in the Labor Forcein in Pecan Acres.
What is the Percentage of People in the Labor Force in Pecan Acres?
59.7% of People are in the Labor Force in Pecan Acres.
What is the Unemployment Rate in Pecan Acres?
Unemployment Rate in Pecan Acres is 12.4%.