Wharton, TX Map & Demographics
Wharton Map
Wharton Overview
$23,247
PER CAPITA INCOME
$65,893
AVG FAMILY INCOME
$37,722
AVG HOUSEHOLD INCOME
49.2%
WAGE / INCOME GAP [ % ]
50.8¢/ $1
WAGE / INCOME GAP [ $ ]
0.46
INEQUALITY / GINI INDEX
8,669
TOTAL POPULATION
4,134
MALE POPULATION
4,535
FEMALE POPULATION
91.16
MALES / 100 FEMALES
109.70
FEMALES / 100 MALES
36.0
MEDIAN AGE
3.5
AVG FAMILY SIZE
2.4
AVG HOUSEHOLD SIZE
4,002
LABOR FORCE [ PEOPLE ]
57.8%
PERCENT IN LABOR FORCE
4.9%
UNEMPLOYMENT RATE
Wharton Zip Codes
Wharton Area Codes
Income in Wharton
Income Overview in Wharton
Per Capita Income in Wharton is $23,247, while median incomes of families and households are $65,893 and $37,722 respectively.
| Characteristic | Number | Measure |
| Per Capita Income | 8,669 | $23,247 |
| Median Family Income | 1,859 | $65,893 |
| Mean Family Income | 1,859 | $77,176 |
| Median Household Income | 3,466 | $37,722 |
| Mean Household Income | 3,466 | $57,080 |
| Income Deficit | 1,859 | $0 |
| Wage / Income Gap (%) | 8,669 | 49.20% |
| Wage / Income Gap ($) | 8,669 | 50.80¢ per $1 |
| Gini / Inequality Index | 8,669 | 0.46 |
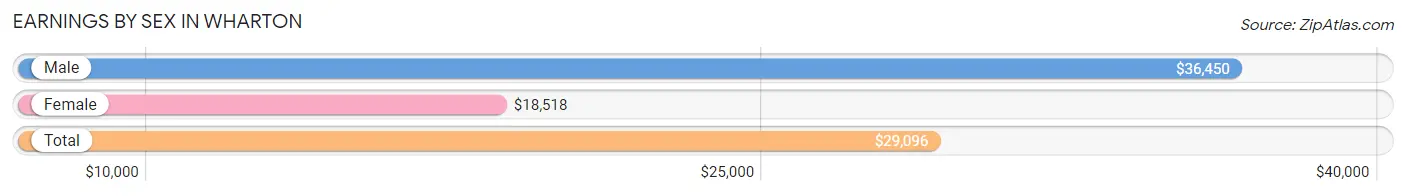
Earnings by Sex in Wharton
Average Earnings in Wharton are $29,096, $36,450 for men and $18,518 for women, a difference of 49.2%.
| Sex | Number | Average Earnings |
| Male | 2,165 (51.2%) | $36,450 |
| Female | 2,066 (48.8%) | $18,518 |
| Total | 4,231 (100.0%) | $29,096 |
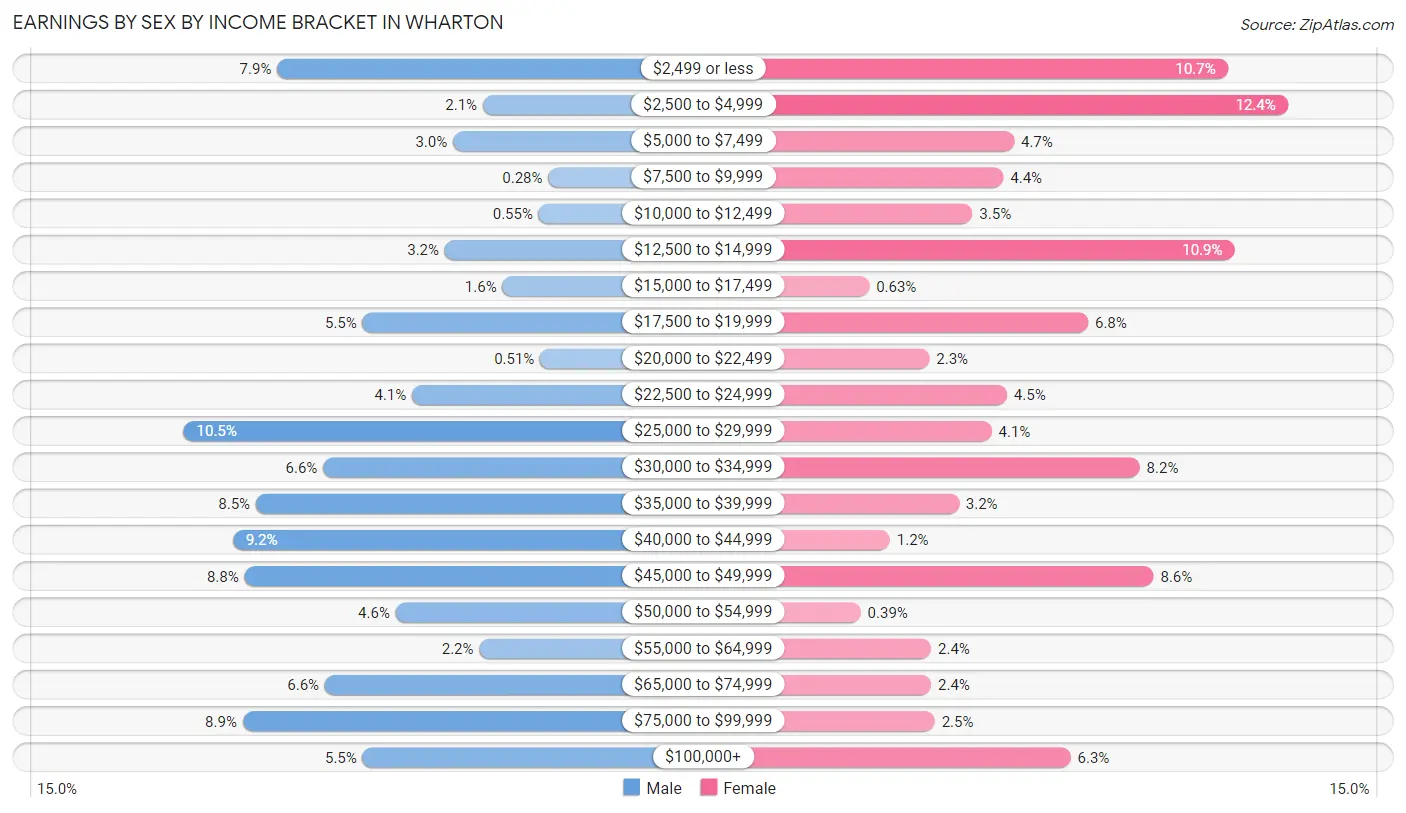
Earnings by Sex by Income Bracket in Wharton
The most common earnings brackets in Wharton are $25,000 to $29,999 for men (228 | 10.5%) and $2,500 to $4,999 for women (256 | 12.4%).
| Income | Male | Female |
| $2,499 or less | 171 (7.9%) | 221 (10.7%) |
| $2,500 to $4,999 | 46 (2.1%) | 256 (12.4%) |
| $5,000 to $7,499 | 64 (3.0%) | 97 (4.7%) |
| $7,500 to $9,999 | 6 (0.3%) | 91 (4.4%) |
| $10,000 to $12,499 | 12 (0.5%) | 73 (3.5%) |
| $12,500 to $14,999 | 69 (3.2%) | 225 (10.9%) |
| $15,000 to $17,499 | 34 (1.6%) | 13 (0.6%) |
| $17,500 to $19,999 | 119 (5.5%) | 140 (6.8%) |
| $20,000 to $22,499 | 11 (0.5%) | 48 (2.3%) |
| $22,500 to $24,999 | 89 (4.1%) | 93 (4.5%) |
| $25,000 to $29,999 | 228 (10.5%) | 84 (4.1%) |
| $30,000 to $34,999 | 143 (6.6%) | 170 (8.2%) |
| $35,000 to $39,999 | 184 (8.5%) | 65 (3.2%) |
| $40,000 to $44,999 | 198 (9.1%) | 25 (1.2%) |
| $45,000 to $49,999 | 191 (8.8%) | 178 (8.6%) |
| $50,000 to $54,999 | 99 (4.6%) | 8 (0.4%) |
| $55,000 to $64,999 | 48 (2.2%) | 49 (2.4%) |
| $65,000 to $74,999 | 142 (6.6%) | 49 (2.4%) |
| $75,000 to $99,999 | 192 (8.9%) | 51 (2.5%) |
| $100,000+ | 119 (5.5%) | 130 (6.3%) |
| Total | 2,165 (100.0%) | 2,066 (100.0%) |
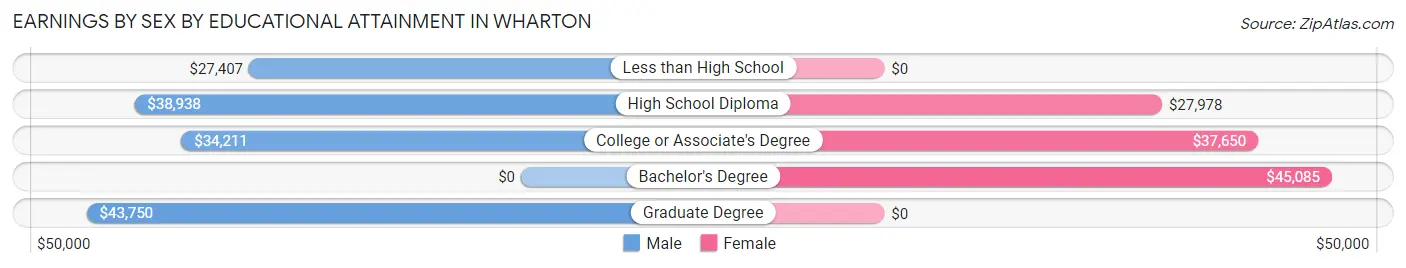
Earnings by Sex by Educational Attainment in Wharton
Average earnings in Wharton are $37,179 for men and $24,852 for women, a difference of 33.2%. Men with an educational attainment of graduate degree enjoy the highest average annual earnings of $43,750, while those with less than high school education earn the least with $27,407. Women with an educational attainment of bachelor's degree earn the most with the average annual earnings of $45,085, while those with high school diploma education have the smallest earnings of $27,978.
| Educational Attainment | Male Income | Female Income |
| Less than High School | $27,407 | $0 |
| High School Diploma | $38,938 | $27,978 |
| College or Associate's Degree | $34,211 | $37,650 |
| Bachelor's Degree | - | - |
| Graduate Degree | $43,750 | $0 |
| Total | $37,179 | $24,852 |
Family Income in Wharton
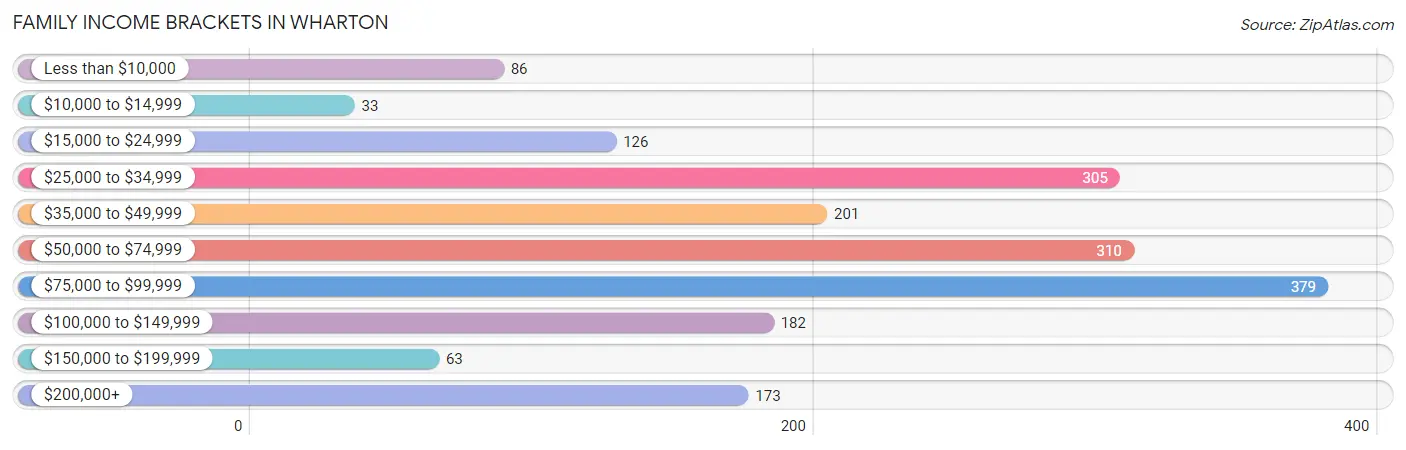
Family Income Brackets in Wharton
According to the Wharton family income data, there are 379 families falling into the $75,000 to $99,999 income range, which is the most common income bracket and makes up 20.4% of all families. Conversely, the $10,000 to $14,999 income bracket is the least frequent group with only 33 families (1.8%) belonging to this category.
| Income Bracket | # Families | % Families |
| Less than $10,000 | 86 | 4.6% |
| $10,000 to $14,999 | 33 | 1.8% |
| $15,000 to $24,999 | 126 | 6.8% |
| $25,000 to $34,999 | 305 | 16.4% |
| $35,000 to $49,999 | 201 | 10.8% |
| $50,000 to $74,999 | 310 | 16.7% |
| $75,000 to $99,999 | 379 | 20.4% |
| $100,000 to $149,999 | 182 | 9.8% |
| $150,000 to $199,999 | 63 | 3.4% |
| $200,000+ | 173 | 9.3% |
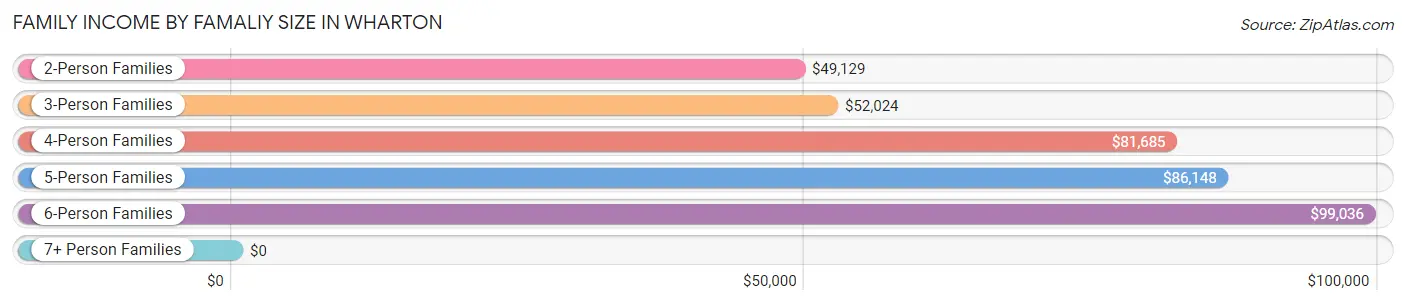
Family Income by Famaliy Size in Wharton
6-person families (103 | 5.5%) account for the highest median family income in Wharton with $99,036 per family, while 2-person families (697 | 37.5%) have the highest median income of $24,564 per family member.
| Income Bracket | # Families | Median Income |
| 2-Person Families | 697 (37.5%) | $49,129 |
| 3-Person Families | 456 (24.5%) | $52,024 |
| 4-Person Families | 322 (17.3%) | $81,685 |
| 5-Person Families | 235 (12.6%) | $86,148 |
| 6-Person Families | 103 (5.5%) | $99,036 |
| 7+ Person Families | 46 (2.5%) | $0 |
| Total | 1,859 (100.0%) | $65,893 |
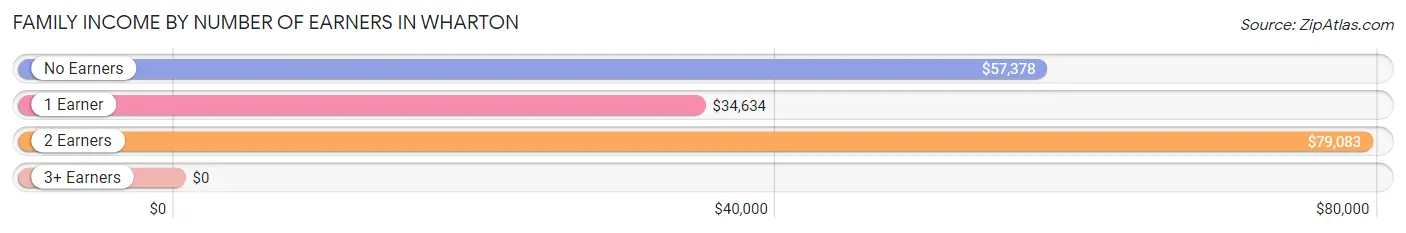
Family Income by Number of Earners in Wharton
| Number of Earners | # Families | Median Income |
| No Earners | 226 (12.2%) | $57,378 |
| 1 Earner | 678 (36.5%) | $34,634 |
| 2 Earners | 651 (35.0%) | $79,083 |
| 3+ Earners | 304 (16.4%) | $0 |
| Total | 1,859 (100.0%) | $65,893 |
Household Income in Wharton
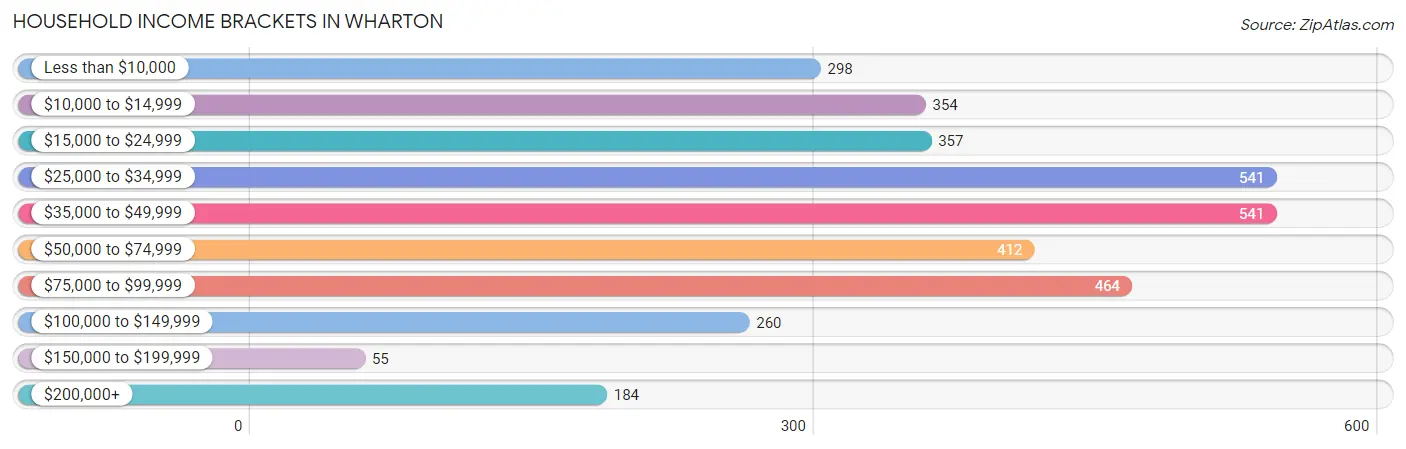
Household Income Brackets in Wharton
With 541 households falling in the category, the $25,000 to $34,999 income range is the most frequent in Wharton, accounting for 15.6% of all households. In contrast, only 55 households (1.6%) fall into the $150,000 to $199,999 income bracket, making it the least populous group.
| Income Bracket | # Households | % Households |
| Less than $10,000 | 298 | 8.6% |
| $10,000 to $14,999 | 354 | 10.2% |
| $15,000 to $24,999 | 357 | 10.3% |
| $25,000 to $34,999 | 541 | 15.6% |
| $35,000 to $49,999 | 541 | 15.6% |
| $50,000 to $74,999 | 412 | 11.9% |
| $75,000 to $99,999 | 464 | 13.4% |
| $100,000 to $149,999 | 260 | 7.5% |
| $150,000 to $199,999 | 55 | 1.6% |
| $200,000+ | 184 | 5.3% |
Household Income by Householder Age in Wharton
The median household income in Wharton is $37,722, with the highest median household income of $45,684 found in the 45 to 64 years age bracket for the primary householder. A total of 1,077 households (31.1%) fall into this category. Meanwhile, the 15 to 24 years age bracket for the primary householder has the lowest median household income of $0, with 72 households (2.1%) in this group.
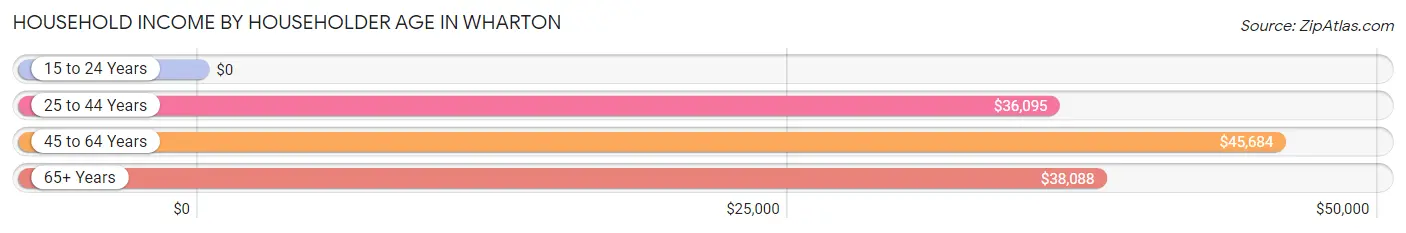
| Income Bracket | # Households | Median Income |
| 15 to 24 Years | 72 (2.1%) | $0 |
| 25 to 44 Years | 1,281 (37.0%) | $36,095 |
| 45 to 64 Years | 1,077 (31.1%) | $45,684 |
| 65+ Years | 1,036 (29.9%) | $38,088 |
| Total | 3,466 (100.0%) | $37,722 |
Poverty in Wharton
Income Below Poverty by Sex and Age in Wharton
With 13.7% poverty level for males and 27.6% for females among the residents of Wharton, 12 to 14 year old males and 6 to 11 year old females are the most vulnerable to poverty, with 18 males (47.4%) and 87 females (77.7%) in their respective age groups living below the poverty level.
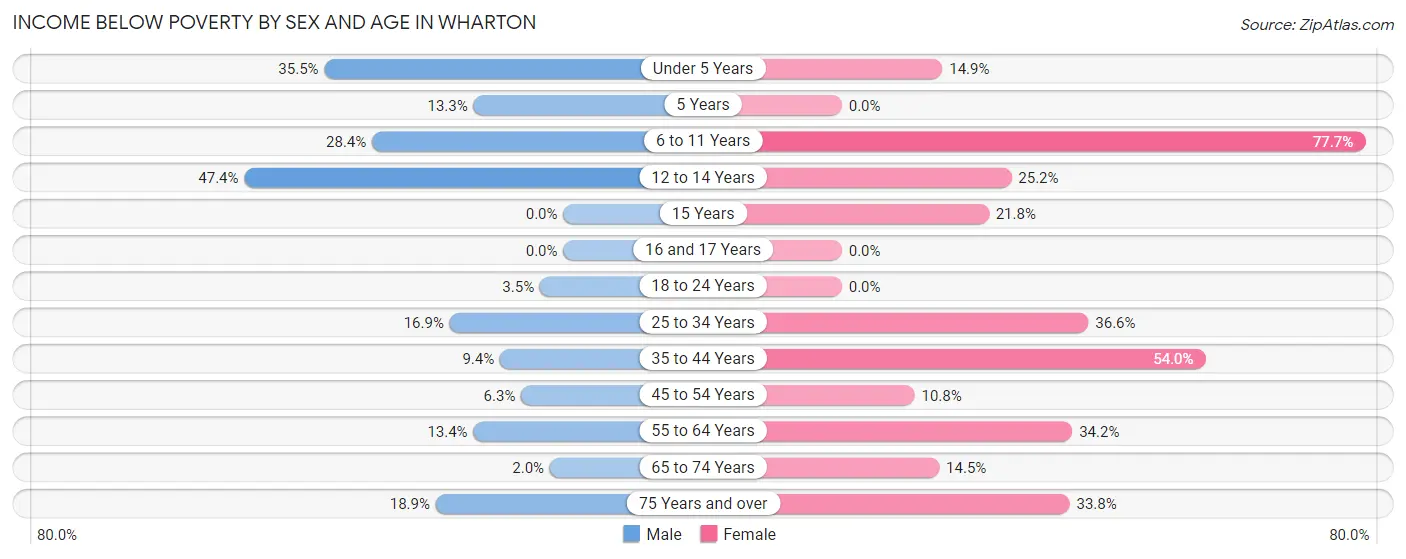
| Age Bracket | Male | Female |
| Under 5 Years | 99 (35.5%) | 60 (14.9%) |
| 5 Years | 10 (13.3%) | 0 (0.0%) |
| 6 to 11 Years | 117 (28.4%) | 87 (77.7%) |
| 12 to 14 Years | 18 (47.4%) | 69 (25.2%) |
| 15 Years | 0 (0.0%) | 12 (21.8%) |
| 16 and 17 Years | 0 (0.0%) | 0 (0.0%) |
| 18 to 24 Years | 19 (3.5%) | 0 (0.0%) |
| 25 to 34 Years | 55 (16.9%) | 257 (36.6%) |
| 35 to 44 Years | 74 (9.4%) | 278 (54.0%) |
| 45 to 54 Years | 25 (6.2%) | 46 (10.8%) |
| 55 to 64 Years | 53 (13.4%) | 180 (34.2%) |
| 65 to 74 Years | 5 (2.0%) | 47 (14.5%) |
| 75 Years and over | 57 (18.9%) | 186 (33.8%) |
| Total | 532 (13.7%) | 1,222 (27.6%) |
Income Above Poverty by Sex and Age in Wharton
According to the poverty statistics in Wharton, males aged 16 and 17 years and females aged 5 years are the age groups that are most secure financially, with 100.0% of males and 100.0% of females in these age groups living above the poverty line.
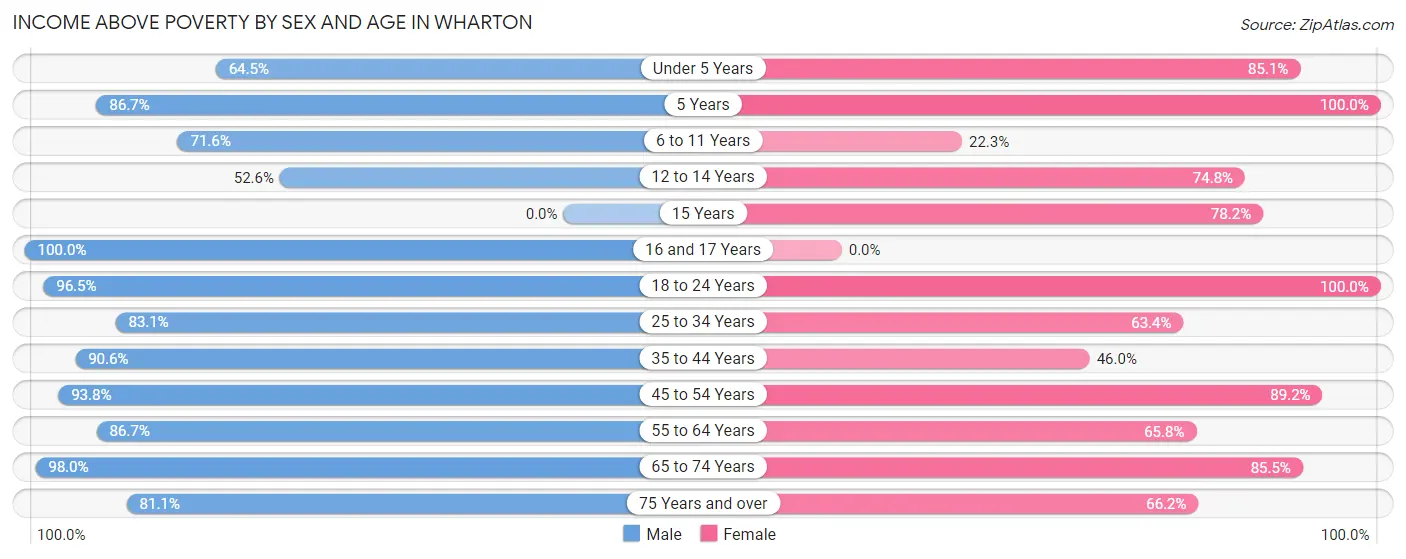
| Age Bracket | Male | Female |
| Under 5 Years | 180 (64.5%) | 342 (85.1%) |
| 5 Years | 65 (86.7%) | 98 (100.0%) |
| 6 to 11 Years | 295 (71.6%) | 25 (22.3%) |
| 12 to 14 Years | 20 (52.6%) | 205 (74.8%) |
| 15 Years | 0 (0.0%) | 43 (78.2%) |
| 16 and 17 Years | 72 (100.0%) | 0 (0.0%) |
| 18 to 24 Years | 528 (96.5%) | 443 (100.0%) |
| 25 to 34 Years | 271 (83.1%) | 445 (63.4%) |
| 35 to 44 Years | 713 (90.6%) | 237 (46.0%) |
| 45 to 54 Years | 375 (93.8%) | 380 (89.2%) |
| 55 to 64 Years | 344 (86.7%) | 346 (65.8%) |
| 65 to 74 Years | 246 (98.0%) | 278 (85.5%) |
| 75 Years and over | 244 (81.1%) | 364 (66.2%) |
| Total | 3,353 (86.3%) | 3,206 (72.4%) |
Income Below Poverty Among Married-Couple Families in Wharton
The poverty statistics for married-couple families in Wharton show that 10.9% or 116 of the total 1,063 families live below the poverty line. Families with 3 or 4 children have the highest poverty rate of 40.1%, comprising of 63 families. On the other hand, families with 1 or 2 children have the lowest poverty rate of 3.2%, which includes 9 families.
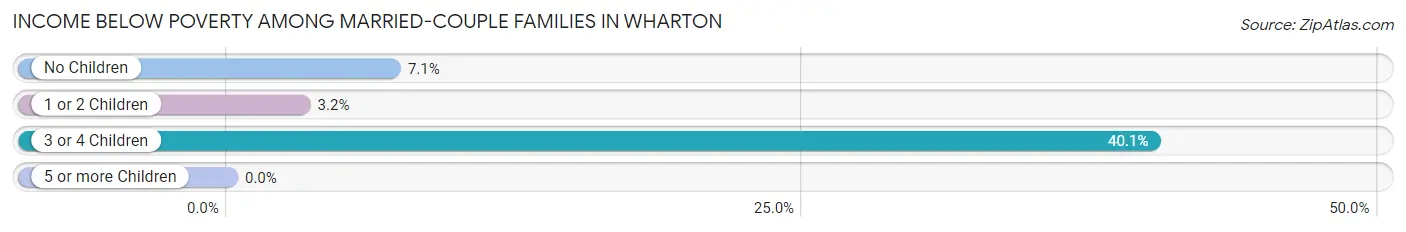
| Children | Above Poverty | Below Poverty |
| No Children | 577 (92.9%) | 44 (7.1%) |
| 1 or 2 Children | 276 (96.8%) | 9 (3.2%) |
| 3 or 4 Children | 94 (59.9%) | 63 (40.1%) |
| 5 or more Children | 0 (0.0%) | 0 (0.0%) |
| Total | 947 (89.1%) | 116 (10.9%) |
Income Below Poverty Among Single-Parent Households in Wharton
According to the poverty data in Wharton, 5.4% or 13 single-father households and 25.1% or 140 single-mother households are living below the poverty line. Among single-father households, those with no children have the highest poverty rate, with 13 households (20.6%) experiencing poverty. Likewise, among single-mother households, those with 3 or 4 children have the highest poverty rate, with 8 households (100.0%) falling below the poverty line.
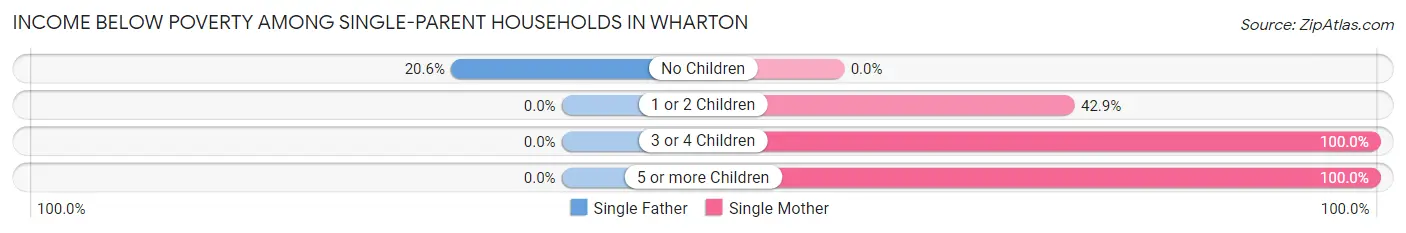
| Children | Single Father | Single Mother |
| No Children | 13 (20.6%) | 0 (0.0%) |
| 1 or 2 Children | 0 (0.0%) | 127 (42.9%) |
| 3 or 4 Children | 0 (0.0%) | 8 (100.0%) |
| 5 or more Children | 0 (0.0%) | 5 (100.0%) |
| Total | 13 (5.4%) | 140 (25.1%) |
Income Below Poverty Among Married-Couple vs Single-Parent Households in Wharton
The poverty data for Wharton shows that 116 of the married-couple family households (10.9%) and 153 of the single-parent households (19.2%) are living below the poverty level. Within the married-couple family households, those with 3 or 4 children have the highest poverty rate, with 63 households (40.1%) falling below the poverty line. Among the single-parent households, those with 5 or more children have the highest poverty rate, with 5 household (100.0%) living below poverty.
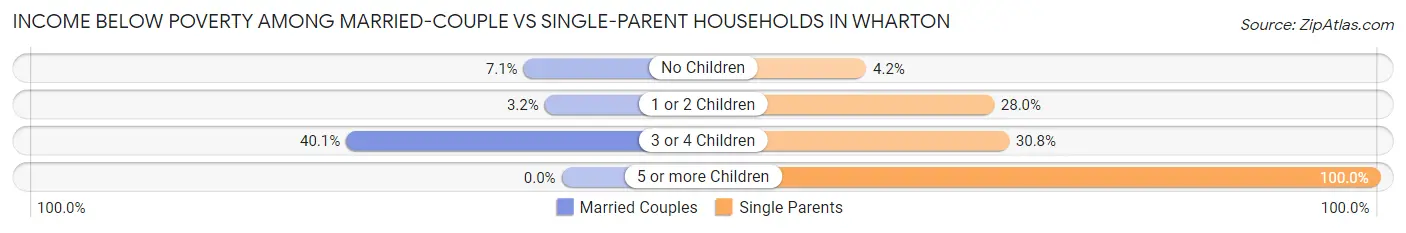
| Children | Married-Couple Families | Single-Parent Households |
| No Children | 44 (7.1%) | 13 (4.2%) |
| 1 or 2 Children | 9 (3.2%) | 127 (28.0%) |
| 3 or 4 Children | 63 (40.1%) | 8 (30.8%) |
| 5 or more Children | 0 (0.0%) | 5 (100.0%) |
| Total | 116 (10.9%) | 153 (19.2%) |
Race in Wharton
The most populous races in Wharton are White / Caucasian (4,656 | 53.7%), Hispanic or Latino (3,781 | 43.6%), and Black / African American (2,530 | 29.2%).
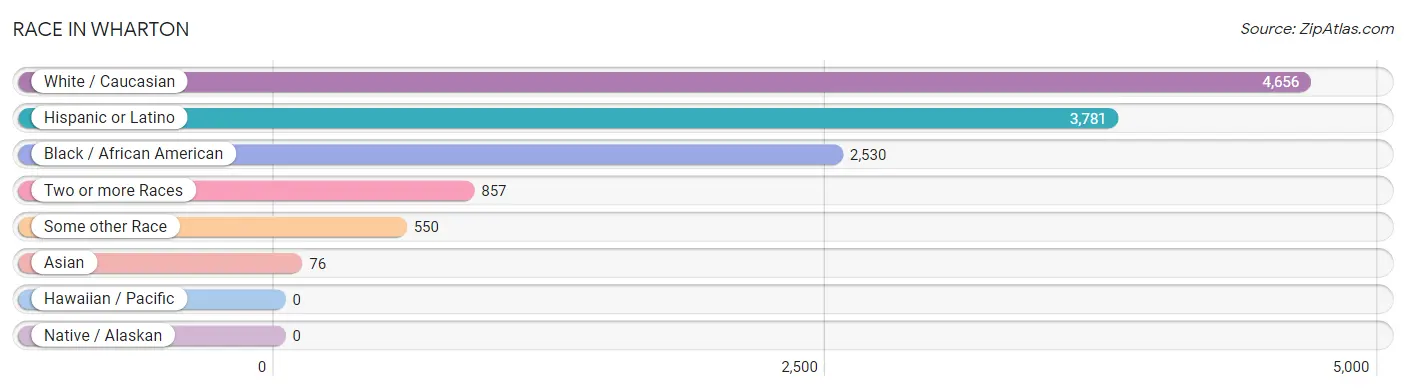
| Race | # Population | % Population |
| Asian | 76 | 0.9% |
| Black / African American | 2,530 | 29.2% |
| Hawaiian / Pacific | 0 | 0.0% |
| Hispanic or Latino | 3,781 | 43.6% |
| Native / Alaskan | 0 | 0.0% |
| White / Caucasian | 4,656 | 53.7% |
| Two or more Races | 857 | 9.9% |
| Some other Race | 550 | 6.3% |
| Total | 8,669 | 100.0% |
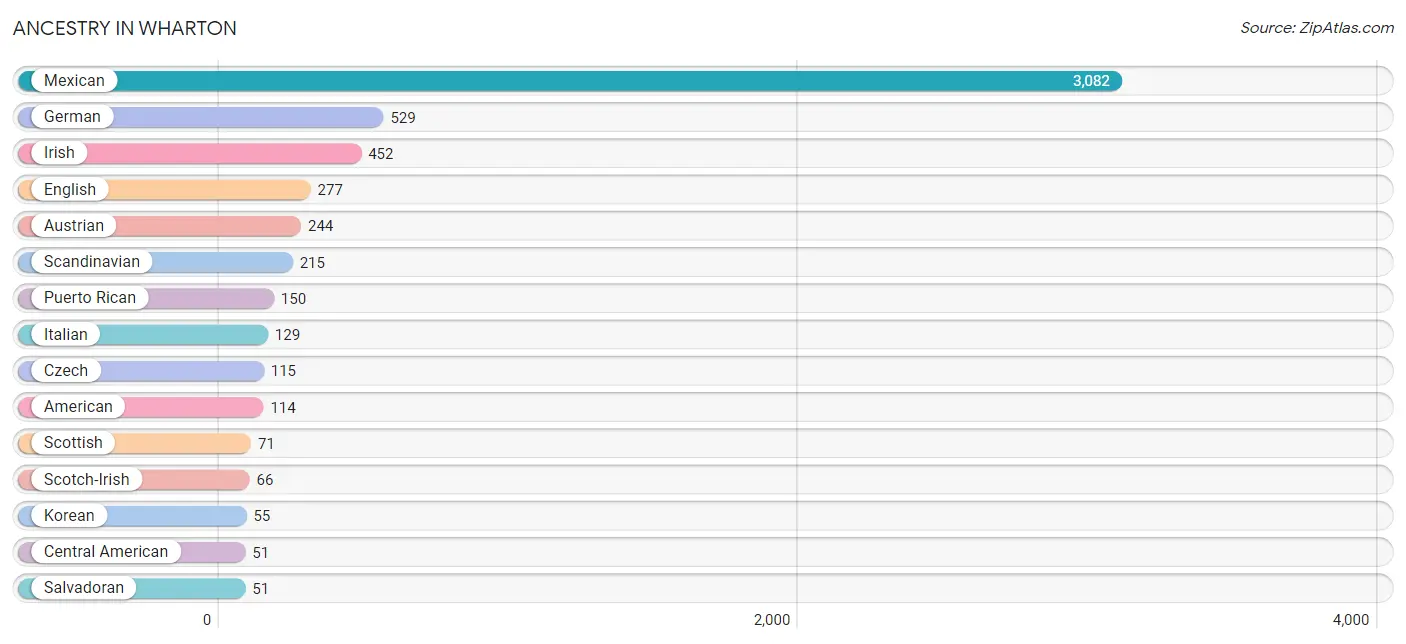
Ancestry in Wharton
The most populous ancestries reported in Wharton are Mexican (3,082 | 35.5%), German (529 | 6.1%), Irish (452 | 5.2%), English (277 | 3.2%), and Austrian (244 | 2.8%), together accounting for 52.9% of all Wharton residents.
| Ancestry | # Population | % Population |
| African | 2 | 0.0% |
| American | 114 | 1.3% |
| Apache | 16 | 0.2% |
| Arab | 28 | 0.3% |
| Arapaho | 7 | 0.1% |
| Austrian | 244 | 2.8% |
| Burmese | 18 | 0.2% |
| Cajun | 15 | 0.2% |
| Central American | 51 | 0.6% |
| Cherokee | 6 | 0.1% |
| Colombian | 8 | 0.1% |
| Czech | 115 | 1.3% |
| Danish | 3 | 0.0% |
| Dutch | 10 | 0.1% |
| English | 277 | 3.2% |
| European | 25 | 0.3% |
| French | 24 | 0.3% |
| French Canadian | 9 | 0.1% |
| German | 529 | 6.1% |
| Indian (Asian) | 27 | 0.3% |
| Irish | 452 | 5.2% |
| Italian | 129 | 1.5% |
| Korean | 55 | 0.6% |
| Lithuanian | 18 | 0.2% |
| Mexican | 3,082 | 35.5% |
| Norwegian | 15 | 0.2% |
| Palestinian | 28 | 0.3% |
| Polish | 40 | 0.5% |
| Puerto Rican | 150 | 1.7% |
| Romanian | 50 | 0.6% |
| Salvadoran | 51 | 0.6% |
| Scandinavian | 215 | 2.5% |
| Scotch-Irish | 66 | 0.8% |
| Scottish | 71 | 0.8% |
| South American | 8 | 0.1% |
| Spaniard | 28 | 0.3% |
| Spanish | 35 | 0.4% |
| Sri Lankan | 19 | 0.2% |
| Subsaharan African | 3 | 0.0% |
| Thai | 22 | 0.3% |
| Welsh | 23 | 0.3% | View All 41 Rows |
Immigrants in Wharton
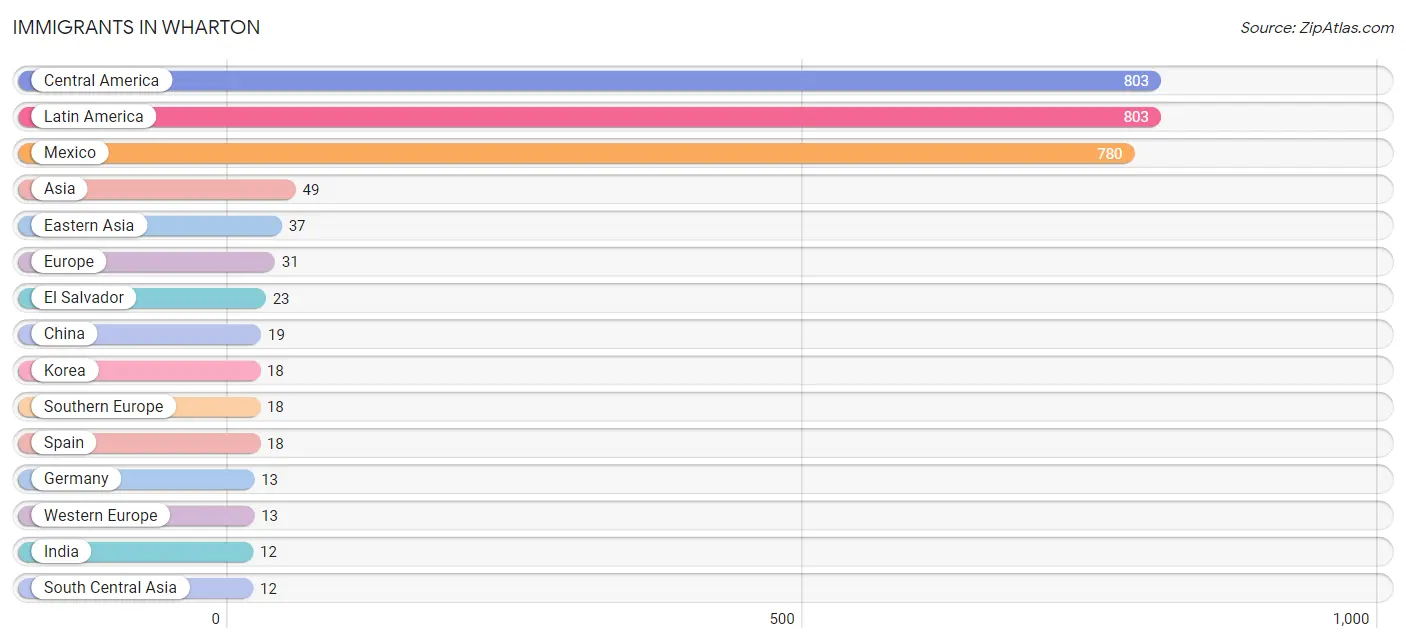
The most numerous immigrant groups reported in Wharton came from Central America (803 | 9.3%), Latin America (803 | 9.3%), Mexico (780 | 9.0%), Asia (49 | 0.6%), and Eastern Asia (37 | 0.4%), together accounting for 28.5% of all Wharton residents.
| Immigration Origin | # Population | % Population |
| Africa | 1 | 0.0% |
| Asia | 49 | 0.6% |
| Cameroon | 1 | 0.0% |
| Central America | 803 | 9.3% |
| China | 19 | 0.2% |
| Eastern Asia | 37 | 0.4% |
| El Salvador | 23 | 0.3% |
| Europe | 31 | 0.4% |
| Germany | 13 | 0.2% |
| Hong Kong | 7 | 0.1% |
| India | 12 | 0.1% |
| Korea | 18 | 0.2% |
| Latin America | 803 | 9.3% |
| Mexico | 780 | 9.0% |
| Middle Africa | 1 | 0.0% |
| South Central Asia | 12 | 0.1% |
| Southern Europe | 18 | 0.2% |
| Spain | 18 | 0.2% |
| Western Europe | 13 | 0.2% | View All 19 Rows |
Sex and Age in Wharton
Sex and Age in Wharton
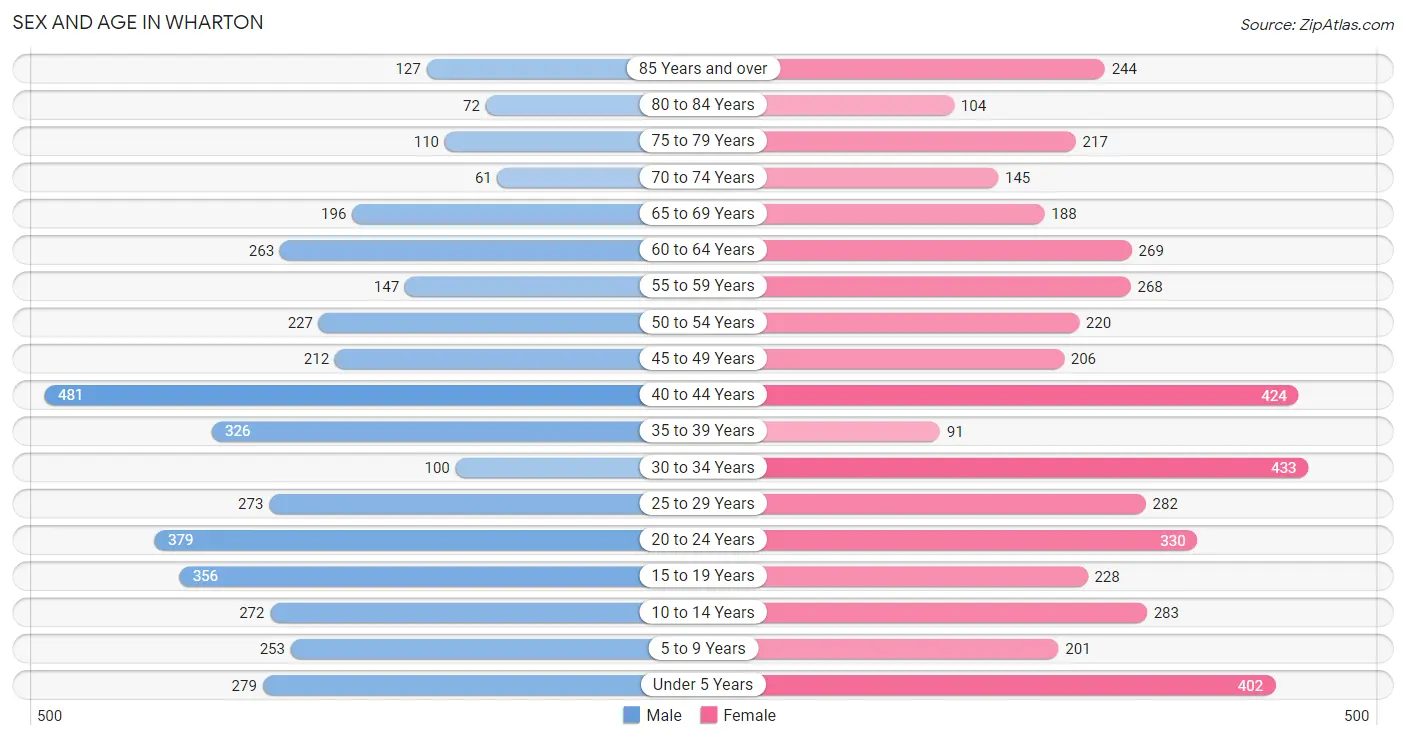
The most populous age groups in Wharton are 40 to 44 Years (481 | 11.6%) for men and 30 to 34 Years (433 | 9.6%) for women.
| Age Bracket | Male | Female |
| Under 5 Years | 279 (6.8%) | 402 (8.9%) |
| 5 to 9 Years | 253 (6.1%) | 201 (4.4%) |
| 10 to 14 Years | 272 (6.6%) | 283 (6.2%) |
| 15 to 19 Years | 356 (8.6%) | 228 (5.0%) |
| 20 to 24 Years | 379 (9.2%) | 330 (7.3%) |
| 25 to 29 Years | 273 (6.6%) | 282 (6.2%) |
| 30 to 34 Years | 100 (2.4%) | 433 (9.6%) |
| 35 to 39 Years | 326 (7.9%) | 91 (2.0%) |
| 40 to 44 Years | 481 (11.6%) | 424 (9.3%) |
| 45 to 49 Years | 212 (5.1%) | 206 (4.5%) |
| 50 to 54 Years | 227 (5.5%) | 220 (4.9%) |
| 55 to 59 Years | 147 (3.6%) | 268 (5.9%) |
| 60 to 64 Years | 263 (6.4%) | 269 (5.9%) |
| 65 to 69 Years | 196 (4.7%) | 188 (4.2%) |
| 70 to 74 Years | 61 (1.5%) | 145 (3.2%) |
| 75 to 79 Years | 110 (2.7%) | 217 (4.8%) |
| 80 to 84 Years | 72 (1.7%) | 104 (2.3%) |
| 85 Years and over | 127 (3.1%) | 244 (5.4%) |
| Total | 4,134 (100.0%) | 4,535 (100.0%) |
Families and Households in Wharton
Median Family Size in Wharton
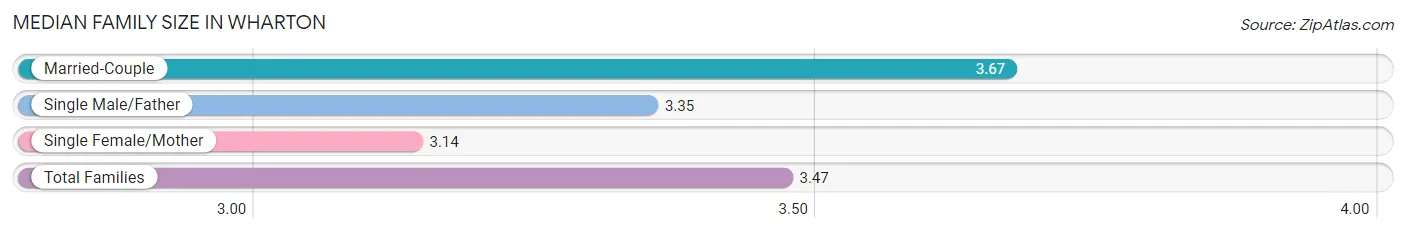
The median family size in Wharton is 3.47 persons per family, with married-couple families (1,063 | 57.2%) accounting for the largest median family size of 3.67 persons per family. On the other hand, single female/mother families (557 | 30.0%) represent the smallest median family size with 3.14 persons per family.
| Family Type | # Families | Family Size |
| Married-Couple | 1,063 (57.2%) | 3.67 |
| Single Male/Father | 239 (12.9%) | 3.35 |
| Single Female/Mother | 557 (30.0%) | 3.14 |
| Total Families | 1,859 (100.0%) | 3.47 |
Median Household Size in Wharton
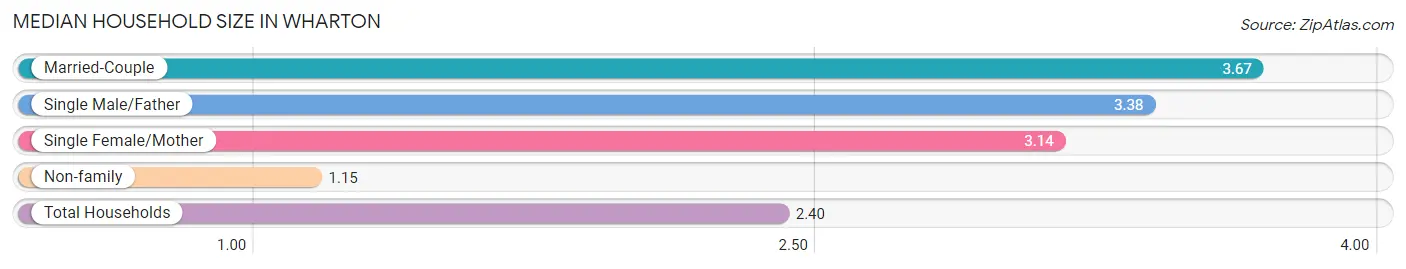
The median household size in Wharton is 2.40 persons per household, with married-couple households (1,063 | 30.7%) accounting for the largest median household size of 3.67 persons per household. non-family households (1,607 | 46.4%) represent the smallest median household size with 1.15 persons per household.
| Household Type | # Households | Household Size |
| Married-Couple | 1,063 (30.7%) | 3.67 |
| Single Male/Father | 239 (6.9%) | 3.38 |
| Single Female/Mother | 557 (16.1%) | 3.14 |
| Non-family | 1,607 (46.4%) | 1.15 |
| Total Households | 3,466 (100.0%) | 2.40 |
Household Size by Marriage Status in Wharton
Out of a total of 3,466 households in Wharton, 1,859 (53.6%) are family households, while 1,607 (46.4%) are nonfamily households. The most numerous type of family households are 2-person households, comprising 697, and the most common type of nonfamily households are 1-person households, comprising 1,428.
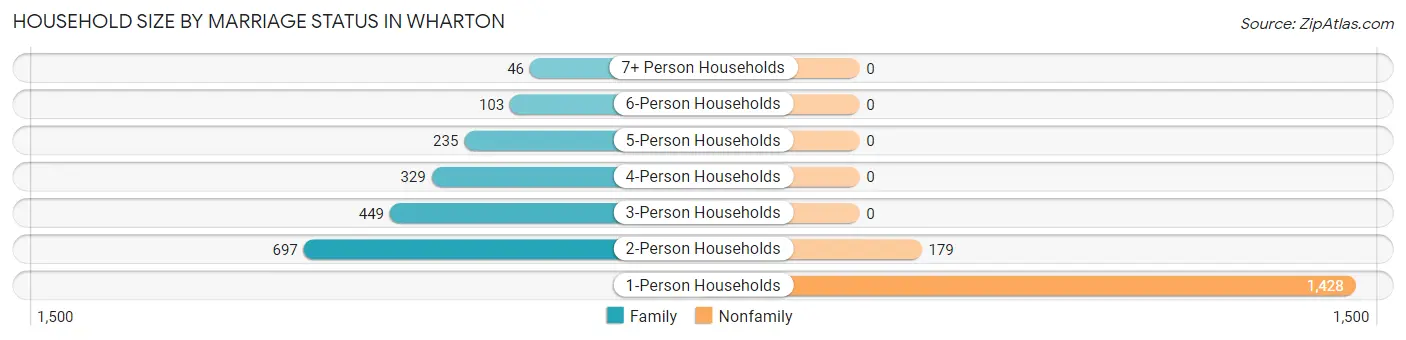
| Household Size | Family Households | Nonfamily Households |
| 1-Person Households | - | 1,428 (41.2%) |
| 2-Person Households | 697 (20.1%) | 179 (5.2%) |
| 3-Person Households | 449 (13.0%) | 0 (0.0%) |
| 4-Person Households | 329 (9.5%) | 0 (0.0%) |
| 5-Person Households | 235 (6.8%) | 0 (0.0%) |
| 6-Person Households | 103 (3.0%) | 0 (0.0%) |
| 7+ Person Households | 46 (1.3%) | 0 (0.0%) |
| Total | 1,859 (53.6%) | 1,607 (46.4%) |
Female Fertility in Wharton
Fertility by Age in Wharton
Average fertility rate in Wharton is 83.0 births per 1,000 women. Women in the age bracket of 20 to 34 years have the highest fertility rate with 162.0 births per 1,000 women. Women in the age bracket of 20 to 34 years acount for 100.0% of all women with births.
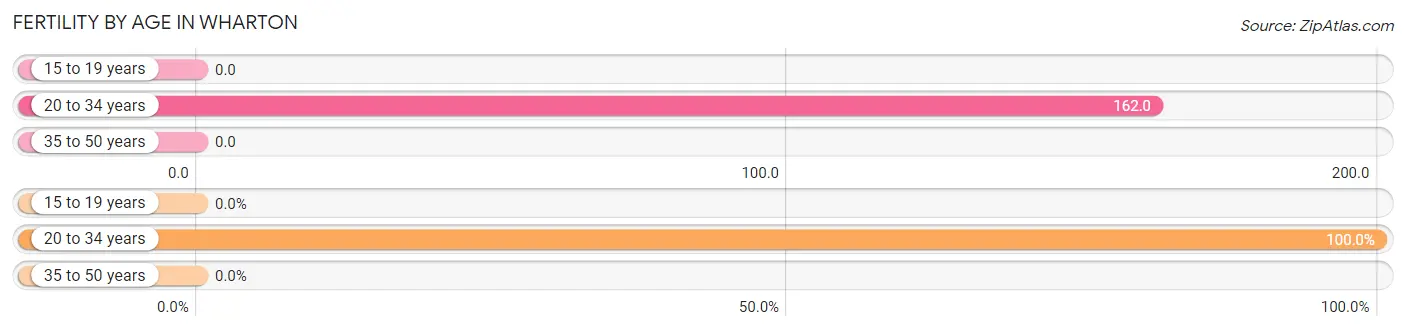
| Age Bracket | Women with Births | Births / 1,000 Women |
| 15 to 19 years | 0 (0.0%) | 0.0 |
| 20 to 34 years | 169 (100.0%) | 162.0 |
| 35 to 50 years | 0 (0.0%) | 0.0 |
| Total | 169 (100.0%) | 83.0 |
Fertility by Age by Marriage Status in Wharton
75.7% of women with births (169) in Wharton are married. The highest percentage of unmarried women with births falls into 20 to 34 years age bracket with 24.3% of them unmarried at the time of birth, while the lowest percentage of unmarried women with births belong to 20 to 34 years age bracket with 24.3% of them unmarried.
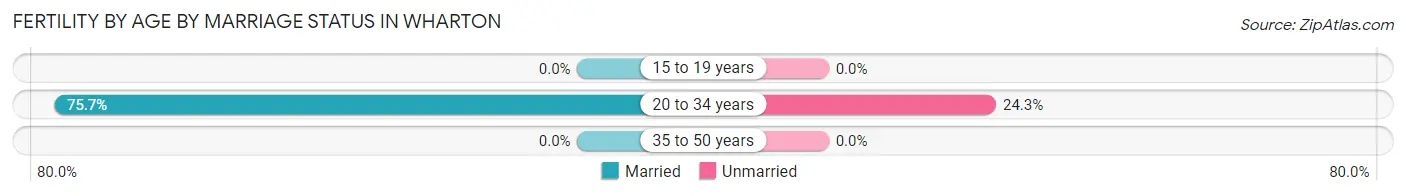
| Age Bracket | Married | Unmarried |
| 15 to 19 years | 0 (0.0%) | 0 (0.0%) |
| 20 to 34 years | 128 (75.7%) | 41 (24.3%) |
| 35 to 50 years | 0 (0.0%) | 0 (0.0%) |
| Total | 128 (75.7%) | 41 (24.3%) |
Fertility by Education in Wharton
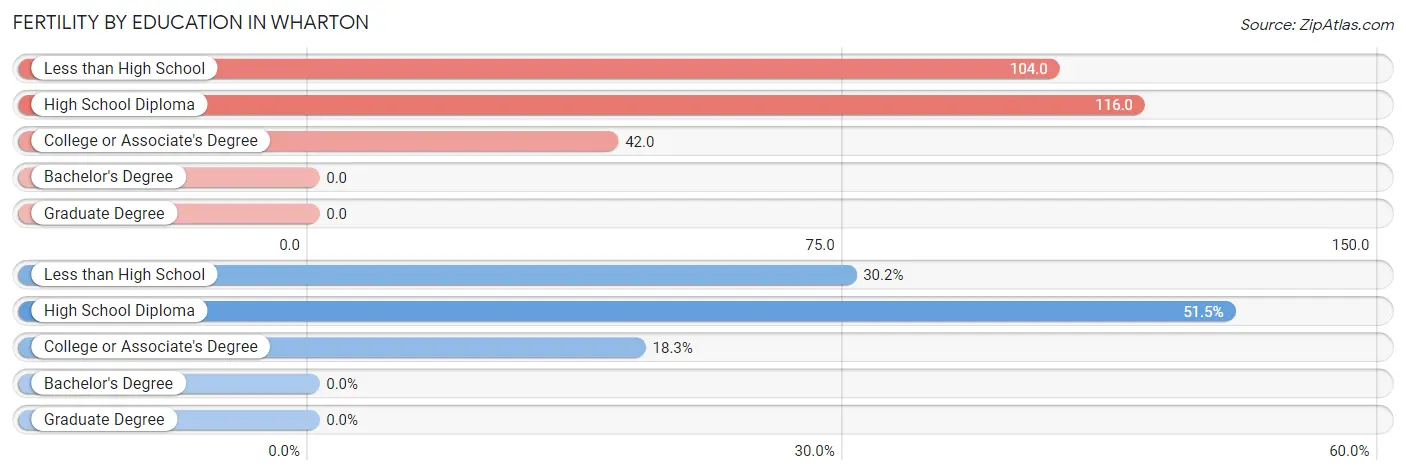
| Educational Attainment | Women with Births | Births / 1,000 Women |
| Less than High School | 51 (30.2%) | 104.0 |
| High School Diploma | 87 (51.5%) | 116.0 |
| College or Associate's Degree | 31 (18.3%) | 42.0 |
| Bachelor's Degree | 0 (0.0%) | 0.0 |
| Graduate Degree | 0 (0.0%) | 0.0 |
| Total | 169 (100.0%) | 83.0 |
Fertility by Education by Marriage Status in Wharton
24.3% of women with births in Wharton are unmarried. Women with the educational attainment of less than high school are most likely to be married with 94.1% of them married at childbirth, while women with the educational attainment of college or associate's degree are least likely to be married with 100.0% of them unmarried at childbirth.
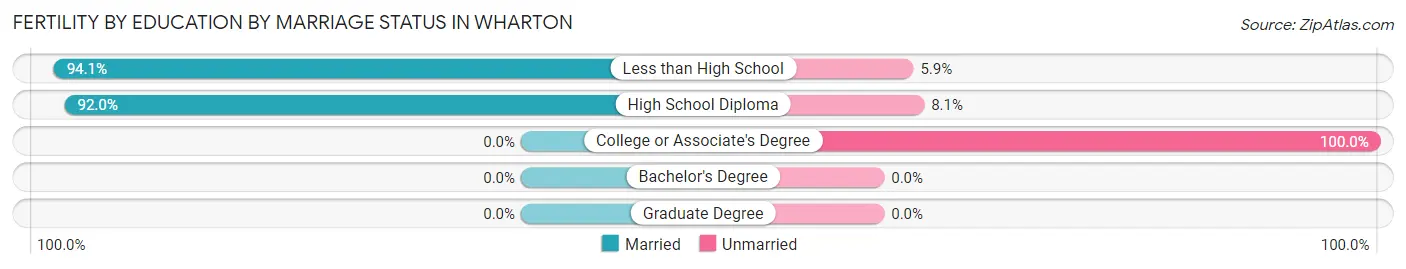
| Educational Attainment | Married | Unmarried |
| Less than High School | 48 (94.1%) | 3 (5.9%) |
| High School Diploma | 80 (91.9%) | 7 (8.1%) |
| College or Associate's Degree | 0 (0.0%) | 31 (100.0%) |
| Bachelor's Degree | 0 (0.0%) | 0 (0.0%) |
| Graduate Degree | 0 (0.0%) | 0 (0.0%) |
| Total | 128 (75.7%) | 41 (24.3%) |
Employment Characteristics in Wharton
Employment by Class of Employer in Wharton
Among the 3,789 employed individuals in Wharton, private company employees (2,704 | 71.4%), local government employees (375 | 9.9%), and self-employed (not incorporated) (255 | 6.7%) make up the most common classes of employment.
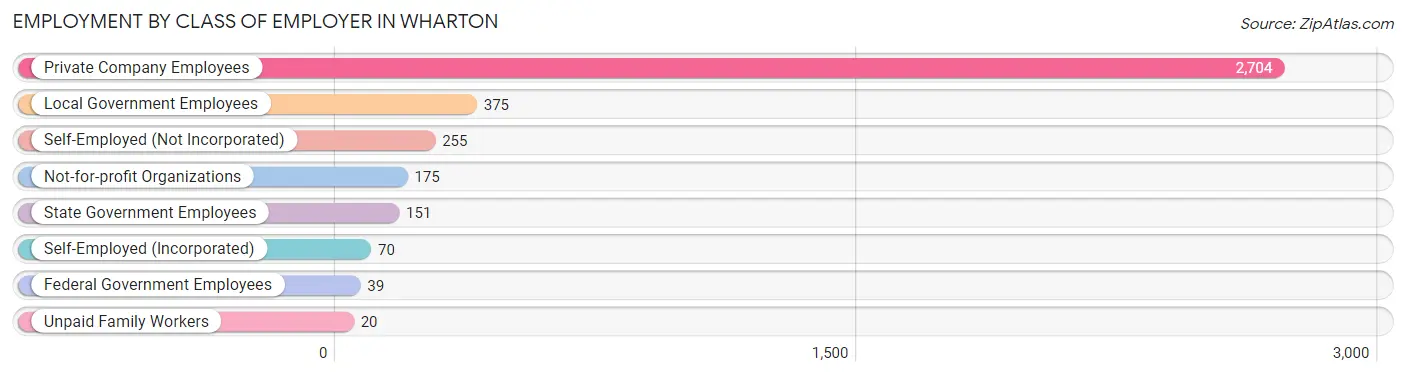
| Employer Class | # Employees | % Employees |
| Private Company Employees | 2,704 | 71.4% |
| Self-Employed (Incorporated) | 70 | 1.8% |
| Self-Employed (Not Incorporated) | 255 | 6.7% |
| Not-for-profit Organizations | 175 | 4.6% |
| Local Government Employees | 375 | 9.9% |
| State Government Employees | 151 | 4.0% |
| Federal Government Employees | 39 | 1.0% |
| Unpaid Family Workers | 20 | 0.5% |
| Total | 3,789 | 100.0% |
Employment Status by Age in Wharton
According to the labor force statistics for Wharton, out of the total population over 16 years of age (6,924), 57.8% or 4,002 individuals are in the labor force, with 4.9% or 196 of them unemployed. The age group with the highest labor force participation rate is 45 to 54 years, with 80.7% or 698 individuals in the labor force. Within the labor force, the 55 to 59 years age range has the highest percentage of unemployed individuals, with 17.5% or 46 of them being unemployed.
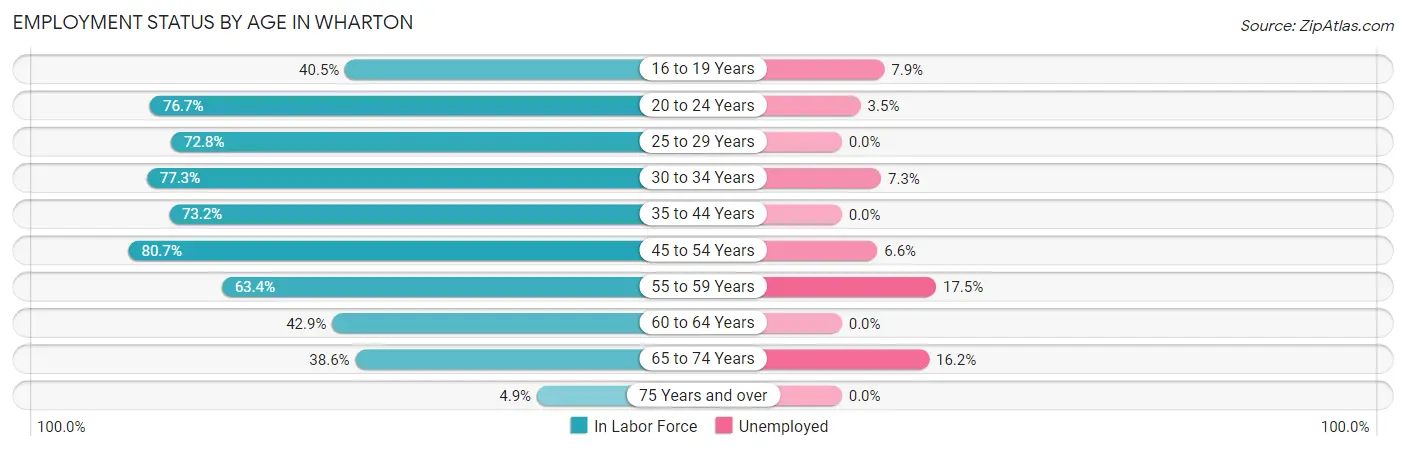
| Age Bracket | In Labor Force | Unemployed |
| 16 to 19 Years | 214 (40.5%) | 17 (7.9%) |
| 20 to 24 Years | 544 (76.7%) | 19 (3.5%) |
| 25 to 29 Years | 404 (72.8%) | 0 (0.0%) |
| 30 to 34 Years | 412 (77.3%) | 30 (7.3%) |
| 35 to 44 Years | 968 (73.2%) | 0 (0.0%) |
| 45 to 54 Years | 698 (80.7%) | 46 (6.6%) |
| 55 to 59 Years | 263 (63.4%) | 46 (17.5%) |
| 60 to 64 Years | 228 (42.9%) | 0 (0.0%) |
| 65 to 74 Years | 228 (38.6%) | 37 (16.2%) |
| 75 Years and over | 43 (4.9%) | 0 (0.0%) |
| Total | 4,002 (57.8%) | 196 (4.9%) |
Employment Status by Educational Attainment in Wharton
According to labor force statistics for Wharton, 70.4% of individuals (2,972) out of the total population between 25 and 64 years of age (4,222) are in the labor force, with 4.1% or 122 of them being unemployed. The group with the highest labor force participation rate are those with the educational attainment of bachelor's degree or higher, with 77.5% or 368 individuals in the labor force. Within the labor force, individuals with high school diploma education have the highest percentage of unemployment, with 10.8% or 104 of them being unemployed.
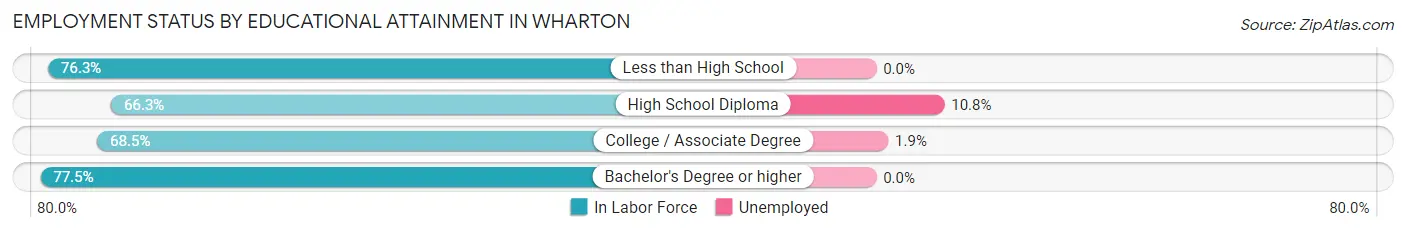
| Educational Attainment | In Labor Force | Unemployed |
| Less than High School | 691 (76.3%) | 0 (0.0%) |
| High School Diploma | 963 (66.3%) | 157 (10.8%) |
| College / Associate Degree | 951 (68.5%) | 26 (1.9%) |
| Bachelor's Degree or higher | 368 (77.5%) | 0 (0.0%) |
| Total | 2,972 (70.4%) | 173 (4.1%) |
Employment Occupations by Sex in Wharton
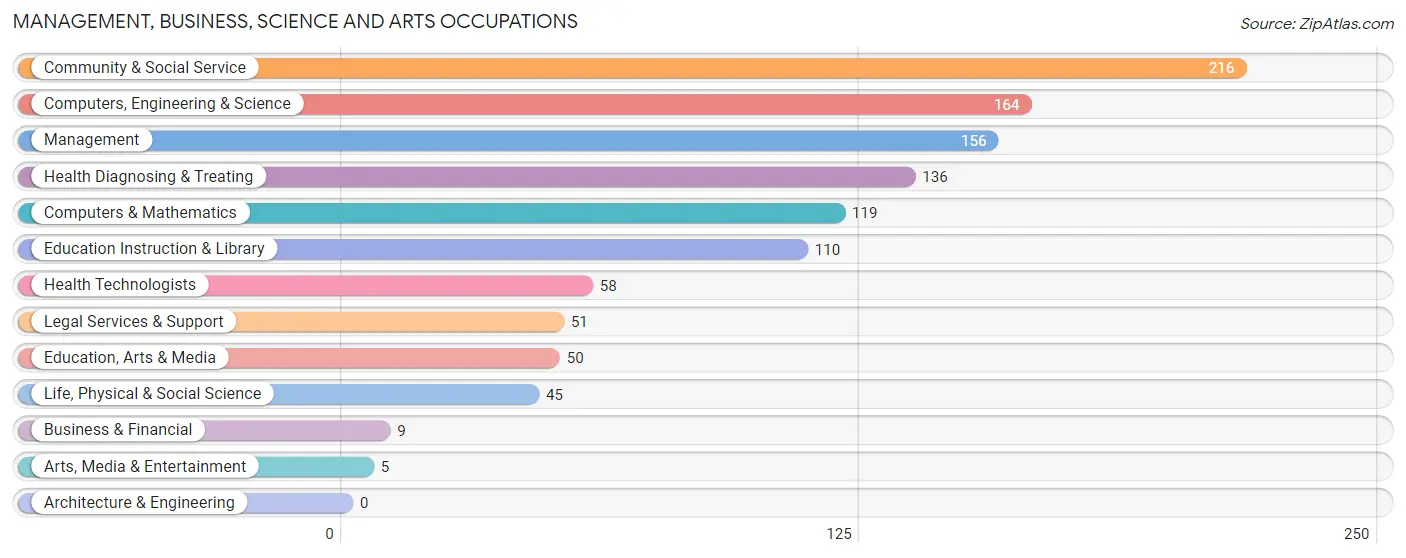
Management, Business, Science and Arts Occupations
The most common Management, Business, Science and Arts occupations in Wharton are Community & Social Service (216 | 5.7%), Computers, Engineering & Science (164 | 4.3%), Management (156 | 4.1%), Health Diagnosing & Treating (136 | 3.6%), and Computers & Mathematics (119 | 3.1%).
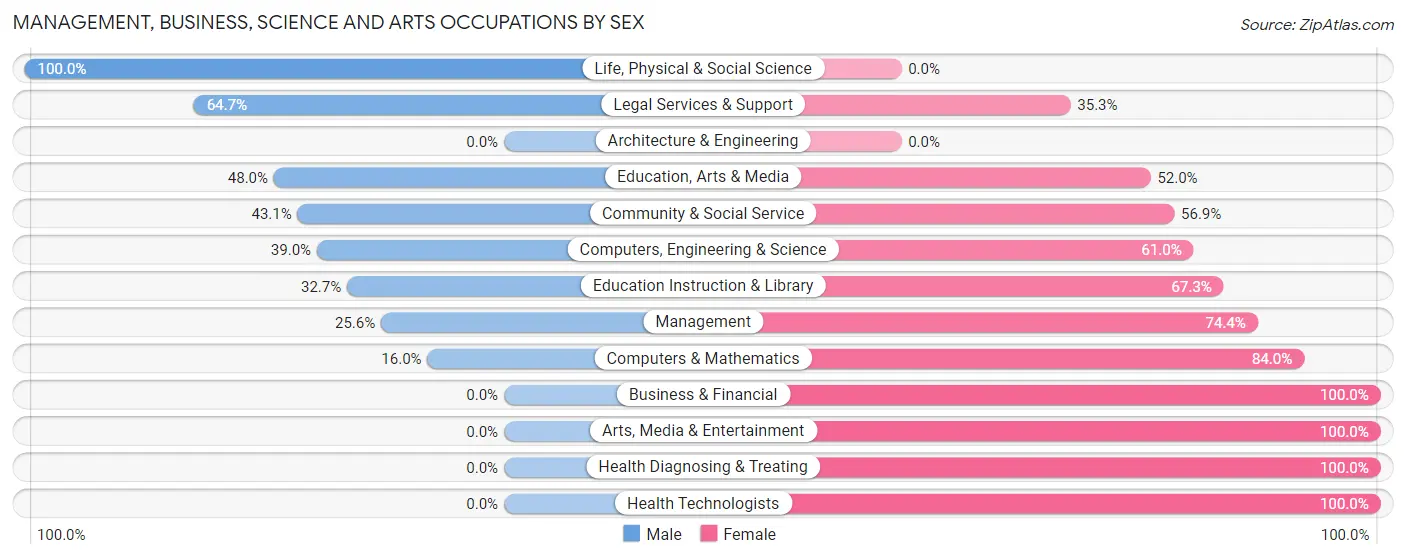
Management, Business, Science and Arts Occupations by Sex
Within the Management, Business, Science and Arts occupations in Wharton, the most male-oriented occupations are Life, Physical & Social Science (100.0%), Legal Services & Support (64.7%), and Education, Arts & Media (48.0%), while the most female-oriented occupations are Business & Financial (100.0%), Arts, Media & Entertainment (100.0%), and Health Diagnosing & Treating (100.0%).
| Occupation | Male | Female |
| Management | 40 (25.6%) | 116 (74.4%) |
| Business & Financial | 0 (0.0%) | 9 (100.0%) |
| Computers, Engineering & Science | 64 (39.0%) | 100 (61.0%) |
| Computers & Mathematics | 19 (16.0%) | 100 (84.0%) |
| Architecture & Engineering | 0 (0.0%) | 0 (0.0%) |
| Life, Physical & Social Science | 45 (100.0%) | 0 (0.0%) |
| Community & Social Service | 93 (43.1%) | 123 (56.9%) |
| Education, Arts & Media | 24 (48.0%) | 26 (52.0%) |
| Legal Services & Support | 33 (64.7%) | 18 (35.3%) |
| Education Instruction & Library | 36 (32.7%) | 74 (67.3%) |
| Arts, Media & Entertainment | 0 (0.0%) | 5 (100.0%) |
| Health Diagnosing & Treating | 0 (0.0%) | 136 (100.0%) |
| Health Technologists | 0 (0.0%) | 58 (100.0%) |
| Total (Category) | 197 (28.9%) | 484 (71.1%) |
| Total (Overall) | 1,916 (50.3%) | 1,891 (49.7%) |
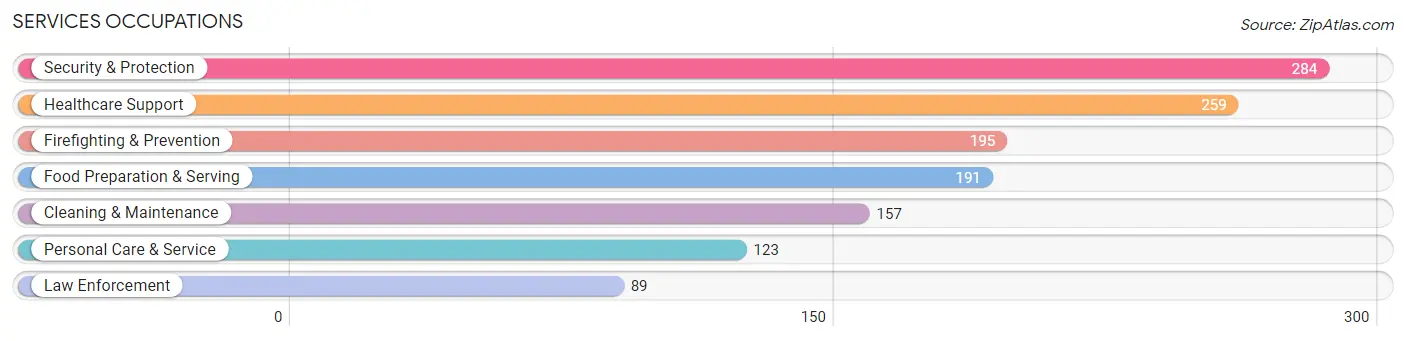
Services Occupations
The most common Services occupations in Wharton are Security & Protection (284 | 7.5%), Healthcare Support (259 | 6.8%), Firefighting & Prevention (195 | 5.1%), Food Preparation & Serving (191 | 5.0%), and Cleaning & Maintenance (157 | 4.1%).
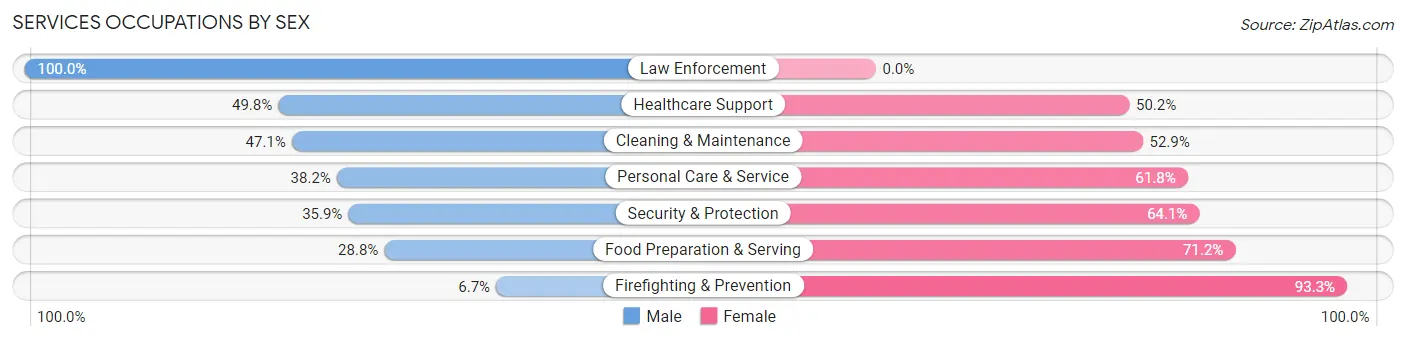
Services Occupations by Sex
Within the Services occupations in Wharton, the most male-oriented occupations are Law Enforcement (100.0%), Healthcare Support (49.8%), and Cleaning & Maintenance (47.1%), while the most female-oriented occupations are Firefighting & Prevention (93.3%), Food Preparation & Serving (71.2%), and Security & Protection (64.1%).
| Occupation | Male | Female |
| Healthcare Support | 129 (49.8%) | 130 (50.2%) |
| Security & Protection | 102 (35.9%) | 182 (64.1%) |
| Firefighting & Prevention | 13 (6.7%) | 182 (93.3%) |
| Law Enforcement | 89 (100.0%) | 0 (0.0%) |
| Food Preparation & Serving | 55 (28.8%) | 136 (71.2%) |
| Cleaning & Maintenance | 74 (47.1%) | 83 (52.9%) |
| Personal Care & Service | 47 (38.2%) | 76 (61.8%) |
| Total (Category) | 407 (40.1%) | 607 (59.9%) |
| Total (Overall) | 1,916 (50.3%) | 1,891 (49.7%) |
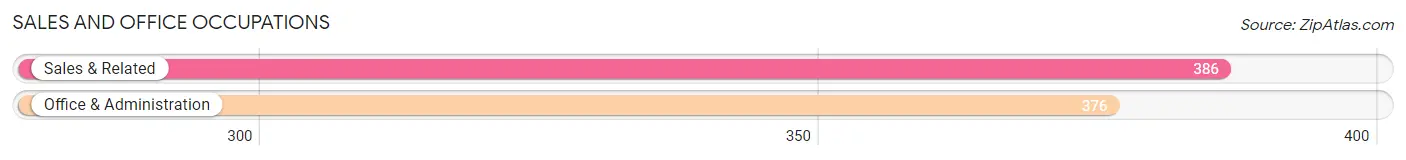
Sales and Office Occupations
The most common Sales and Office occupations in Wharton are Sales & Related (386 | 10.1%), and Office & Administration (376 | 9.9%).
Sales and Office Occupations by Sex
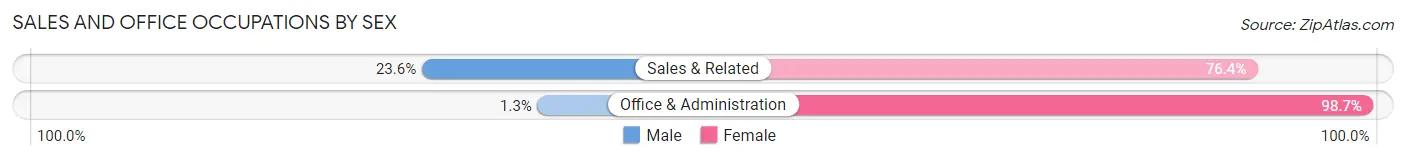
| Occupation | Male | Female |
| Sales & Related | 91 (23.6%) | 295 (76.4%) |
| Office & Administration | 5 (1.3%) | 371 (98.7%) |
| Total (Category) | 96 (12.6%) | 666 (87.4%) |
| Total (Overall) | 1,916 (50.3%) | 1,891 (49.7%) |
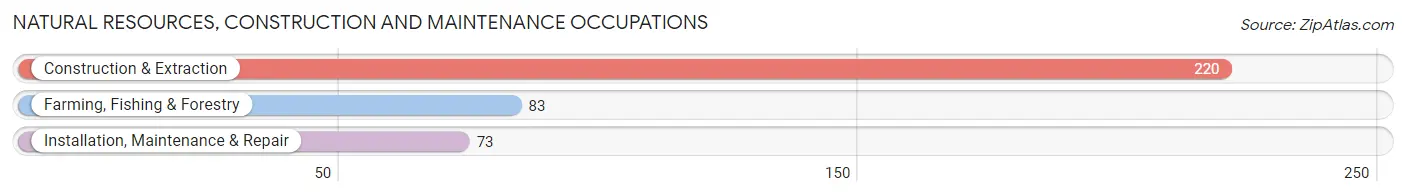
Natural Resources, Construction and Maintenance Occupations
The most common Natural Resources, Construction and Maintenance occupations in Wharton are Construction & Extraction (220 | 5.8%), Farming, Fishing & Forestry (83 | 2.2%), and Installation, Maintenance & Repair (73 | 1.9%).
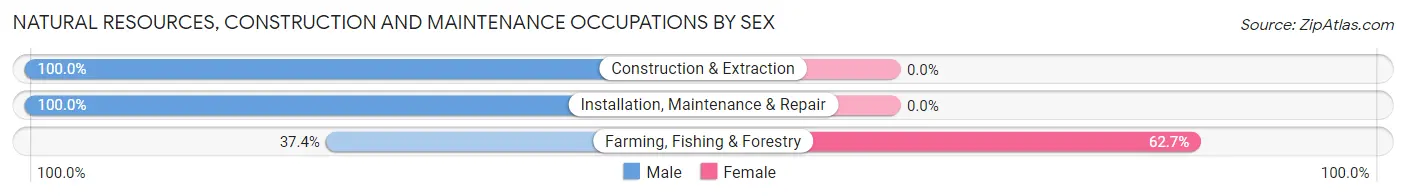
Natural Resources, Construction and Maintenance Occupations by Sex
| Occupation | Male | Female |
| Farming, Fishing & Forestry | 31 (37.3%) | 52 (62.6%) |
| Construction & Extraction | 220 (100.0%) | 0 (0.0%) |
| Installation, Maintenance & Repair | 73 (100.0%) | 0 (0.0%) |
| Total (Category) | 324 (86.2%) | 52 (13.8%) |
| Total (Overall) | 1,916 (50.3%) | 1,891 (49.7%) |
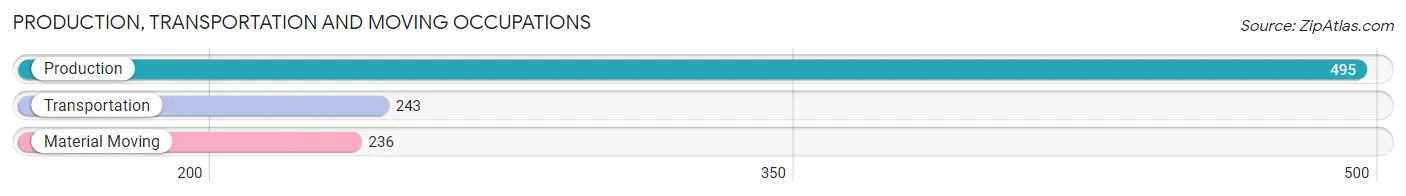
Production, Transportation and Moving Occupations
The most common Production, Transportation and Moving occupations in Wharton are Production (495 | 13.0%), Transportation (243 | 6.4%), and Material Moving (236 | 6.2%).
Production, Transportation and Moving Occupations by Sex
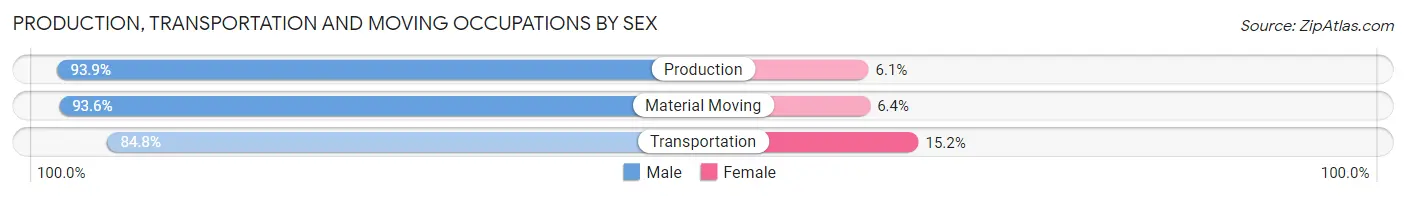
| Occupation | Male | Female |
| Production | 465 (93.9%) | 30 (6.1%) |
| Transportation | 206 (84.8%) | 37 (15.2%) |
| Material Moving | 221 (93.6%) | 15 (6.4%) |
| Total (Category) | 892 (91.6%) | 82 (8.4%) |
| Total (Overall) | 1,916 (50.3%) | 1,891 (49.7%) |
Employment Industries by Sex in Wharton
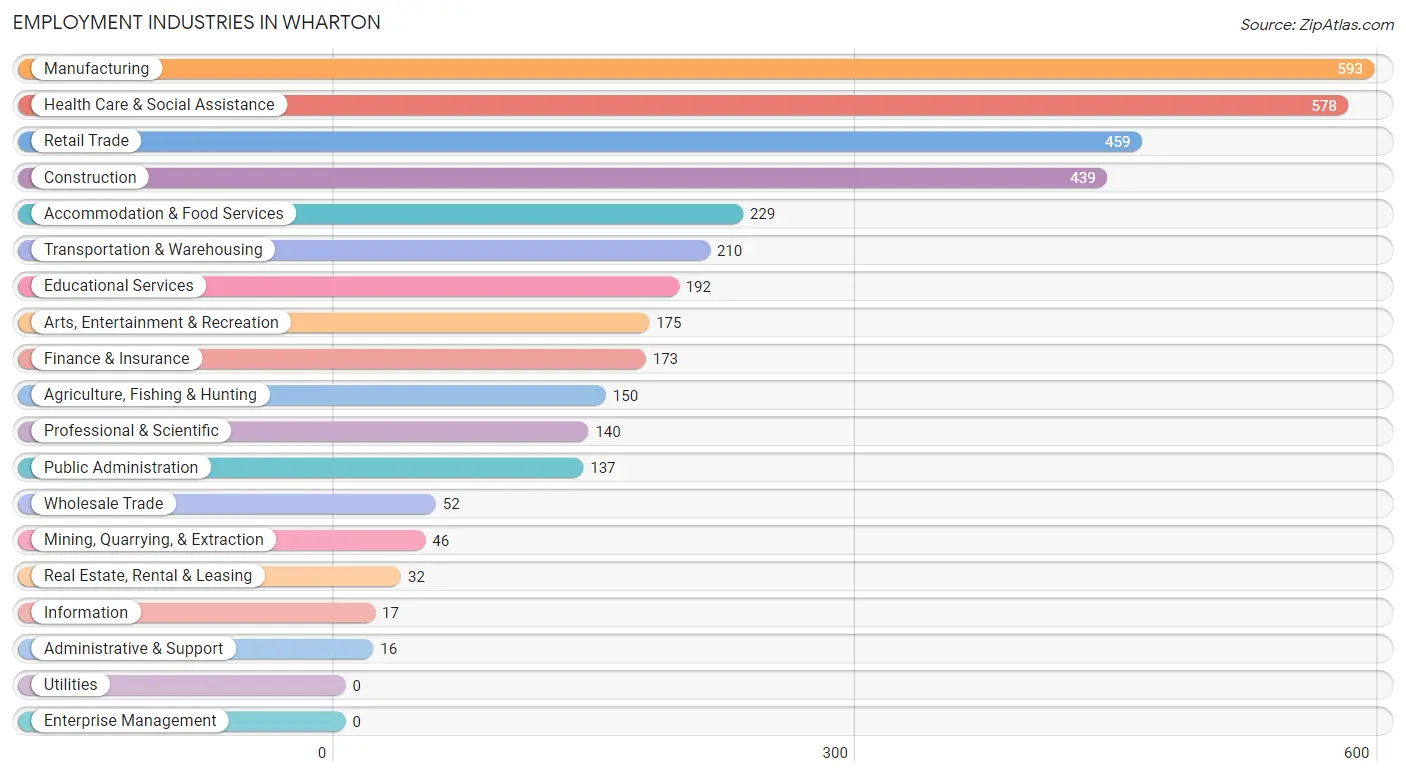
Employment Industries in Wharton
The major employment industries in Wharton include Manufacturing (593 | 15.6%), Health Care & Social Assistance (578 | 15.2%), Retail Trade (459 | 12.1%), Construction (439 | 11.5%), and Accommodation & Food Services (229 | 6.0%).
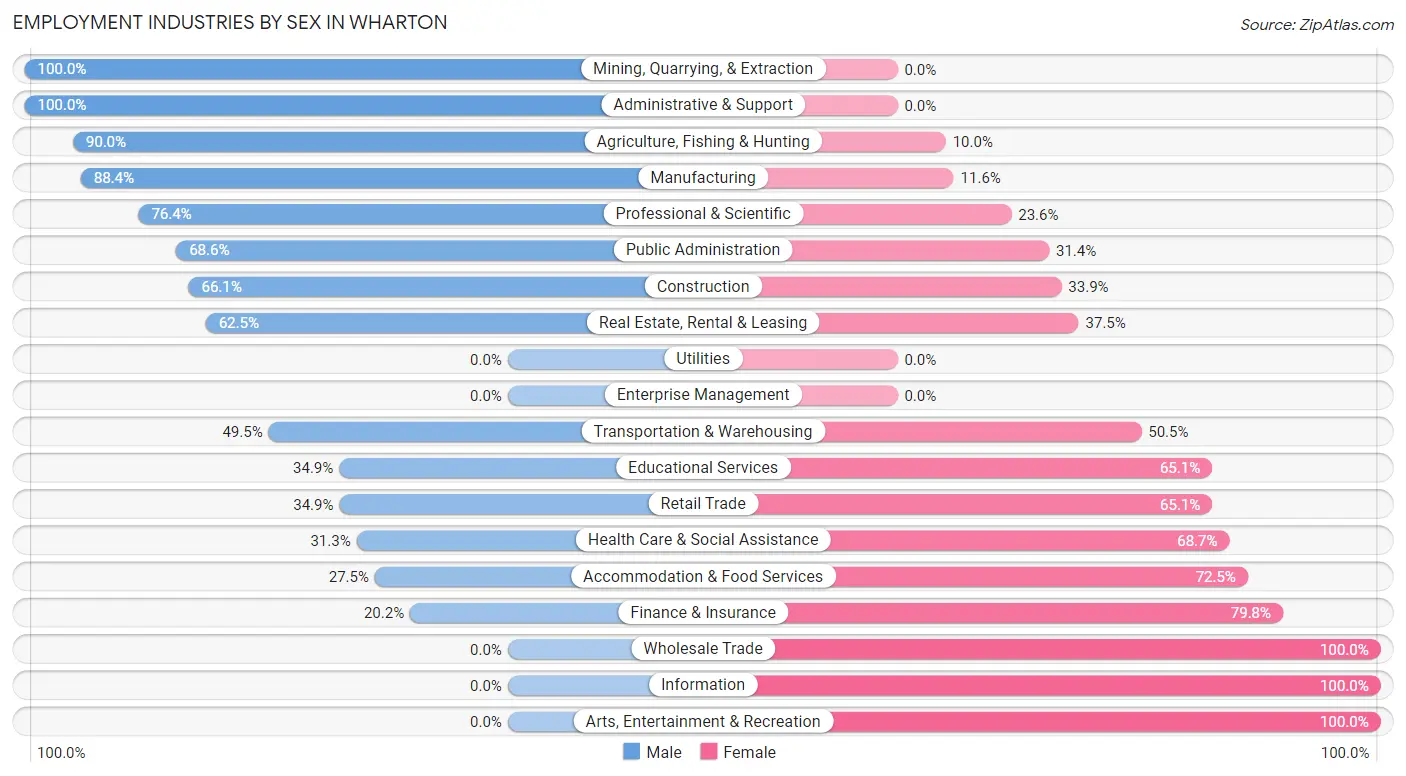
Employment Industries by Sex in Wharton
The Wharton industries that see more men than women are Mining, Quarrying, & Extraction (100.0%), Administrative & Support (100.0%), and Agriculture, Fishing & Hunting (90.0%), whereas the industries that tend to have a higher number of women are Wholesale Trade (100.0%), Information (100.0%), and Arts, Entertainment & Recreation (100.0%).
| Industry | Male | Female |
| Agriculture, Fishing & Hunting | 135 (90.0%) | 15 (10.0%) |
| Mining, Quarrying, & Extraction | 46 (100.0%) | 0 (0.0%) |
| Construction | 290 (66.1%) | 149 (33.9%) |
| Manufacturing | 524 (88.4%) | 69 (11.6%) |
| Wholesale Trade | 0 (0.0%) | 52 (100.0%) |
| Retail Trade | 160 (34.9%) | 299 (65.1%) |
| Transportation & Warehousing | 104 (49.5%) | 106 (50.5%) |
| Utilities | 0 (0.0%) | 0 (0.0%) |
| Information | 0 (0.0%) | 17 (100.0%) |
| Finance & Insurance | 35 (20.2%) | 138 (79.8%) |
| Real Estate, Rental & Leasing | 20 (62.5%) | 12 (37.5%) |
| Professional & Scientific | 107 (76.4%) | 33 (23.6%) |
| Enterprise Management | 0 (0.0%) | 0 (0.0%) |
| Administrative & Support | 16 (100.0%) | 0 (0.0%) |
| Educational Services | 67 (34.9%) | 125 (65.1%) |
| Health Care & Social Assistance | 181 (31.3%) | 397 (68.7%) |
| Arts, Entertainment & Recreation | 0 (0.0%) | 175 (100.0%) |
| Accommodation & Food Services | 63 (27.5%) | 166 (72.5%) |
| Public Administration | 94 (68.6%) | 43 (31.4%) |
| Total | 1,916 (50.3%) | 1,891 (49.7%) |
Education in Wharton
School Enrollment in Wharton
The most common levels of schooling among the 1,895 students in Wharton are college / undergraduate (668 | 35.2%), middle school (389 | 20.5%), and high school (320 | 16.9%).
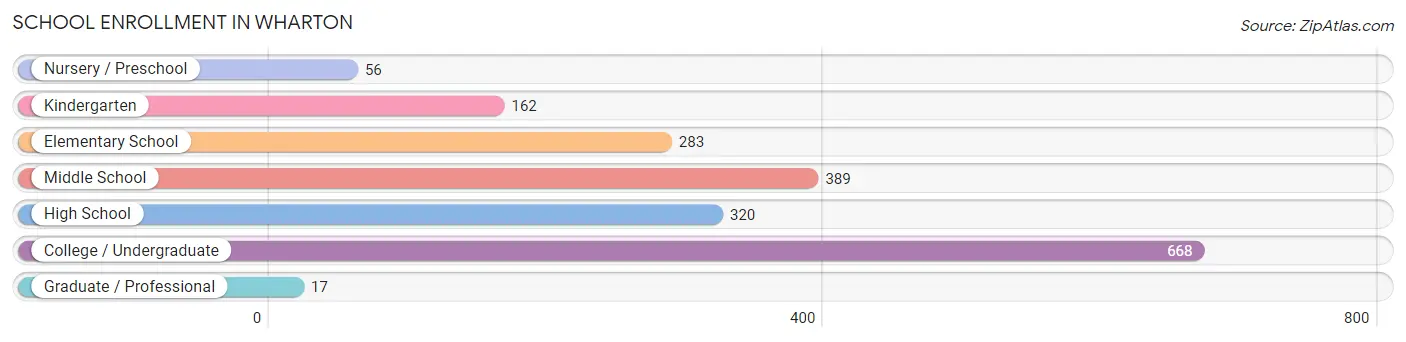
| School Level | # Students | % Students |
| Nursery / Preschool | 56 | 3.0% |
| Kindergarten | 162 | 8.6% |
| Elementary School | 283 | 14.9% |
| Middle School | 389 | 20.5% |
| High School | 320 | 16.9% |
| College / Undergraduate | 668 | 35.2% |
| Graduate / Professional | 17 | 0.9% |
| Total | 1,895 | 100.0% |
School Enrollment by Age by Funding Source in Wharton
Out of a total of 1,895 students who are enrolled in schools in Wharton, 186 (9.8%) attend a private institution, while the remaining 1,709 (90.2%) are enrolled in public schools. The age group of 35 years and over has the highest likelihood of being enrolled in private schools, with 33 (64.7% in the age bracket) enrolled. Conversely, the age group of 3 to 4 year olds has the lowest likelihood of being enrolled in a private school, with 38 (100.0% in the age bracket) attending a public institution.
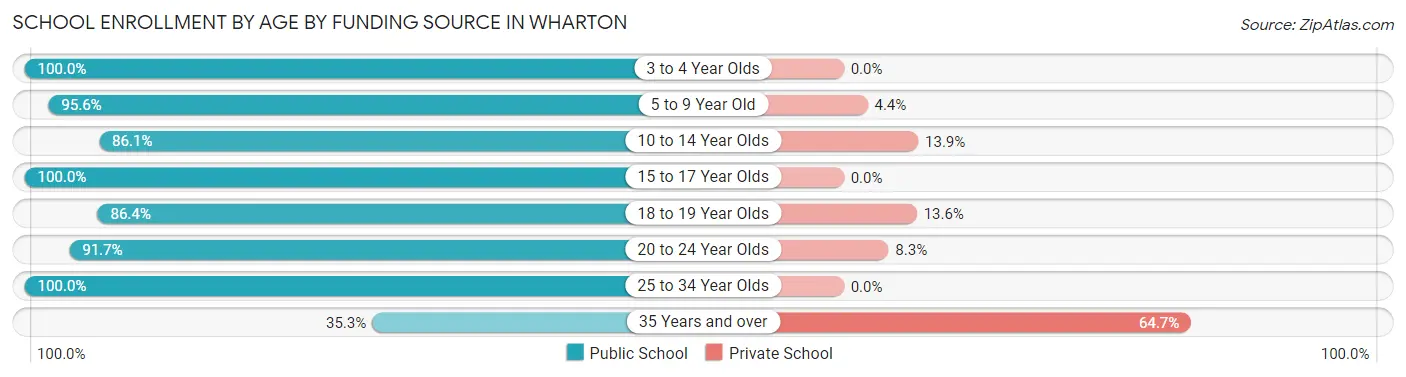
| Age Bracket | Public School | Private School |
| 3 to 4 Year Olds | 38 (100.0%) | 0 (0.0%) |
| 5 to 9 Year Old | 387 (95.6%) | 18 (4.4%) |
| 10 to 14 Year Olds | 385 (86.1%) | 62 (13.9%) |
| 15 to 17 Year Olds | 127 (100.0%) | 0 (0.0%) |
| 18 to 19 Year Olds | 324 (86.4%) | 51 (13.6%) |
| 20 to 24 Year Olds | 231 (91.7%) | 21 (8.3%) |
| 25 to 34 Year Olds | 200 (100.0%) | 0 (0.0%) |
| 35 Years and over | 18 (35.3%) | 33 (64.7%) |
| Total | 1,709 (90.2%) | 186 (9.8%) |
Educational Attainment by Field of Study in Wharton
Business (214 | 32.3%), education (105 | 15.9%), bio, nature & agricultural (96 | 14.5%), science & technology (76 | 11.5%), and liberal arts & history (64 | 9.7%) are the most common fields of study among 662 individuals in Wharton who have obtained a bachelor's degree or higher.
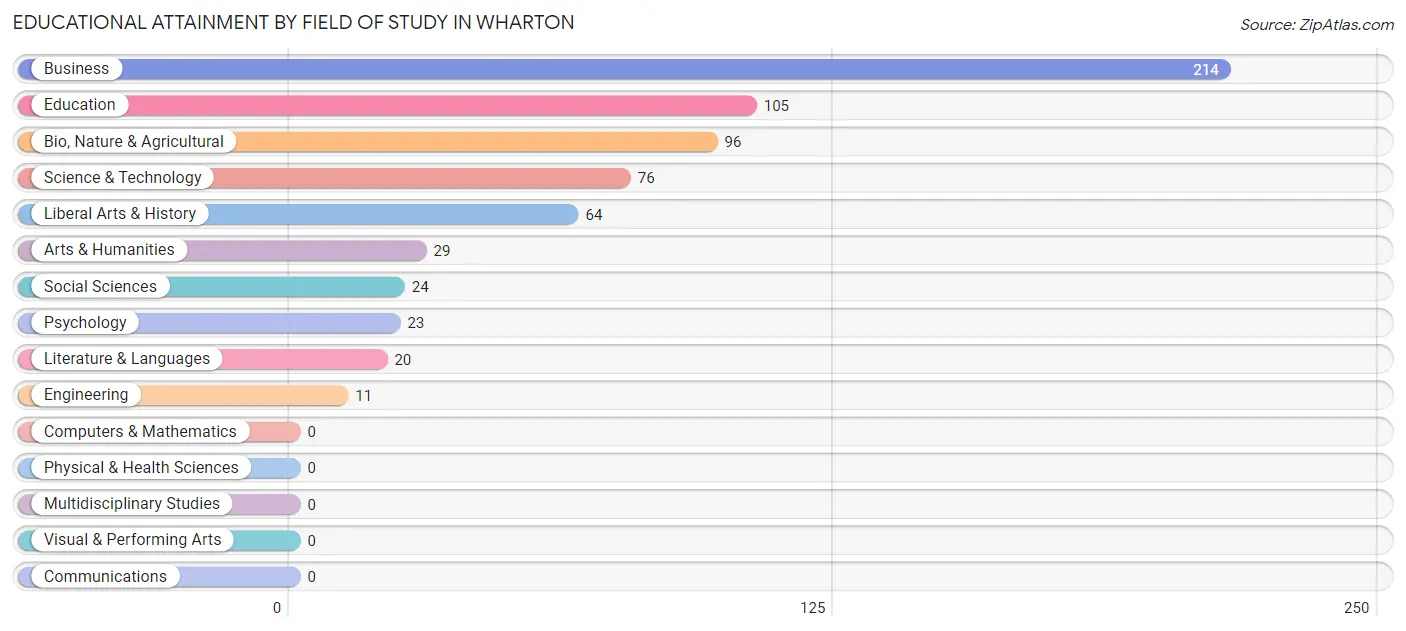
| Field of Study | # Graduates | % Graduates |
| Computers & Mathematics | 0 | 0.0% |
| Bio, Nature & Agricultural | 96 | 14.5% |
| Physical & Health Sciences | 0 | 0.0% |
| Psychology | 23 | 3.5% |
| Social Sciences | 24 | 3.6% |
| Engineering | 11 | 1.7% |
| Multidisciplinary Studies | 0 | 0.0% |
| Science & Technology | 76 | 11.5% |
| Business | 214 | 32.3% |
| Education | 105 | 15.9% |
| Literature & Languages | 20 | 3.0% |
| Liberal Arts & History | 64 | 9.7% |
| Visual & Performing Arts | 0 | 0.0% |
| Communications | 0 | 0.0% |
| Arts & Humanities | 29 | 4.4% |
| Total | 662 | 100.0% |
Transportation & Commute in Wharton
Vehicle Availability by Sex in Wharton
The most prevalent vehicle ownership categories in Wharton are males with 1 vehicle (624, accounting for 33.3%) and females with 1 vehicle (266, making up 33.7%).
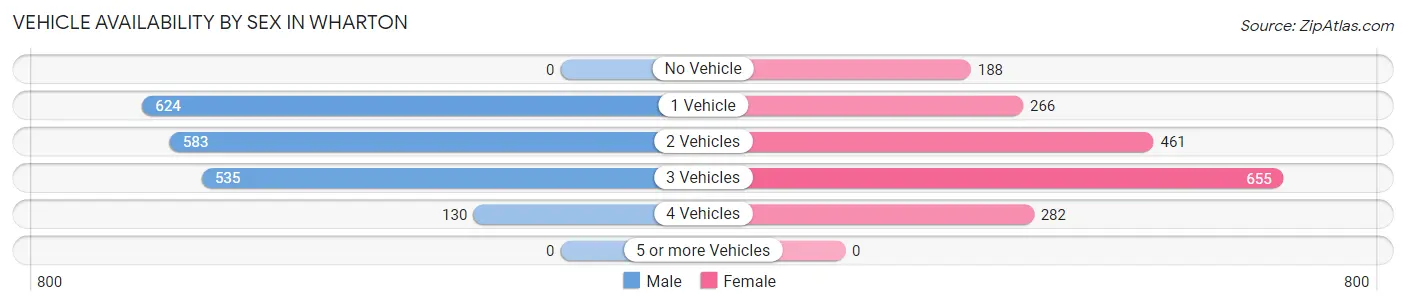
| Vehicles Available | Male | Female |
| No Vehicle | 0 (0.0%) | 188 (10.2%) |
| 1 Vehicle | 624 (33.3%) | 266 (14.4%) |
| 2 Vehicles | 583 (31.1%) | 461 (24.9%) |
| 3 Vehicles | 535 (28.6%) | 655 (35.4%) |
| 4 Vehicles | 130 (6.9%) | 282 (15.2%) |
| 5 or more Vehicles | 0 (0.0%) | 0 (0.0%) |
| Total | 1,872 (100.0%) | 1,852 (100.0%) |
Commute Time in Wharton
The most frequently occuring commute durations in Wharton are 5 to 9 minutes (781 commuters, 21.3%), 10 to 14 minutes (702 commuters, 19.2%), and 20 to 24 minutes (486 commuters, 13.3%).
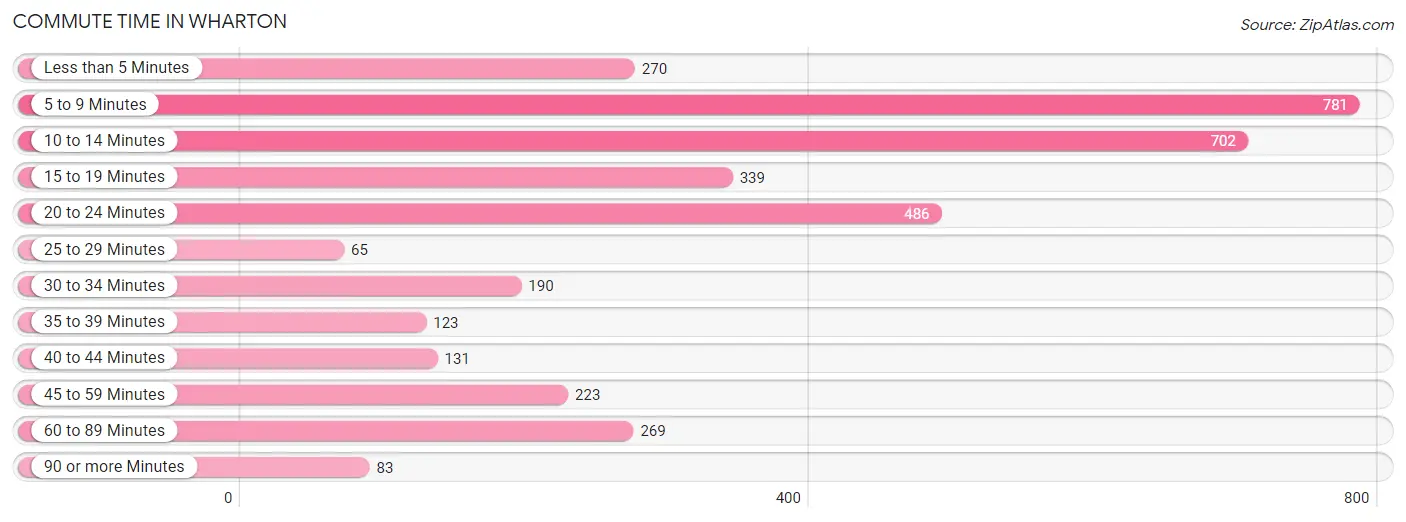
| Commute Time | # Commuters | % Commuters |
| Less than 5 Minutes | 270 | 7.4% |
| 5 to 9 Minutes | 781 | 21.3% |
| 10 to 14 Minutes | 702 | 19.2% |
| 15 to 19 Minutes | 339 | 9.3% |
| 20 to 24 Minutes | 486 | 13.3% |
| 25 to 29 Minutes | 65 | 1.8% |
| 30 to 34 Minutes | 190 | 5.2% |
| 35 to 39 Minutes | 123 | 3.4% |
| 40 to 44 Minutes | 131 | 3.6% |
| 45 to 59 Minutes | 223 | 6.1% |
| 60 to 89 Minutes | 269 | 7.3% |
| 90 or more Minutes | 83 | 2.3% |
Commute Time by Sex in Wharton
The most common commute times in Wharton are 10 to 14 minutes (506 commuters, 27.2%) for males and 5 to 9 minutes (446 commuters, 24.7%) for females.
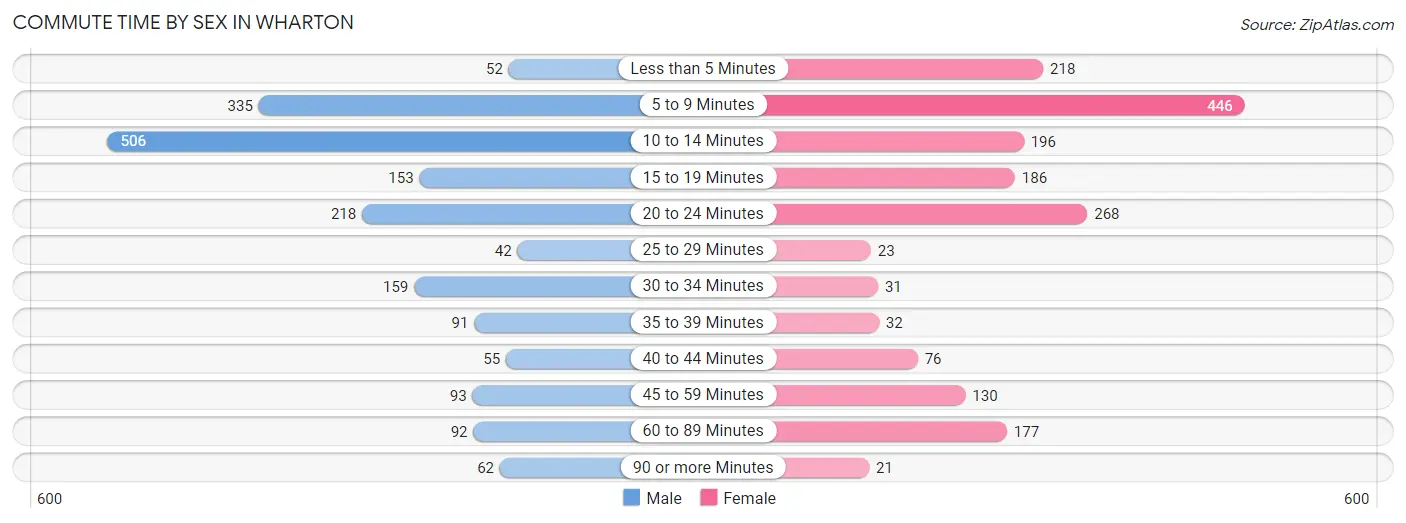
| Commute Time | Male | Female |
| Less than 5 Minutes | 52 (2.8%) | 218 (12.1%) |
| 5 to 9 Minutes | 335 (18.0%) | 446 (24.7%) |
| 10 to 14 Minutes | 506 (27.2%) | 196 (10.9%) |
| 15 to 19 Minutes | 153 (8.2%) | 186 (10.3%) |
| 20 to 24 Minutes | 218 (11.7%) | 268 (14.9%) |
| 25 to 29 Minutes | 42 (2.3%) | 23 (1.3%) |
| 30 to 34 Minutes | 159 (8.6%) | 31 (1.7%) |
| 35 to 39 Minutes | 91 (4.9%) | 32 (1.8%) |
| 40 to 44 Minutes | 55 (3.0%) | 76 (4.2%) |
| 45 to 59 Minutes | 93 (5.0%) | 130 (7.2%) |
| 60 to 89 Minutes | 92 (5.0%) | 177 (9.8%) |
| 90 or more Minutes | 62 (3.3%) | 21 (1.2%) |
Time of Departure to Work by Sex in Wharton
The most frequent times of departure to work in Wharton are 7:00 AM to 7:29 AM (482, 25.9%) for males and 8:00 AM to 8:29 AM (407, 22.6%) for females.
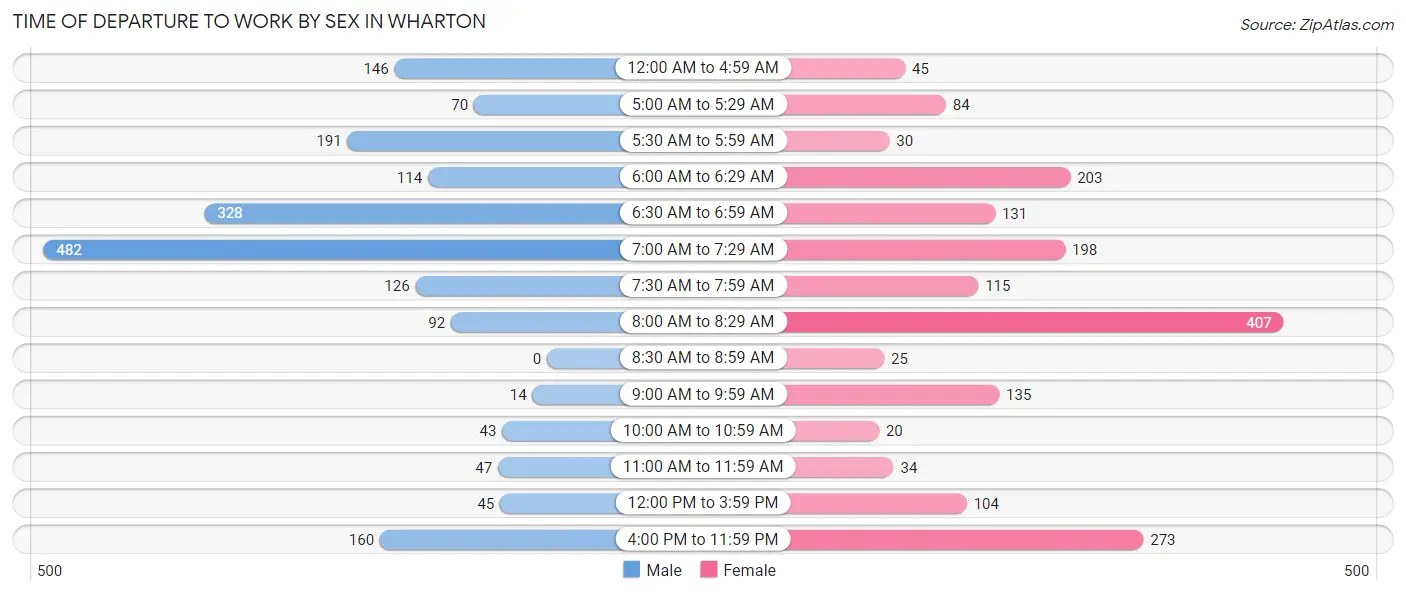
| Time of Departure | Male | Female |
| 12:00 AM to 4:59 AM | 146 (7.9%) | 45 (2.5%) |
| 5:00 AM to 5:29 AM | 70 (3.8%) | 84 (4.7%) |
| 5:30 AM to 5:59 AM | 191 (10.3%) | 30 (1.7%) |
| 6:00 AM to 6:29 AM | 114 (6.1%) | 203 (11.3%) |
| 6:30 AM to 6:59 AM | 328 (17.6%) | 131 (7.3%) |
| 7:00 AM to 7:29 AM | 482 (25.9%) | 198 (11.0%) |
| 7:30 AM to 7:59 AM | 126 (6.8%) | 115 (6.4%) |
| 8:00 AM to 8:29 AM | 92 (5.0%) | 407 (22.6%) |
| 8:30 AM to 8:59 AM | 0 (0.0%) | 25 (1.4%) |
| 9:00 AM to 9:59 AM | 14 (0.7%) | 135 (7.5%) |
| 10:00 AM to 10:59 AM | 43 (2.3%) | 20 (1.1%) |
| 11:00 AM to 11:59 AM | 47 (2.5%) | 34 (1.9%) |
| 12:00 PM to 3:59 PM | 45 (2.4%) | 104 (5.8%) |
| 4:00 PM to 11:59 PM | 160 (8.6%) | 273 (15.1%) |
| Total | 1,858 (100.0%) | 1,804 (100.0%) |
Housing Occupancy in Wharton
Occupancy by Ownership in Wharton
Of the total 3,466 dwellings in Wharton, owner-occupied units account for 1,567 (45.2%), while renter-occupied units make up 1,899 (54.8%).
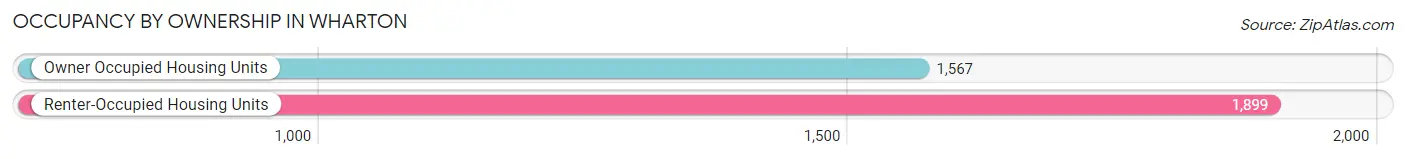
| Occupancy | # Housing Units | % Housing Units |
| Owner Occupied Housing Units | 1,567 | 45.2% |
| Renter-Occupied Housing Units | 1,899 | 54.8% |
| Total Occupied Housing Units | 3,466 | 100.0% |
Occupancy by Household Size in Wharton
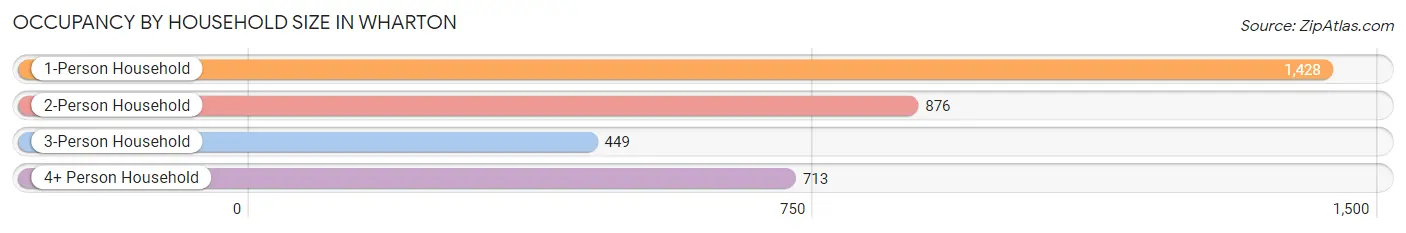
| Household Size | # Housing Units | % Housing Units |
| 1-Person Household | 1,428 | 41.2% |
| 2-Person Household | 876 | 25.3% |
| 3-Person Household | 449 | 13.0% |
| 4+ Person Household | 713 | 20.6% |
| Total Housing Units | 3,466 | 100.0% |
Occupancy by Ownership by Household Size in Wharton
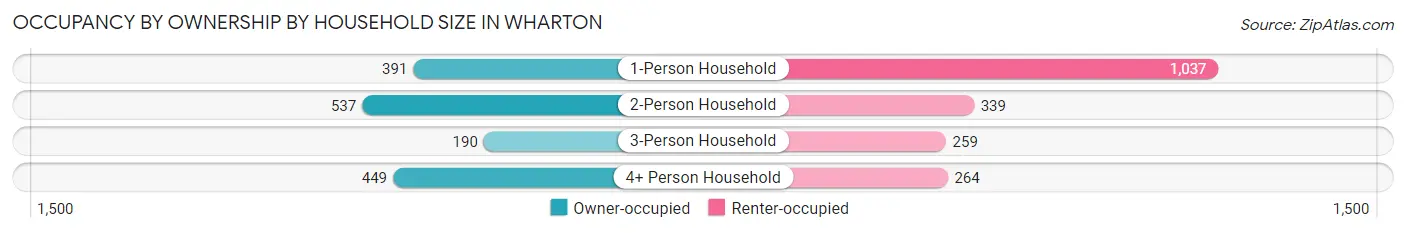
| Household Size | Owner-occupied | Renter-occupied |
| 1-Person Household | 391 (27.4%) | 1,037 (72.6%) |
| 2-Person Household | 537 (61.3%) | 339 (38.7%) |
| 3-Person Household | 190 (42.3%) | 259 (57.7%) |
| 4+ Person Household | 449 (63.0%) | 264 (37.0%) |
| Total Housing Units | 1,567 (45.2%) | 1,899 (54.8%) |
Occupancy by Educational Attainment in Wharton
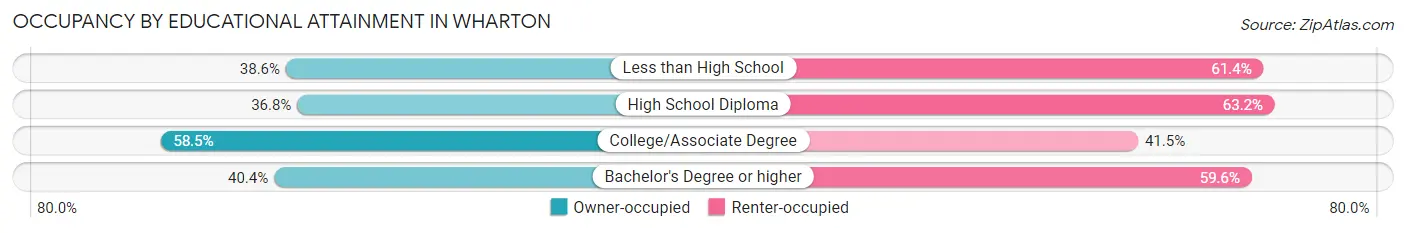
| Household Size | Owner-occupied | Renter-occupied |
| Less than High School | 364 (38.6%) | 580 (61.4%) |
| High School Diploma | 318 (36.8%) | 547 (63.2%) |
| College/Associate Degree | 697 (58.5%) | 495 (41.5%) |
| Bachelor's Degree or higher | 188 (40.4%) | 277 (59.6%) |
Occupancy by Age of Householder in Wharton
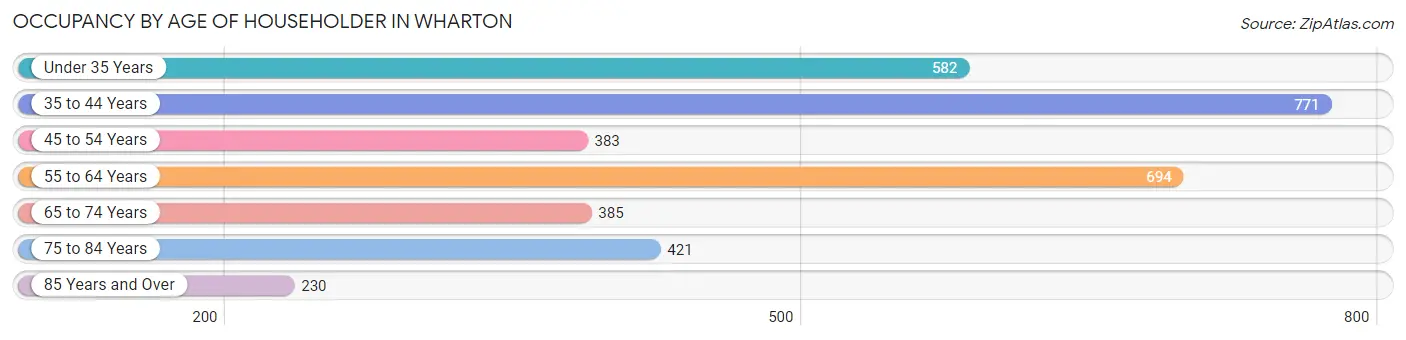
| Age Bracket | # Households | % Households |
| Under 35 Years | 582 | 16.8% |
| 35 to 44 Years | 771 | 22.2% |
| 45 to 54 Years | 383 | 11.1% |
| 55 to 64 Years | 694 | 20.0% |
| 65 to 74 Years | 385 | 11.1% |
| 75 to 84 Years | 421 | 12.1% |
| 85 Years and Over | 230 | 6.6% |
| Total | 3,466 | 100.0% |
Housing Finances in Wharton
Median Income by Occupancy in Wharton
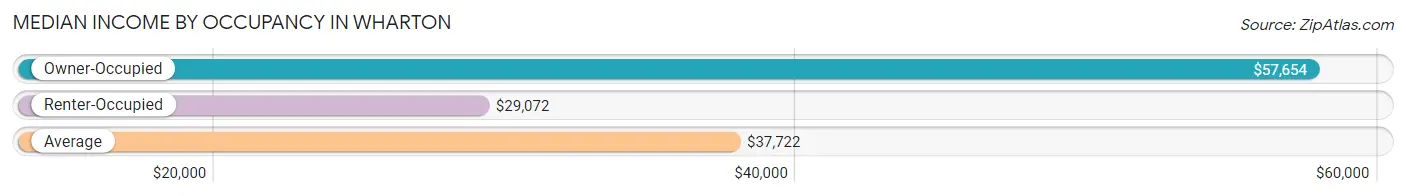
| Occupancy Type | # Households | Median Income |
| Owner-Occupied | 1,567 (45.2%) | $57,654 |
| Renter-Occupied | 1,899 (54.8%) | $29,072 |
| Average | 3,466 (100.0%) | $37,722 |
Occupancy by Householder Income Bracket in Wharton
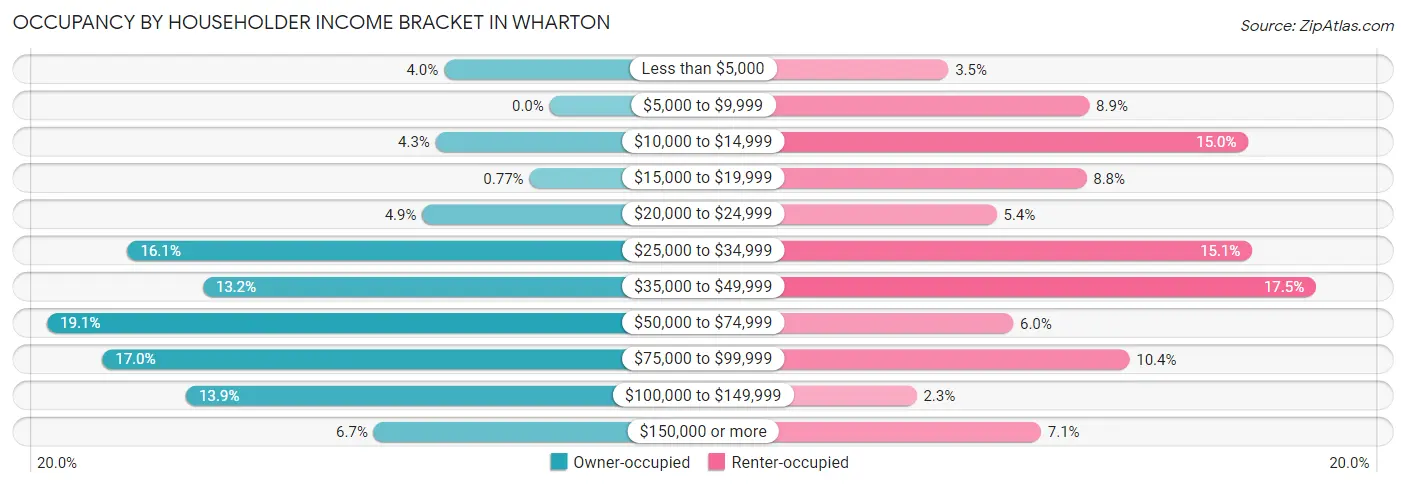
| Income Bracket | Owner-occupied | Renter-occupied |
| Less than $5,000 | 63 (4.0%) | 67 (3.5%) |
| $5,000 to $9,999 | 0 (0.0%) | 169 (8.9%) |
| $10,000 to $14,999 | 68 (4.3%) | 284 (15.0%) |
| $15,000 to $19,999 | 12 (0.8%) | 167 (8.8%) |
| $20,000 to $24,999 | 76 (4.9%) | 102 (5.4%) |
| $25,000 to $34,999 | 252 (16.1%) | 287 (15.1%) |
| $35,000 to $49,999 | 207 (13.2%) | 333 (17.5%) |
| $50,000 to $74,999 | 300 (19.1%) | 114 (6.0%) |
| $75,000 to $99,999 | 267 (17.0%) | 198 (10.4%) |
| $100,000 to $149,999 | 217 (13.9%) | 44 (2.3%) |
| $150,000 or more | 105 (6.7%) | 134 (7.1%) |
| Total | 1,567 (100.0%) | 1,899 (100.0%) |
Monthly Housing Cost Tiers in Wharton
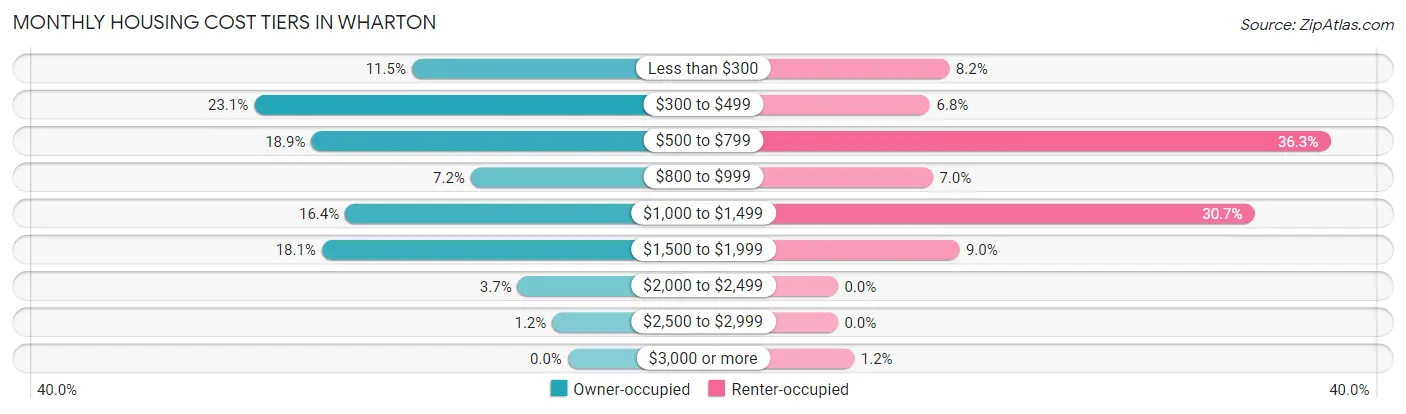
| Monthly Cost | Owner-occupied | Renter-occupied |
| Less than $300 | 180 (11.5%) | 156 (8.2%) |
| $300 to $499 | 362 (23.1%) | 129 (6.8%) |
| $500 to $799 | 296 (18.9%) | 689 (36.3%) |
| $800 to $999 | 112 (7.1%) | 133 (7.0%) |
| $1,000 to $1,499 | 257 (16.4%) | 583 (30.7%) |
| $1,500 to $1,999 | 284 (18.1%) | 170 (8.9%) |
| $2,000 to $2,499 | 58 (3.7%) | 0 (0.0%) |
| $2,500 to $2,999 | 18 (1.1%) | 0 (0.0%) |
| $3,000 or more | 0 (0.0%) | 23 (1.2%) |
| Total | 1,567 (100.0%) | 1,899 (100.0%) |
Physical Housing Characteristics in Wharton
Housing Structures in Wharton
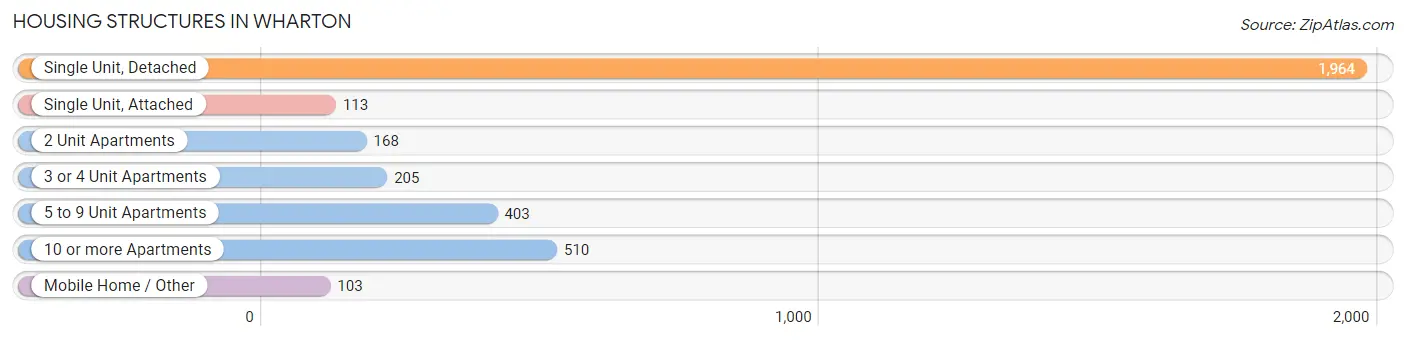
| Structure Type | # Housing Units | % Housing Units |
| Single Unit, Detached | 1,964 | 56.7% |
| Single Unit, Attached | 113 | 3.3% |
| 2 Unit Apartments | 168 | 4.9% |
| 3 or 4 Unit Apartments | 205 | 5.9% |
| 5 to 9 Unit Apartments | 403 | 11.6% |
| 10 or more Apartments | 510 | 14.7% |
| Mobile Home / Other | 103 | 3.0% |
| Total | 3,466 | 100.0% |
Housing Structures by Occupancy in Wharton
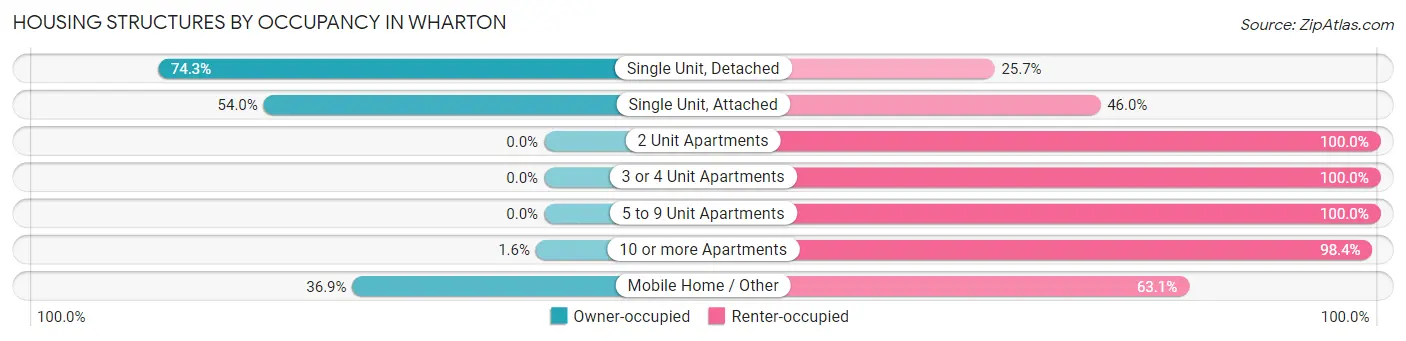
| Structure Type | Owner-occupied | Renter-occupied |
| Single Unit, Detached | 1,460 (74.3%) | 504 (25.7%) |
| Single Unit, Attached | 61 (54.0%) | 52 (46.0%) |
| 2 Unit Apartments | 0 (0.0%) | 168 (100.0%) |
| 3 or 4 Unit Apartments | 0 (0.0%) | 205 (100.0%) |
| 5 to 9 Unit Apartments | 0 (0.0%) | 403 (100.0%) |
| 10 or more Apartments | 8 (1.6%) | 502 (98.4%) |
| Mobile Home / Other | 38 (36.9%) | 65 (63.1%) |
| Total | 1,567 (45.2%) | 1,899 (54.8%) |
Housing Structures by Number of Rooms in Wharton
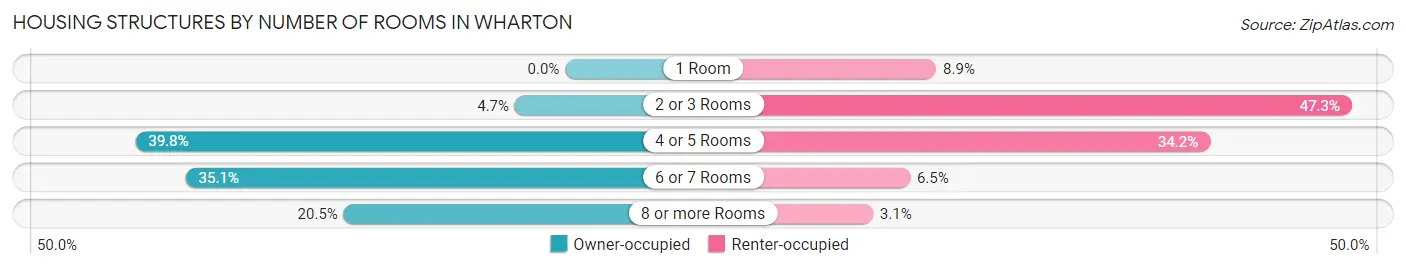
| Number of Rooms | Owner-occupied | Renter-occupied |
| 1 Room | 0 (0.0%) | 169 (8.9%) |
| 2 or 3 Rooms | 73 (4.7%) | 899 (47.3%) |
| 4 or 5 Rooms | 623 (39.8%) | 650 (34.2%) |
| 6 or 7 Rooms | 550 (35.1%) | 123 (6.5%) |
| 8 or more Rooms | 321 (20.5%) | 58 (3.0%) |
| Total | 1,567 (100.0%) | 1,899 (100.0%) |
Housing Structure by Heating Type in Wharton
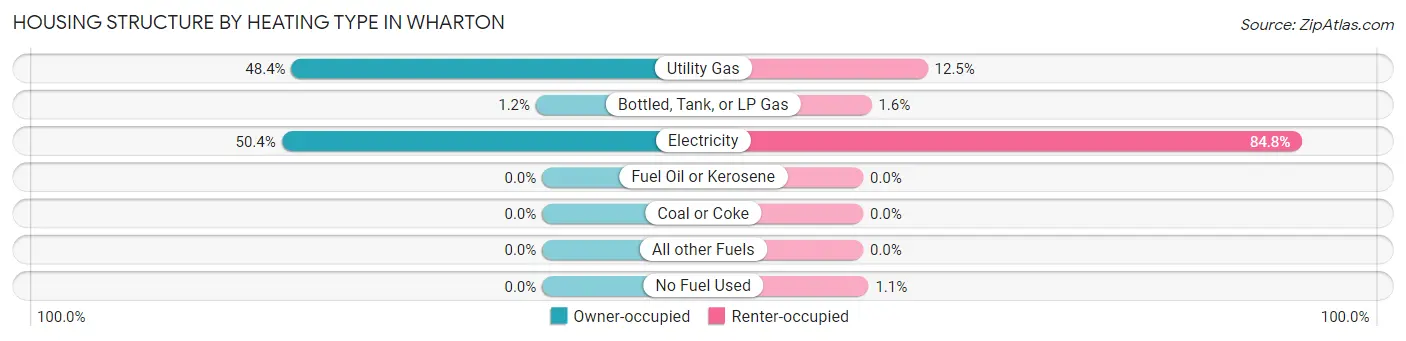
| Heating Type | Owner-occupied | Renter-occupied |
| Utility Gas | 759 (48.4%) | 237 (12.5%) |
| Bottled, Tank, or LP Gas | 19 (1.2%) | 31 (1.6%) |
| Electricity | 789 (50.3%) | 1,611 (84.8%) |
| Fuel Oil or Kerosene | 0 (0.0%) | 0 (0.0%) |
| Coal or Coke | 0 (0.0%) | 0 (0.0%) |
| All other Fuels | 0 (0.0%) | 0 (0.0%) |
| No Fuel Used | 0 (0.0%) | 20 (1.1%) |
| Total | 1,567 (100.0%) | 1,899 (100.0%) |
Household Vehicle Usage in Wharton
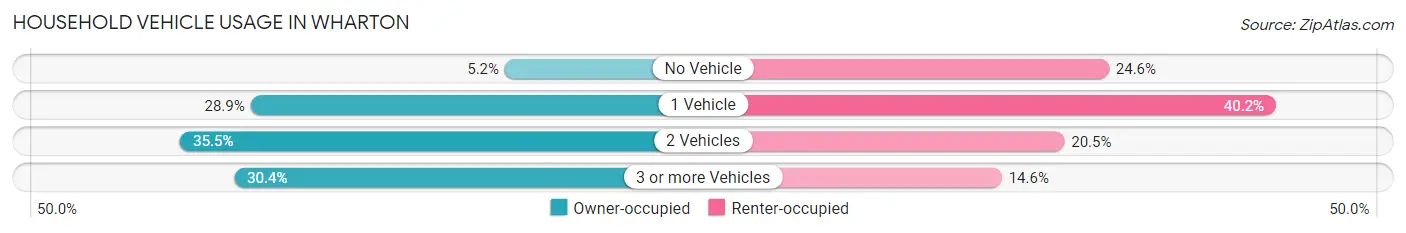
| Vehicles per Household | Owner-occupied | Renter-occupied |
| No Vehicle | 81 (5.2%) | 468 (24.6%) |
| 1 Vehicle | 453 (28.9%) | 764 (40.2%) |
| 2 Vehicles | 556 (35.5%) | 389 (20.5%) |
| 3 or more Vehicles | 477 (30.4%) | 278 (14.6%) |
| Total | 1,567 (100.0%) | 1,899 (100.0%) |
Real Estate & Mortgages in Wharton
Real Estate and Mortgage Overview in Wharton
| Characteristic | Without Mortgage | With Mortgage |
| Housing Units | 911 | 656 |
| Median Property Value | $96,300 | $160,400 |
| Median Household Income | $46,639 | $79 |
| Monthly Housing Costs | $445 | $0 |
| Real Estate Taxes | $1,653 | $5 |
Property Value by Mortgage Status in Wharton
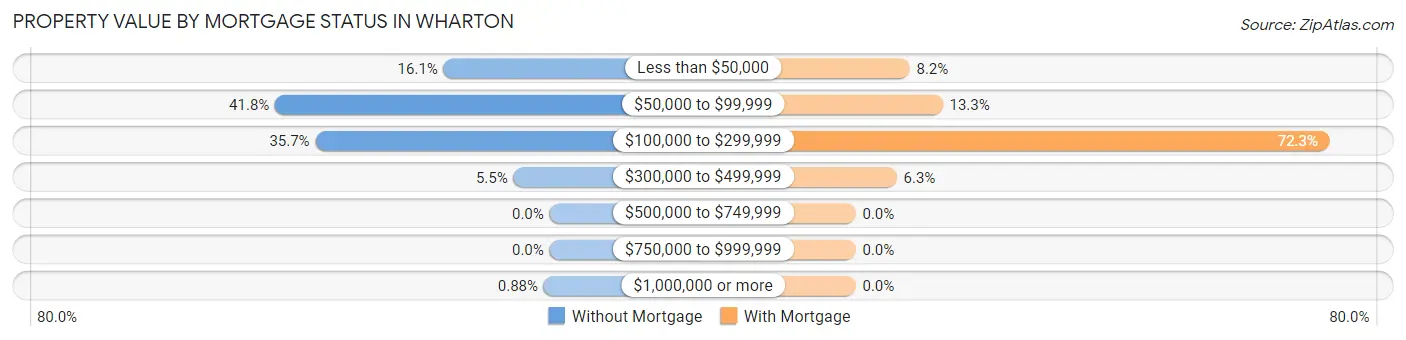
| Property Value | Without Mortgage | With Mortgage |
| Less than $50,000 | 147 (16.1%) | 54 (8.2%) |
| $50,000 to $99,999 | 381 (41.8%) | 87 (13.3%) |
| $100,000 to $299,999 | 325 (35.7%) | 474 (72.3%) |
| $300,000 to $499,999 | 50 (5.5%) | 41 (6.2%) |
| $500,000 to $749,999 | 0 (0.0%) | 0 (0.0%) |
| $750,000 to $999,999 | 0 (0.0%) | 0 (0.0%) |
| $1,000,000 or more | 8 (0.9%) | 0 (0.0%) |
| Total | 911 (100.0%) | 656 (100.0%) |
Household Income by Mortgage Status in Wharton
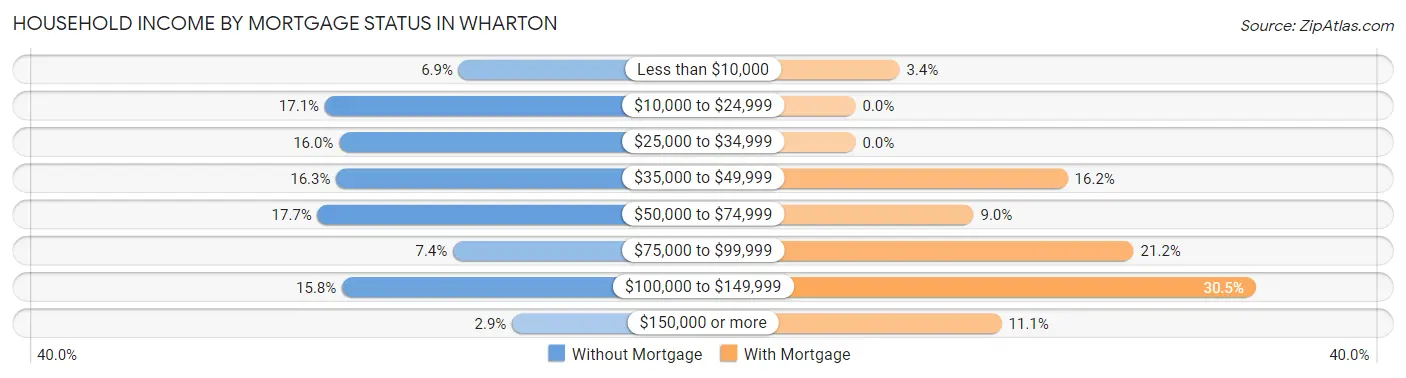
| Household Income | Without Mortgage | With Mortgage |
| Less than $10,000 | 63 (6.9%) | 22 (3.4%) |
| $10,000 to $24,999 | 156 (17.1%) | 0 (0.0%) |
| $25,000 to $34,999 | 146 (16.0%) | 0 (0.0%) |
| $35,000 to $49,999 | 148 (16.3%) | 106 (16.2%) |
| $50,000 to $74,999 | 161 (17.7%) | 59 (9.0%) |
| $75,000 to $99,999 | 67 (7.3%) | 139 (21.2%) |
| $100,000 to $149,999 | 144 (15.8%) | 200 (30.5%) |
| $150,000 or more | 26 (2.9%) | 73 (11.1%) |
| Total | 911 (100.0%) | 656 (100.0%) |
Property Value to Household Income Ratio in Wharton
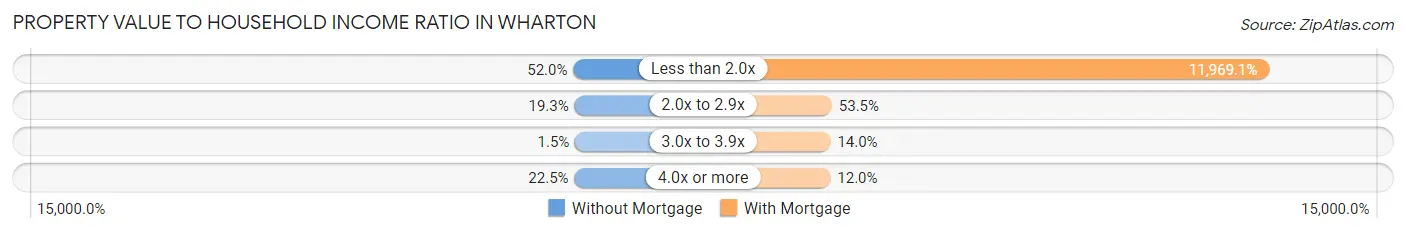
| Value-to-Income Ratio | Without Mortgage | With Mortgage |
| Less than 2.0x | 474 (52.0%) | 78,517 (11,969.1%) |
| 2.0x to 2.9x | 176 (19.3%) | 351 (53.5%) |
| 3.0x to 3.9x | 14 (1.5%) | 92 (14.0%) |
| 4.0x or more | 205 (22.5%) | 79 (12.0%) |
| Total | 911 (100.0%) | 656 (100.0%) |
Real Estate Taxes by Mortgage Status in Wharton
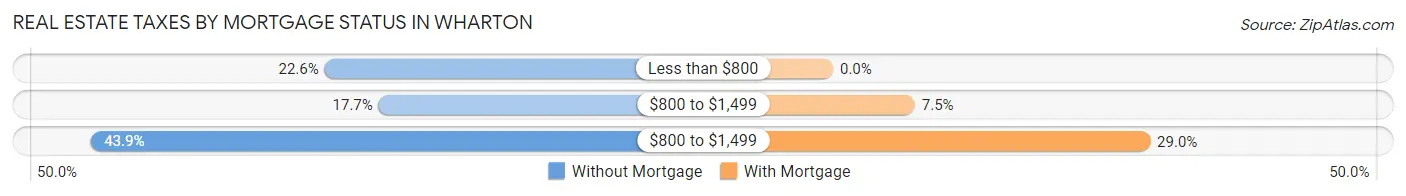
| Property Taxes | Without Mortgage | With Mortgage |
| Less than $800 | 206 (22.6%) | 0 (0.0%) |
| $800 to $1,499 | 161 (17.7%) | 49 (7.5%) |
| $800 to $1,499 | 400 (43.9%) | 190 (29.0%) |
| Total | 911 (100.0%) | 656 (100.0%) |
Health & Disability in Wharton
Health Insurance Coverage by Age in Wharton
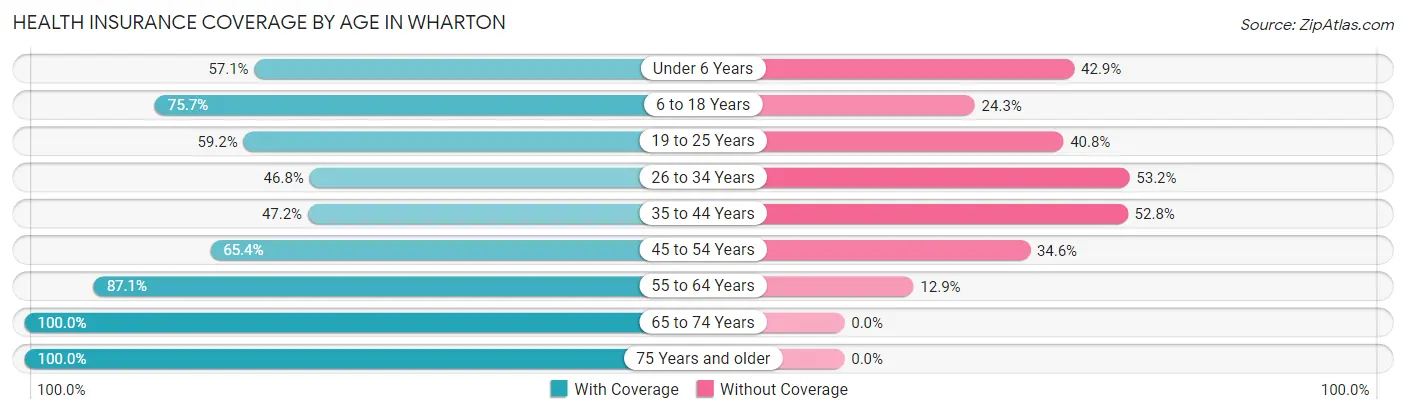
| Age Bracket | With Coverage | Without Coverage |
| Under 6 Years | 488 (57.1%) | 366 (42.9%) |
| 6 to 18 Years | 959 (75.7%) | 308 (24.3%) |
| 19 to 25 Years | 561 (59.2%) | 387 (40.8%) |
| 26 to 34 Years | 430 (46.8%) | 488 (53.2%) |
| 35 to 44 Years | 614 (47.2%) | 688 (52.8%) |
| 45 to 54 Years | 540 (65.4%) | 286 (34.6%) |
| 55 to 64 Years | 804 (87.1%) | 119 (12.9%) |
| 65 to 74 Years | 576 (100.0%) | 0 (0.0%) |
| 75 Years and older | 851 (100.0%) | 0 (0.0%) |
| Total | 5,823 (68.8%) | 2,642 (31.2%) |
Health Insurance Coverage by Citizenship Status in Wharton
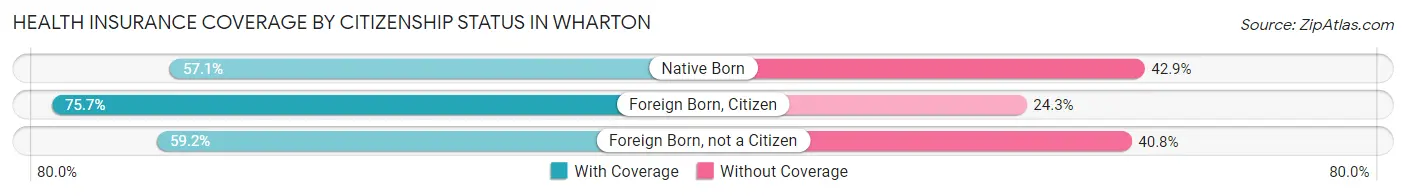
| Citizenship Status | With Coverage | Without Coverage |
| Native Born | 488 (57.1%) | 366 (42.9%) |
| Foreign Born, Citizen | 959 (75.7%) | 308 (24.3%) |
| Foreign Born, not a Citizen | 561 (59.2%) | 387 (40.8%) |
Health Insurance Coverage by Household Income in Wharton
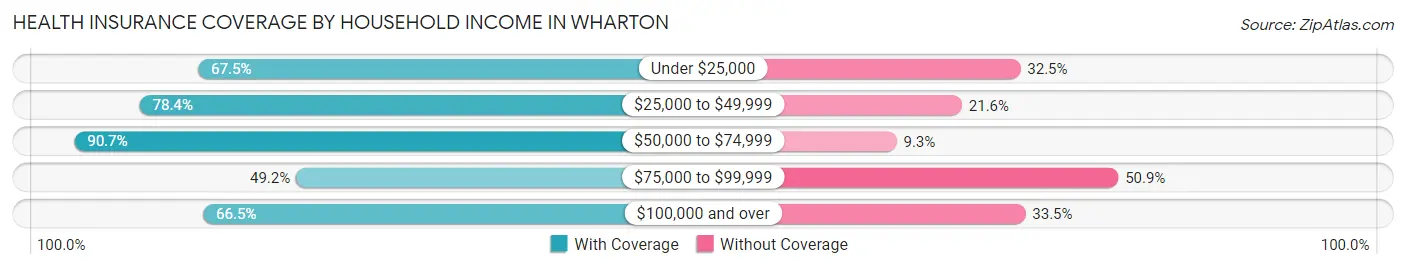
| Household Income | With Coverage | Without Coverage |
| Under $25,000 | 1,210 (67.5%) | 583 (32.5%) |
| $25,000 to $49,999 | 1,524 (78.4%) | 419 (21.6%) |
| $50,000 to $74,999 | 944 (90.7%) | 97 (9.3%) |
| $75,000 to $99,999 | 928 (49.1%) | 960 (50.8%) |
| $100,000 and over | 1,090 (66.5%) | 548 (33.5%) |
Public vs Private Health Insurance Coverage by Age in Wharton
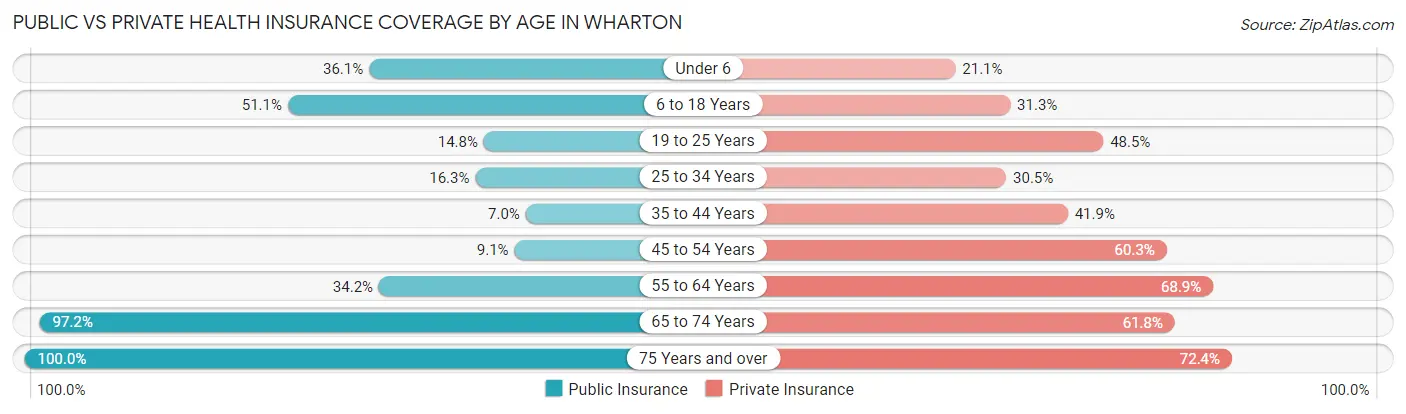
| Age Bracket | Public Insurance | Private Insurance |
| Under 6 | 308 (36.1%) | 180 (21.1%) |
| 6 to 18 Years | 648 (51.1%) | 396 (31.2%) |
| 19 to 25 Years | 140 (14.8%) | 460 (48.5%) |
| 25 to 34 Years | 150 (16.3%) | 280 (30.5%) |
| 35 to 44 Years | 91 (7.0%) | 546 (41.9%) |
| 45 to 54 Years | 75 (9.1%) | 498 (60.3%) |
| 55 to 64 Years | 316 (34.2%) | 636 (68.9%) |
| 65 to 74 Years | 560 (97.2%) | 356 (61.8%) |
| 75 Years and over | 851 (100.0%) | 616 (72.4%) |
| Total | 3,139 (37.1%) | 3,968 (46.9%) |
Disability Status by Sex by Age in Wharton
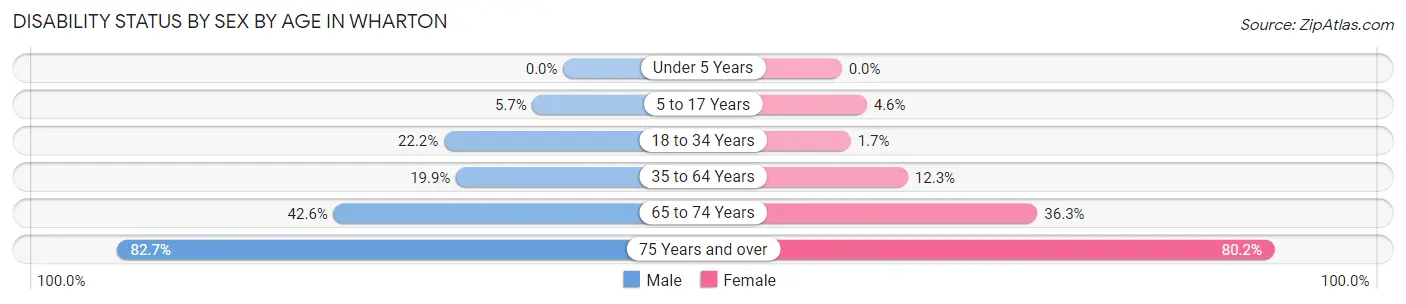
| Age Bracket | Male | Female |
| Under 5 Years | 0 (0.0%) | 0 (0.0%) |
| 5 to 17 Years | 34 (5.7%) | 25 (4.6%) |
| 18 to 34 Years | 214 (22.2%) | 20 (1.7%) |
| 35 to 64 Years | 315 (19.9%) | 180 (12.3%) |
| 65 to 74 Years | 107 (42.6%) | 118 (36.3%) |
| 75 Years and over | 249 (82.7%) | 441 (80.2%) |
Disability Class by Sex by Age in Wharton
Disability Class: Hearing Difficulty
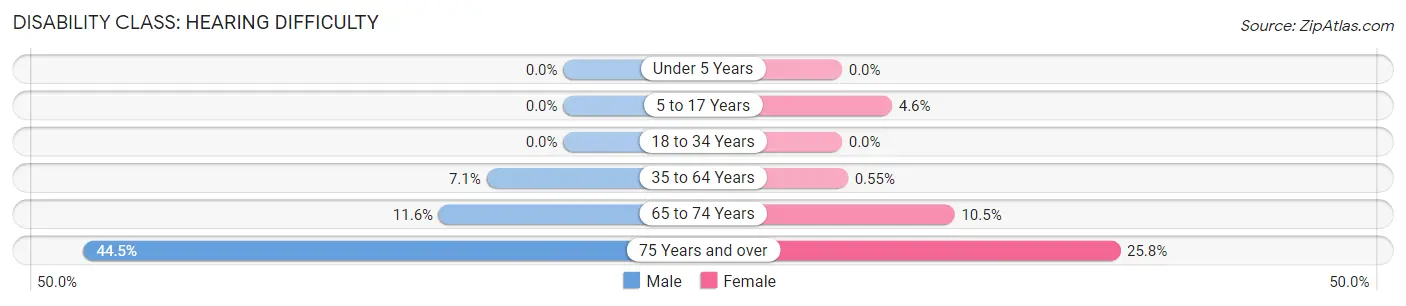
| Age Bracket | Male | Female |
| Under 5 Years | 0 (0.0%) | 0 (0.0%) |
| 5 to 17 Years | 0 (0.0%) | 25 (4.6%) |
| 18 to 34 Years | 0 (0.0%) | 0 (0.0%) |
| 35 to 64 Years | 113 (7.1%) | 8 (0.5%) |
| 65 to 74 Years | 29 (11.6%) | 34 (10.5%) |
| 75 Years and over | 134 (44.5%) | 142 (25.8%) |
Disability Class: Vision Difficulty
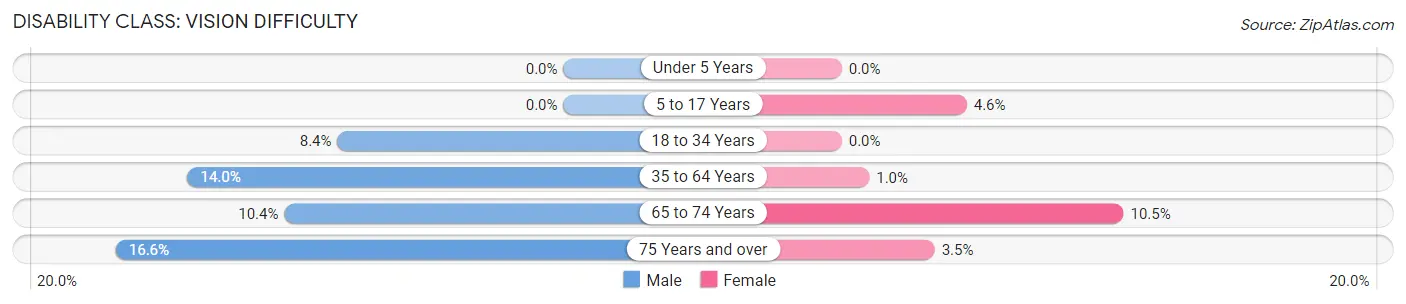
| Age Bracket | Male | Female |
| Under 5 Years | 0 (0.0%) | 0 (0.0%) |
| 5 to 17 Years | 0 (0.0%) | 25 (4.6%) |
| 18 to 34 Years | 81 (8.4%) | 0 (0.0%) |
| 35 to 64 Years | 221 (14.0%) | 15 (1.0%) |
| 65 to 74 Years | 26 (10.4%) | 34 (10.5%) |
| 75 Years and over | 50 (16.6%) | 19 (3.5%) |
Disability Class: Cognitive Difficulty
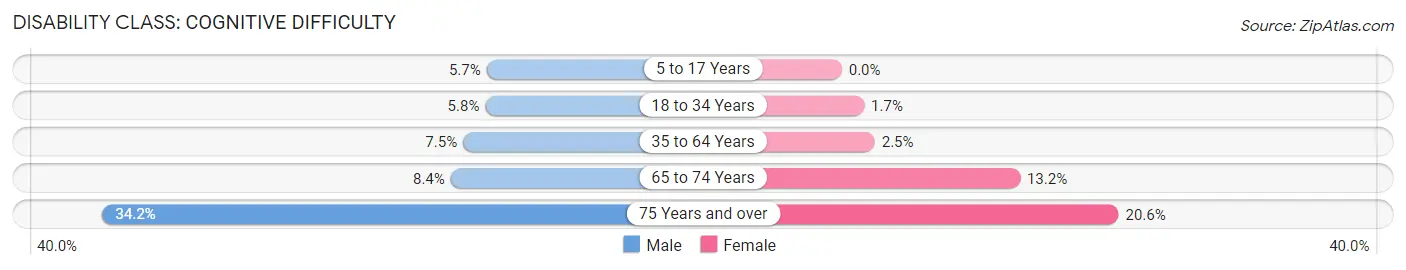
| Age Bracket | Male | Female |
| 5 to 17 Years | 34 (5.7%) | 0 (0.0%) |
| 18 to 34 Years | 56 (5.8%) | 20 (1.7%) |
| 35 to 64 Years | 118 (7.4%) | 36 (2.5%) |
| 65 to 74 Years | 21 (8.4%) | 43 (13.2%) |
| 75 Years and over | 103 (34.2%) | 113 (20.5%) |
Disability Class: Ambulatory Difficulty
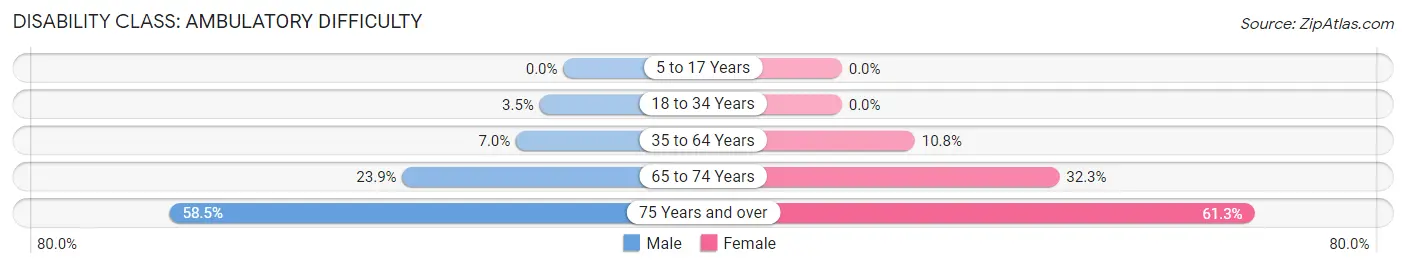
| Age Bracket | Male | Female |
| 5 to 17 Years | 0 (0.0%) | 0 (0.0%) |
| 18 to 34 Years | 34 (3.5%) | 0 (0.0%) |
| 35 to 64 Years | 111 (7.0%) | 159 (10.8%) |
| 65 to 74 Years | 60 (23.9%) | 105 (32.3%) |
| 75 Years and over | 176 (58.5%) | 337 (61.3%) |
Disability Class: Self-Care Difficulty
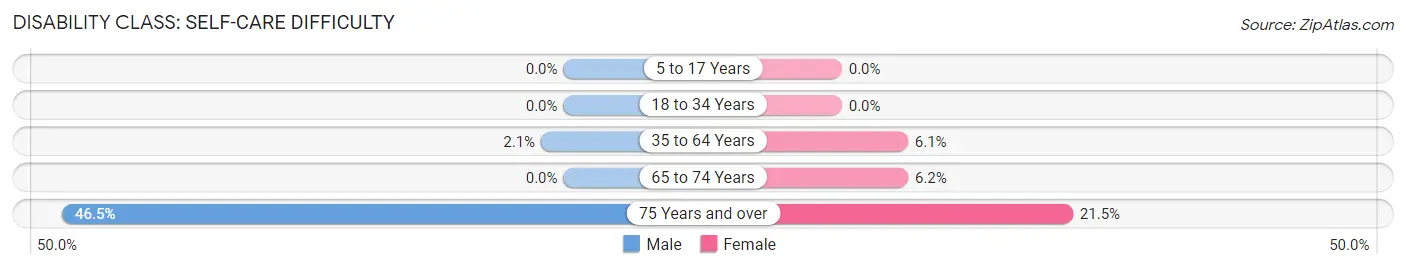
| Age Bracket | Male | Female |
| 5 to 17 Years | 0 (0.0%) | 0 (0.0%) |
| 18 to 34 Years | 0 (0.0%) | 0 (0.0%) |
| 35 to 64 Years | 33 (2.1%) | 90 (6.1%) |
| 65 to 74 Years | 0 (0.0%) | 20 (6.1%) |
| 75 Years and over | 140 (46.5%) | 118 (21.4%) |
Technology Access in Wharton
Computing Device Access in Wharton
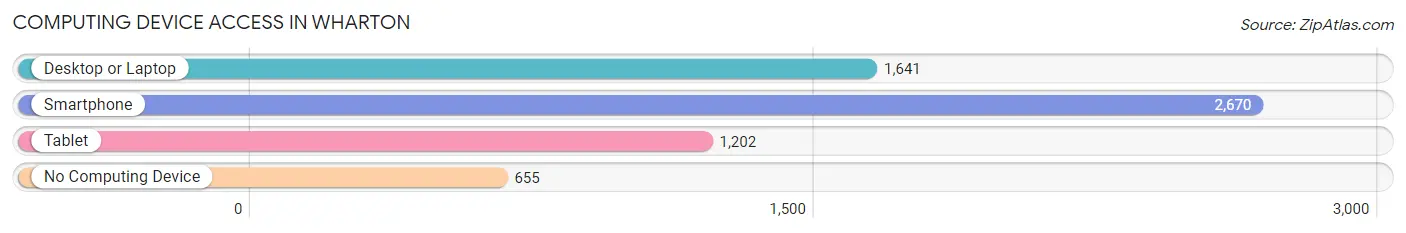
| Device Type | # Households | % Households |
| Desktop or Laptop | 1,641 | 47.3% |
| Smartphone | 2,670 | 77.0% |
| Tablet | 1,202 | 34.7% |
| No Computing Device | 655 | 18.9% |
| Total | 3,466 | 100.0% |
Internet Access in Wharton
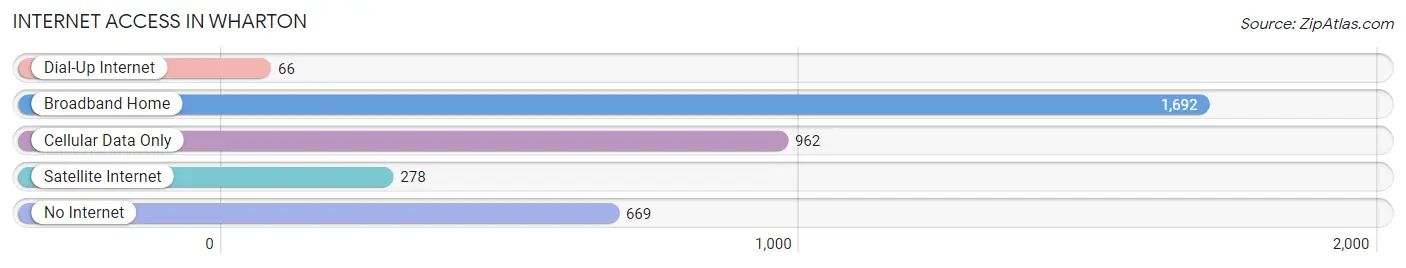
| Internet Type | # Households | % Households |
| Dial-Up Internet | 66 | 1.9% |
| Broadband Home | 1,692 | 48.8% |
| Cellular Data Only | 962 | 27.8% |
| Satellite Internet | 278 | 8.0% |
| No Internet | 669 | 19.3% |
| Total | 3,466 | 100.0% |
Wharton Summary
Wharton, Texas is a city located in Wharton County, Texas, United States. The population was 8,832 at the 2010 census. It is the county seat of Wharton County and is located on the Colorado River.
History
The area that is now Wharton was first settled in 1846 by a group of German immigrants led by John Meusebach. The settlement was originally called Meusebach’s Settlement, but was later changed to Wharton in honor of brothers William and John Wharton, who were prominent in the Texas Revolution.
Wharton was officially incorporated in 1858 and was designated as the county seat of Wharton County. The city quickly grew and by 1860, it had a population of 1,000. During the Civil War, Wharton was a major supply center for the Confederate Army.
Geography
Wharton is located at the intersection of U.S. Route 59 and State Highway 71, about 50 miles southwest of Houston. The city is situated on the Colorado River and is surrounded by several small lakes. The terrain is mostly flat with some rolling hills. The climate is humid subtropical, with hot summers and mild winters.
Economy
Wharton’s economy is largely based on agriculture and manufacturing. The city is home to several large food processing plants, including a Tyson Foods plant and a Cargill plant. Other major employers include Wharton County Junior College, Wharton Regional Medical Center, and the Wharton County Courthouse.
Demographics
As of the 2010 census, Wharton had a population of 8,832. The racial makeup of the city was 63.3% White, 24.2% Hispanic or Latino, 10.2% African American, and 2.3% other. The median household income was $35,945, and the median family income was $41,945.
Wharton is a diverse city with a rich history and a vibrant economy. It is a great place to live, work, and raise a family.
Common Questions
What is Per Capita Income in Wharton?
Per Capita income in Wharton is $23,247.
What is the Median Family Income in Wharton?
Median Family Income in Wharton is $65,893.
What is the Median Household income in Wharton?
Median Household Income in Wharton is $37,722.
What is Income or Wage Gap in Wharton?
Income or Wage Gap in Wharton is 49.2%.
Women in Wharton earn 50.8 cents for every dollar earned by a man.
What is Inequality or Gini Index in Wharton?
Inequality or Gini Index in Wharton is 0.46.
What is the Total Population of Wharton?
Total Population of Wharton is 8,669.
What is the Total Male Population of Wharton?
Total Male Population of Wharton is 4,134.
What is the Total Female Population of Wharton?
Total Female Population of Wharton is 4,535.
What is the Ratio of Males per 100 Females in Wharton?
There are 91.16 Males per 100 Females in Wharton.
What is the Ratio of Females per 100 Males in Wharton?
There are 109.70 Females per 100 Males in Wharton.
What is the Median Population Age in Wharton?
Median Population Age in Wharton is 36.0 Years.
What is the Average Family Size in Wharton
Average Family Size in Wharton is 3.5 People.
What is the Average Household Size in Wharton
Average Household Size in Wharton is 2.4 People.
How Large is the Labor Force in Wharton?
There are 4,002 People in the Labor Forcein in Wharton.
What is the Percentage of People in the Labor Force in Wharton?
57.8% of People are in the Labor Force in Wharton.
What is the Unemployment Rate in Wharton?
Unemployment Rate in Wharton is 4.9%.