New Boston, TX Map & Demographics
New Boston Map
New Boston Overview
$35,504
PER CAPITA INCOME
$61,676
AVG FAMILY INCOME
$59,030
AVG HOUSEHOLD INCOME
31.9%
WAGE / INCOME GAP [ % ]
68.1¢/ $1
WAGE / INCOME GAP [ $ ]
0.50
INEQUALITY / GINI INDEX
4,625
TOTAL POPULATION
2,346
MALE POPULATION
2,279
FEMALE POPULATION
102.94
MALES / 100 FEMALES
97.14
FEMALES / 100 MALES
38.4
MEDIAN AGE
3.3
AVG FAMILY SIZE
2.5
AVG HOUSEHOLD SIZE
2,163
LABOR FORCE [ PEOPLE ]
60.1%
PERCENT IN LABOR FORCE
7.3%
UNEMPLOYMENT RATE
New Boston Zip Codes
New Boston Area Codes
Income in New Boston
Income Overview in New Boston
Per Capita Income in New Boston is $35,504, while median incomes of families and households are $61,676 and $59,030 respectively.
| Characteristic | Number | Measure |
| Per Capita Income | 4,625 | $35,504 |
| Median Family Income | 1,011 | $61,676 |
| Mean Family Income | 1,011 | $83,015 |
| Median Household Income | 1,855 | $59,030 |
| Mean Household Income | 1,855 | $85,381 |
| Income Deficit | 1,011 | $0 |
| Wage / Income Gap (%) | 4,625 | 31.88% |
| Wage / Income Gap ($) | 4,625 | 68.12¢ per $1 |
| Gini / Inequality Index | 4,625 | 0.50 |
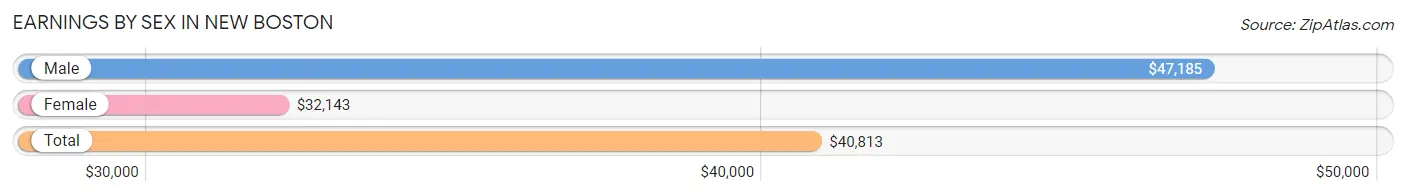
Earnings by Sex in New Boston
Average Earnings in New Boston are $40,813, $47,185 for men and $32,143 for women, a difference of 31.9%.
| Sex | Number | Average Earnings |
| Male | 1,104 (49.2%) | $47,185 |
| Female | 1,138 (50.8%) | $32,143 |
| Total | 2,242 (100.0%) | $40,813 |
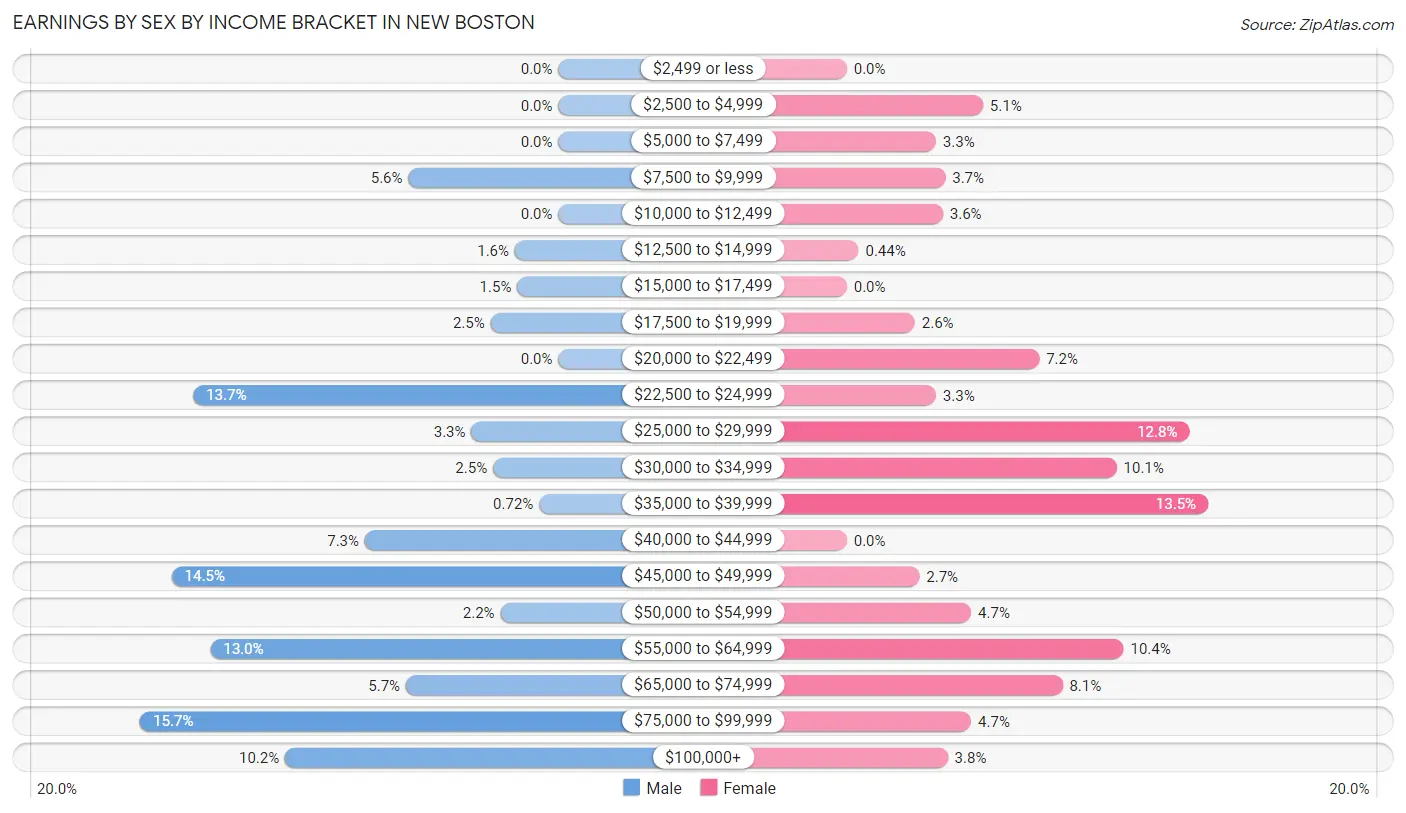
Earnings by Sex by Income Bracket in New Boston
The most common earnings brackets in New Boston are $75,000 to $99,999 for men (173 | 15.7%) and $35,000 to $39,999 for women (154 | 13.5%).
| Income | Male | Female |
| $2,499 or less | 0 (0.0%) | 0 (0.0%) |
| $2,500 to $4,999 | 0 (0.0%) | 58 (5.1%) |
| $5,000 to $7,499 | 0 (0.0%) | 38 (3.3%) |
| $7,500 to $9,999 | 62 (5.6%) | 42 (3.7%) |
| $10,000 to $12,499 | 0 (0.0%) | 41 (3.6%) |
| $12,500 to $14,999 | 18 (1.6%) | 5 (0.4%) |
| $15,000 to $17,499 | 17 (1.5%) | 0 (0.0%) |
| $17,500 to $19,999 | 28 (2.5%) | 29 (2.5%) |
| $20,000 to $22,499 | 0 (0.0%) | 82 (7.2%) |
| $22,500 to $24,999 | 151 (13.7%) | 38 (3.3%) |
| $25,000 to $29,999 | 36 (3.3%) | 146 (12.8%) |
| $30,000 to $34,999 | 27 (2.5%) | 115 (10.1%) |
| $35,000 to $39,999 | 8 (0.7%) | 154 (13.5%) |
| $40,000 to $44,999 | 80 (7.2%) | 0 (0.0%) |
| $45,000 to $49,999 | 160 (14.5%) | 31 (2.7%) |
| $50,000 to $54,999 | 24 (2.2%) | 53 (4.7%) |
| $55,000 to $64,999 | 144 (13.0%) | 118 (10.4%) |
| $65,000 to $74,999 | 63 (5.7%) | 92 (8.1%) |
| $75,000 to $99,999 | 173 (15.7%) | 53 (4.7%) |
| $100,000+ | 113 (10.2%) | 43 (3.8%) |
| Total | 1,104 (100.0%) | 1,138 (100.0%) |
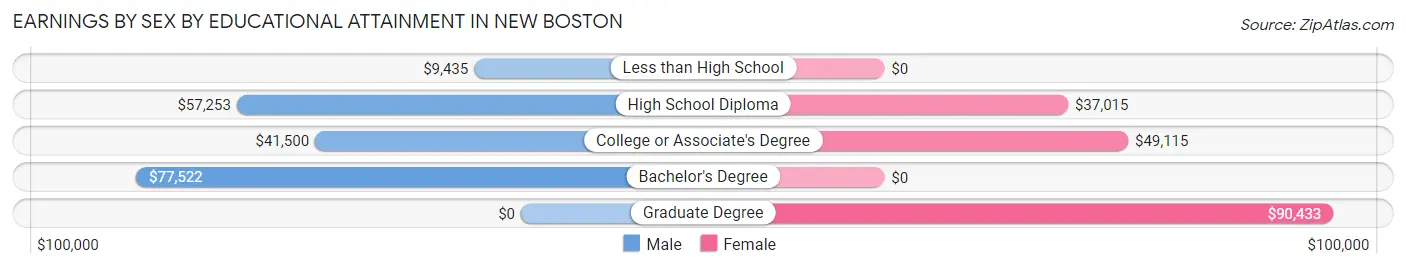
Earnings by Sex by Educational Attainment in New Boston
Average earnings in New Boston are $56,657 for men and $37,801 for women, a difference of 33.3%. Men with an educational attainment of bachelor's degree enjoy the highest average annual earnings of $77,522, while those with less than high school education earn the least with $9,435. Women with an educational attainment of graduate degree earn the most with the average annual earnings of $90,433, while those with high school diploma education have the smallest earnings of $37,015.
| Educational Attainment | Male Income | Female Income |
| Less than High School | $9,435 | $0 |
| High School Diploma | $57,253 | $37,015 |
| College or Associate's Degree | $41,500 | $49,115 |
| Bachelor's Degree | $77,522 | $0 |
| Graduate Degree | - | - |
| Total | $56,657 | $37,801 |
Family Income in New Boston
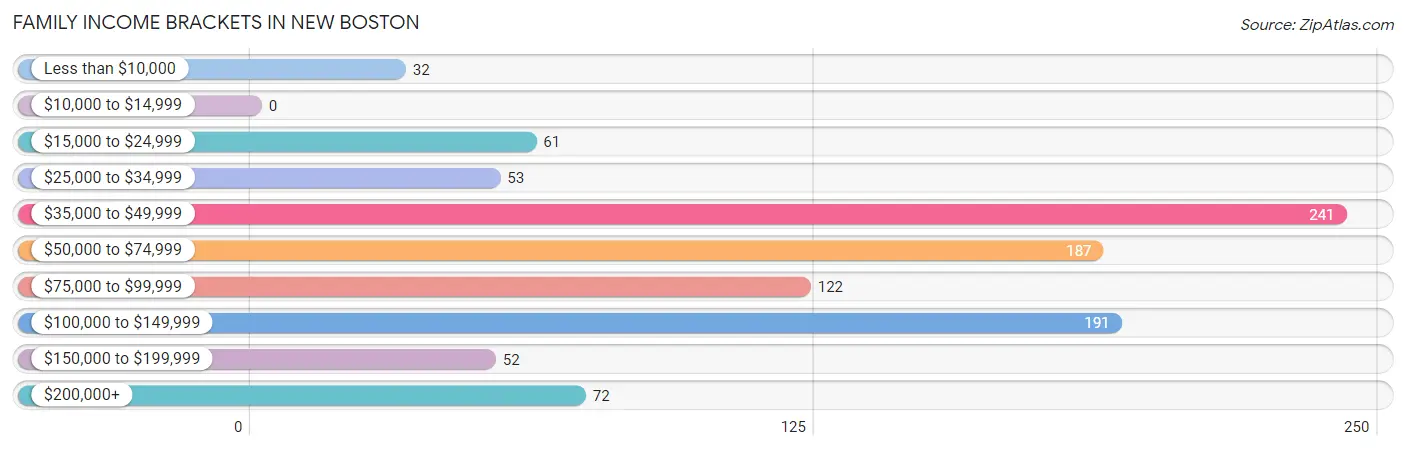
Family Income Brackets in New Boston
According to the New Boston family income data, there are 241 families falling into the $35,000 to $49,999 income range, which is the most common income bracket and makes up 23.8% of all families.
| Income Bracket | # Families | % Families |
| Less than $10,000 | 32 | 3.2% |
| $10,000 to $14,999 | 0 | 0.0% |
| $15,000 to $24,999 | 61 | 6.0% |
| $25,000 to $34,999 | 53 | 5.2% |
| $35,000 to $49,999 | 241 | 23.8% |
| $50,000 to $74,999 | 187 | 18.5% |
| $75,000 to $99,999 | 122 | 12.1% |
| $100,000 to $149,999 | 191 | 18.9% |
| $150,000 to $199,999 | 52 | 5.1% |
| $200,000+ | 72 | 7.1% |
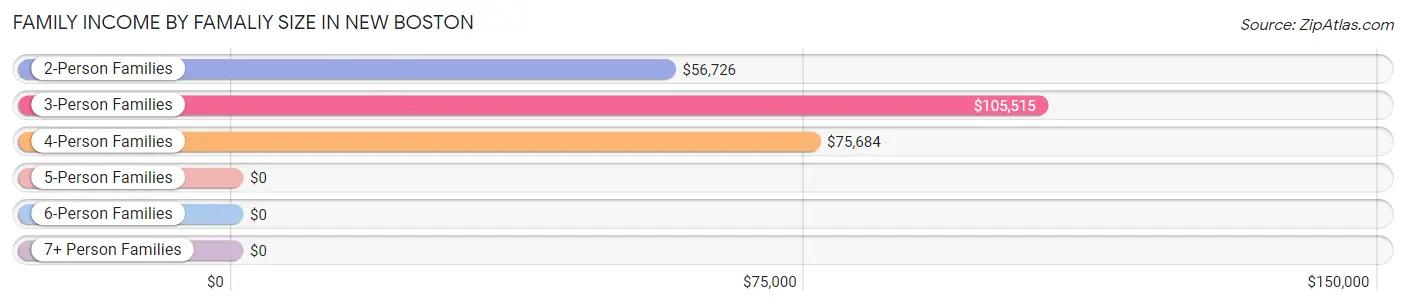
Family Income by Famaliy Size in New Boston
3-person families (187 | 18.5%) account for the highest median family income in New Boston with $105,515 per family, while 3-person families (187 | 18.5%) have the highest median income of $35,172 per family member.
| Income Bracket | # Families | Median Income |
| 2-Person Families | 429 (42.4%) | $56,726 |
| 3-Person Families | 187 (18.5%) | $105,515 |
| 4-Person Families | 321 (31.8%) | $75,684 |
| 5-Person Families | 16 (1.6%) | $0 |
| 6-Person Families | 23 (2.3%) | $0 |
| 7+ Person Families | 35 (3.5%) | $0 |
| Total | 1,011 (100.0%) | $61,676 |
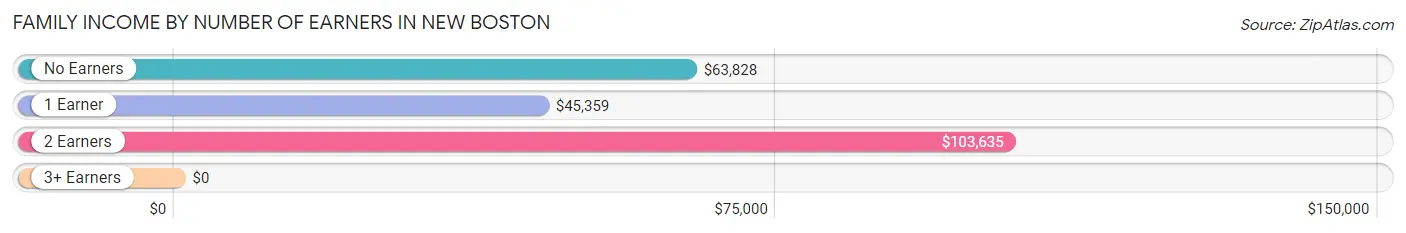
Family Income by Number of Earners in New Boston
| Number of Earners | # Families | Median Income |
| No Earners | 95 (9.4%) | $63,828 |
| 1 Earner | 463 (45.8%) | $45,359 |
| 2 Earners | 337 (33.3%) | $103,635 |
| 3+ Earners | 116 (11.5%) | $0 |
| Total | 1,011 (100.0%) | $61,676 |
Household Income in New Boston
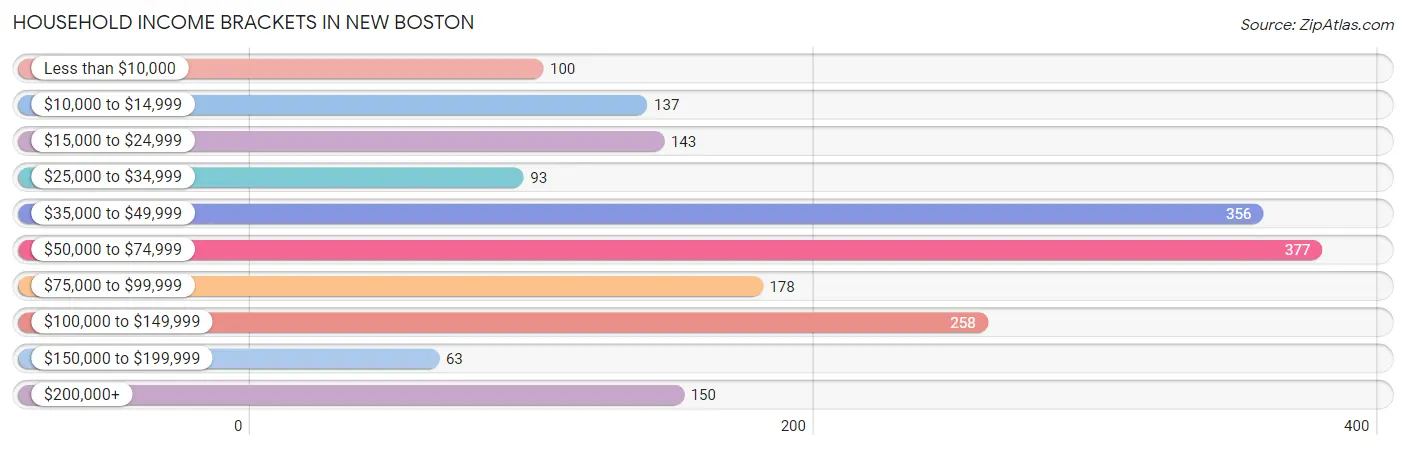
Household Income Brackets in New Boston
With 377 households falling in the category, the $50,000 to $74,999 income range is the most frequent in New Boston, accounting for 20.3% of all households. In contrast, only 63 households (3.4%) fall into the $150,000 to $199,999 income bracket, making it the least populous group.
| Income Bracket | # Households | % Households |
| Less than $10,000 | 100 | 5.4% |
| $10,000 to $14,999 | 137 | 7.4% |
| $15,000 to $24,999 | 143 | 7.7% |
| $25,000 to $34,999 | 93 | 5.0% |
| $35,000 to $49,999 | 356 | 19.2% |
| $50,000 to $74,999 | 377 | 20.3% |
| $75,000 to $99,999 | 178 | 9.6% |
| $100,000 to $149,999 | 258 | 13.9% |
| $150,000 to $199,999 | 63 | 3.4% |
| $200,000+ | 150 | 8.1% |
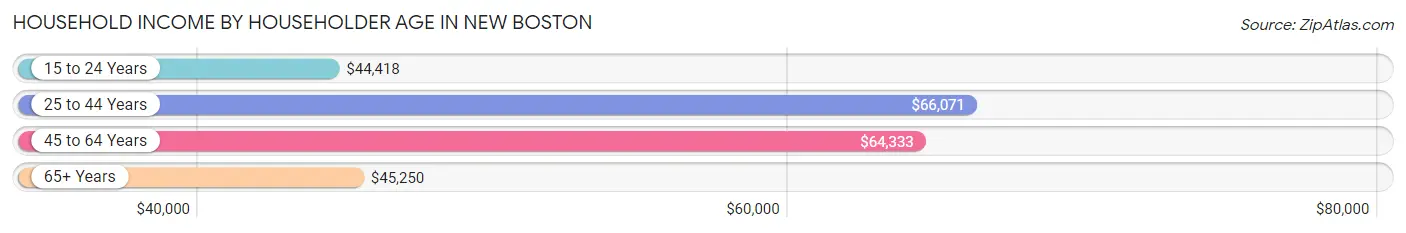
Household Income by Householder Age in New Boston
The median household income in New Boston is $59,030, with the highest median household income of $66,071 found in the 25 to 44 years age bracket for the primary householder. A total of 504 households (27.2%) fall into this category. Meanwhile, the 15 to 24 years age bracket for the primary householder has the lowest median household income of $44,418, with 109 households (5.9%) in this group.
| Income Bracket | # Households | Median Income |
| 15 to 24 Years | 109 (5.9%) | $44,418 |
| 25 to 44 Years | 504 (27.2%) | $66,071 |
| 45 to 64 Years | 672 (36.2%) | $64,333 |
| 65+ Years | 570 (30.7%) | $45,250 |
| Total | 1,855 (100.0%) | $59,030 |
Poverty in New Boston
Income Below Poverty by Sex and Age in New Boston
With 17.7% poverty level for males and 24.5% for females among the residents of New Boston, 16 and 17 year old males and 5 year old females are the most vulnerable to poverty, with 13 males (100.0%) and 37 females (100.0%) in their respective age groups living below the poverty level.
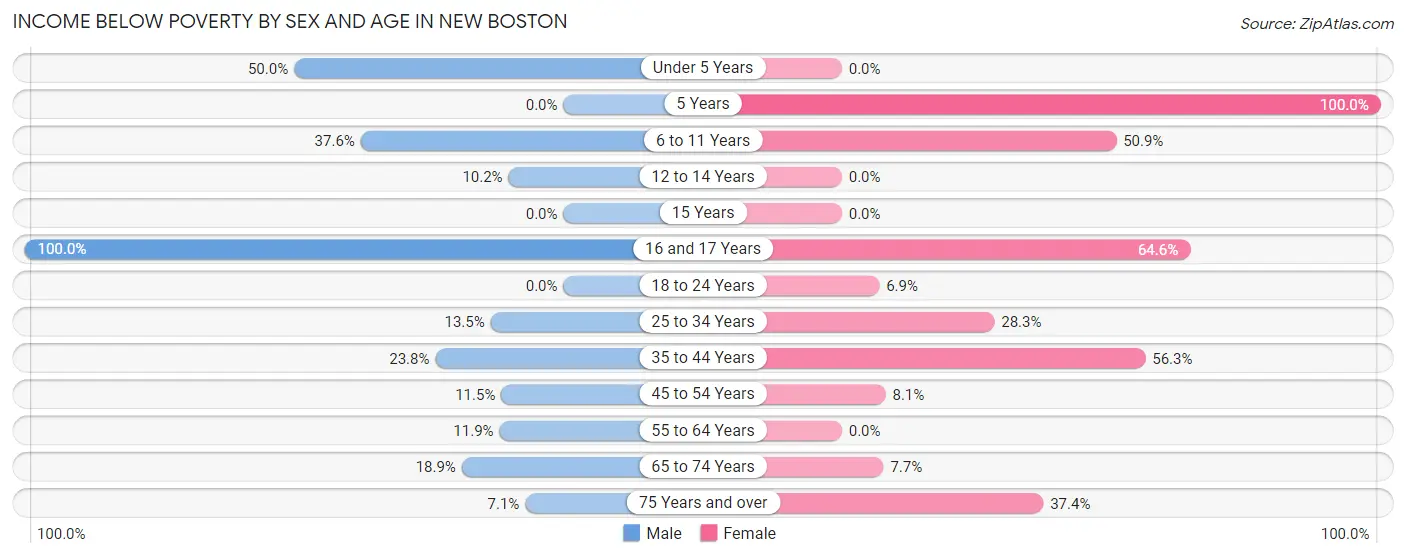
| Age Bracket | Male | Female |
| Under 5 Years | 82 (50.0%) | 0 (0.0%) |
| 5 Years | 0 (0.0%) | 37 (100.0%) |
| 6 to 11 Years | 79 (37.6%) | 109 (50.9%) |
| 12 to 14 Years | 16 (10.2%) | 0 (0.0%) |
| 15 Years | 0 (0.0%) | 0 (0.0%) |
| 16 and 17 Years | 13 (100.0%) | 42 (64.6%) |
| 18 to 24 Years | 0 (0.0%) | 20 (6.9%) |
| 25 to 34 Years | 35 (13.5%) | 45 (28.3%) |
| 35 to 44 Years | 82 (23.8%) | 169 (56.3%) |
| 45 to 54 Years | 37 (11.5%) | 32 (8.1%) |
| 55 to 64 Years | 26 (11.9%) | 0 (0.0%) |
| 65 to 74 Years | 30 (18.9%) | 13 (7.7%) |
| 75 Years and over | 16 (7.1%) | 86 (37.4%) |
| Total | 416 (17.7%) | 553 (24.5%) |
Income Above Poverty by Sex and Age in New Boston
According to the poverty statistics in New Boston, males aged 5 years and females aged under 5 years are the age groups that are most secure financially, with 100.0% of males and 100.0% of females in these age groups living above the poverty line.
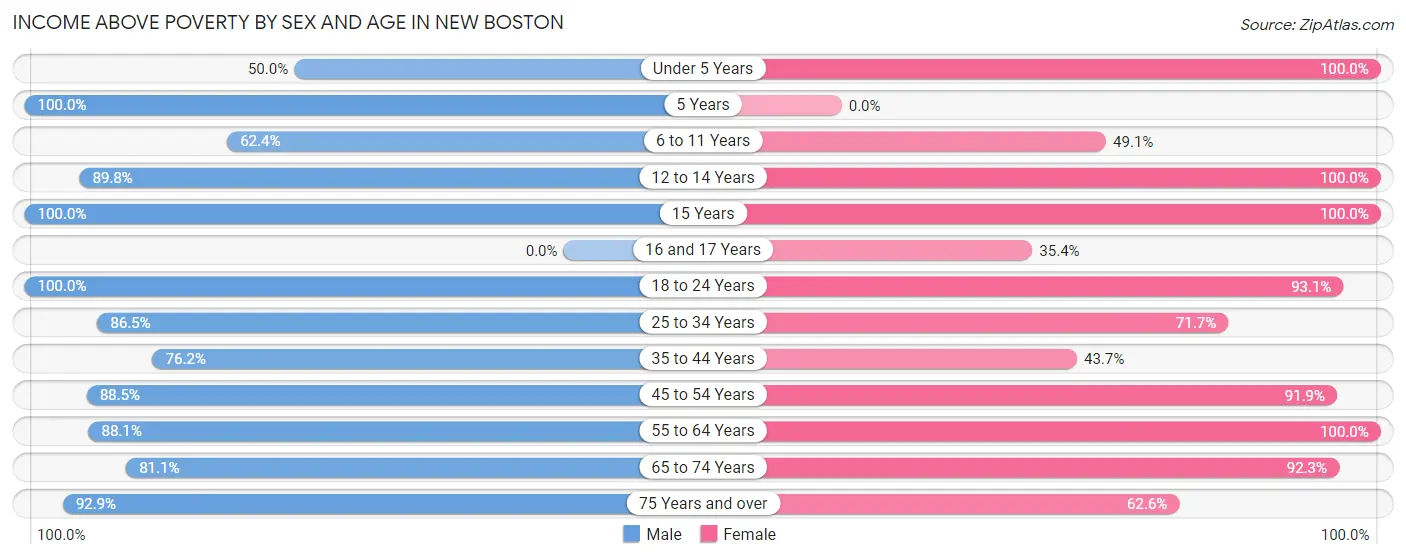
| Age Bracket | Male | Female |
| Under 5 Years | 82 (50.0%) | 58 (100.0%) |
| 5 Years | 19 (100.0%) | 0 (0.0%) |
| 6 to 11 Years | 131 (62.4%) | 105 (49.1%) |
| 12 to 14 Years | 141 (89.8%) | 62 (100.0%) |
| 15 Years | 16 (100.0%) | 89 (100.0%) |
| 16 and 17 Years | 0 (0.0%) | 23 (35.4%) |
| 18 to 24 Years | 238 (100.0%) | 268 (93.1%) |
| 25 to 34 Years | 224 (86.5%) | 114 (71.7%) |
| 35 to 44 Years | 263 (76.2%) | 131 (43.7%) |
| 45 to 54 Years | 284 (88.5%) | 362 (91.9%) |
| 55 to 64 Years | 193 (88.1%) | 193 (100.0%) |
| 65 to 74 Years | 129 (81.1%) | 155 (92.3%) |
| 75 Years and over | 210 (92.9%) | 144 (62.6%) |
| Total | 1,930 (82.3%) | 1,704 (75.5%) |
Income Below Poverty Among Married-Couple Families in New Boston
The poverty statistics for married-couple families in New Boston show that 0.8% or 5 of the total 605 families live below the poverty line. Families with no children have the highest poverty rate of 1.3%, comprising of 5 families. On the other hand, families with 1 or 2 children have the lowest poverty rate of 0.0%, which includes 0 families.
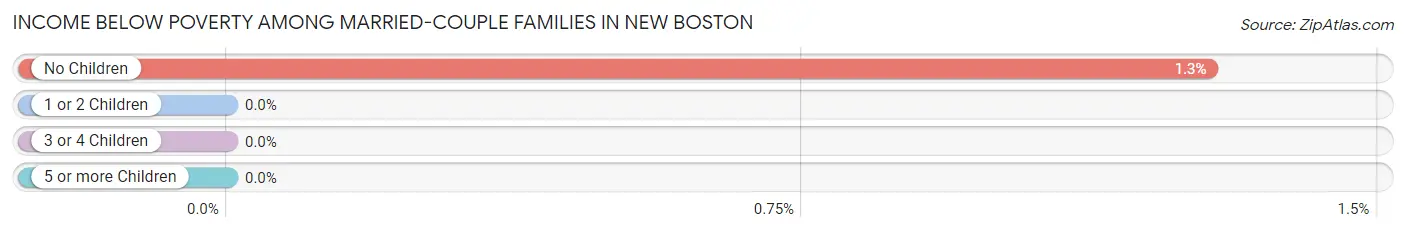
| Children | Above Poverty | Below Poverty |
| No Children | 387 (98.7%) | 5 (1.3%) |
| 1 or 2 Children | 174 (100.0%) | 0 (0.0%) |
| 3 or 4 Children | 39 (100.0%) | 0 (0.0%) |
| 5 or more Children | 0 (0.0%) | 0 (0.0%) |
| Total | 600 (99.2%) | 5 (0.8%) |
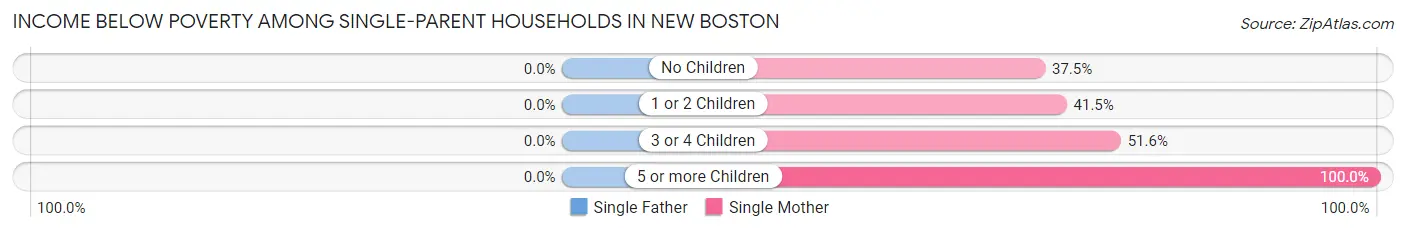
Income Below Poverty Among Single-Parent Households in New Boston
| Children | Single Father | Single Mother |
| No Children | 0 (0.0%) | 21 (37.5%) |
| 1 or 2 Children | 0 (0.0%) | 49 (41.5%) |
| 3 or 4 Children | 0 (0.0%) | 16 (51.6%) |
| 5 or more Children | 0 (0.0%) | 35 (100.0%) |
| Total | 0 (0.0%) | 121 (50.4%) |
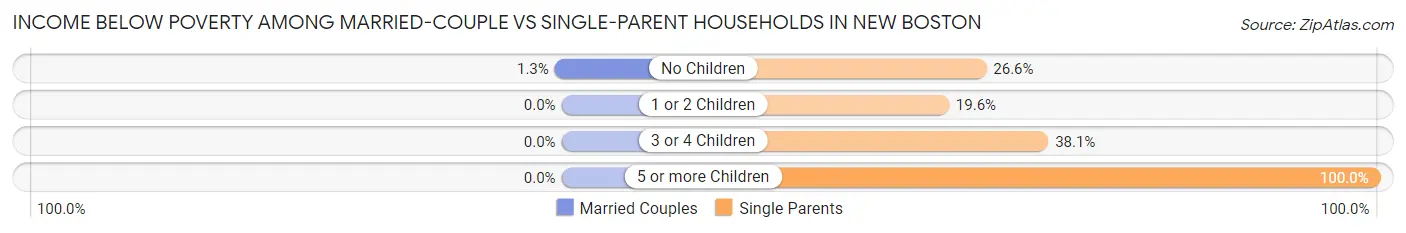
Income Below Poverty Among Married-Couple vs Single-Parent Households in New Boston
The poverty data for New Boston shows that 5 of the married-couple family households (0.8%) and 121 of the single-parent households (29.8%) are living below the poverty level. Within the married-couple family households, those with no children have the highest poverty rate, with 5 households (1.3%) falling below the poverty line. Among the single-parent households, those with 5 or more children have the highest poverty rate, with 35 household (100.0%) living below poverty.
| Children | Married-Couple Families | Single-Parent Households |
| No Children | 5 (1.3%) | 21 (26.6%) |
| 1 or 2 Children | 0 (0.0%) | 49 (19.6%) |
| 3 or 4 Children | 0 (0.0%) | 16 (38.1%) |
| 5 or more Children | 0 (0.0%) | 35 (100.0%) |
| Total | 5 (0.8%) | 121 (29.8%) |
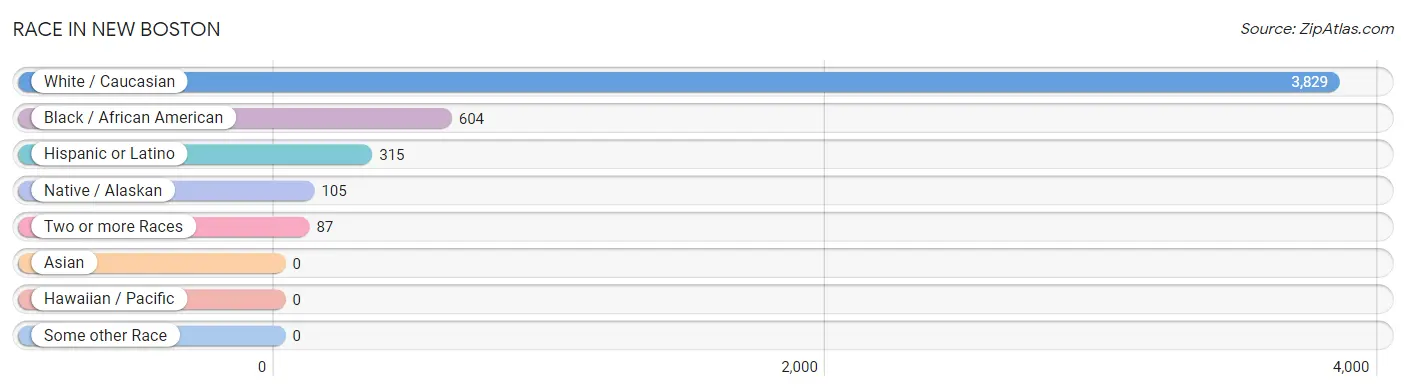
Race in New Boston
The most populous races in New Boston are White / Caucasian (3,829 | 82.8%), Black / African American (604 | 13.1%), and Hispanic or Latino (315 | 6.8%).
| Race | # Population | % Population |
| Asian | 0 | 0.0% |
| Black / African American | 604 | 13.1% |
| Hawaiian / Pacific | 0 | 0.0% |
| Hispanic or Latino | 315 | 6.8% |
| Native / Alaskan | 105 | 2.3% |
| White / Caucasian | 3,829 | 82.8% |
| Two or more Races | 87 | 1.9% |
| Some other Race | 0 | 0.0% |
| Total | 4,625 | 100.0% |
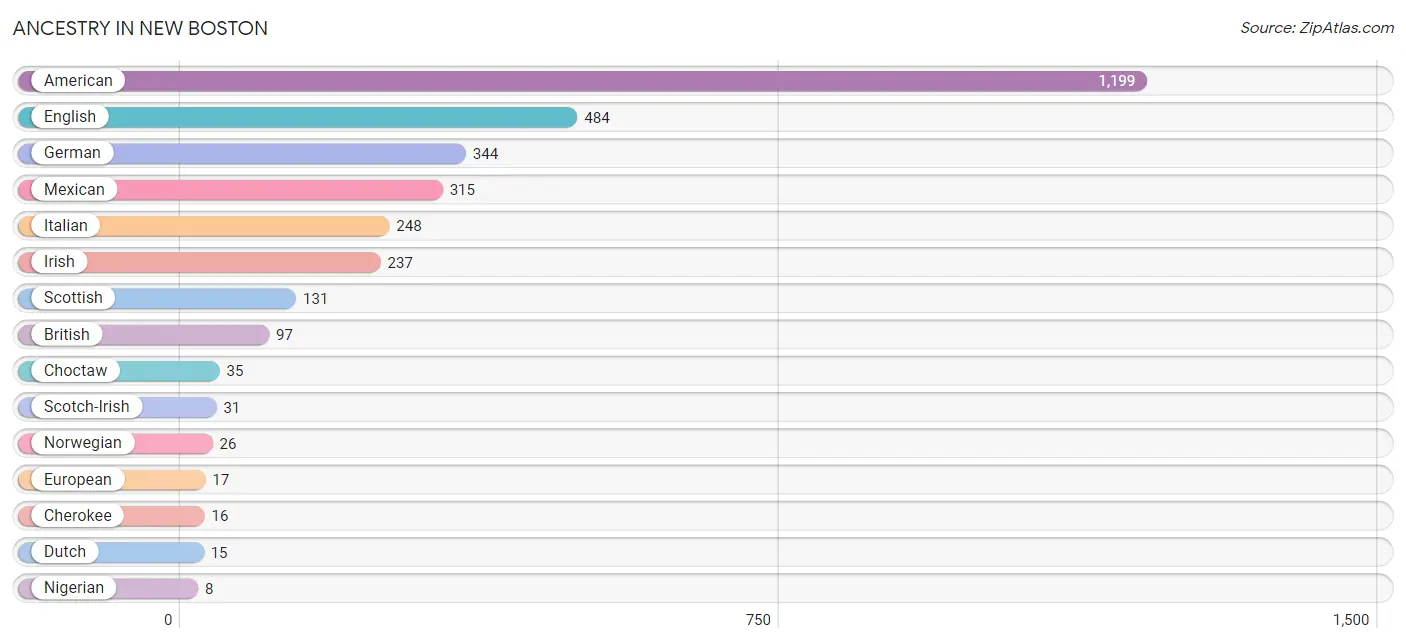
Ancestry in New Boston
The most populous ancestries reported in New Boston are American (1,199 | 25.9%), English (484 | 10.5%), German (344 | 7.4%), Mexican (315 | 6.8%), and Italian (248 | 5.4%), together accounting for 56.0% of all New Boston residents.
| Ancestry | # Population | % Population |
| American | 1,199 | 25.9% |
| British | 97 | 2.1% |
| Cherokee | 16 | 0.4% |
| Choctaw | 35 | 0.8% |
| Dutch | 15 | 0.3% |
| English | 484 | 10.5% |
| European | 17 | 0.4% |
| German | 344 | 7.4% |
| Irish | 237 | 5.1% |
| Italian | 248 | 5.4% |
| Mexican | 315 | 6.8% |
| Nigerian | 8 | 0.2% |
| Norwegian | 26 | 0.6% |
| Scotch-Irish | 31 | 0.7% |
| Scottish | 131 | 2.8% |
| Subsaharan African | 8 | 0.2% |
| Swedish | 6 | 0.1% | View All 17 Rows |
Immigrants in New Boston
The most numerous immigrant groups reported in New Boston came from Europe (87 | 1.9%), Italy (55 | 1.2%), Southern Europe (55 | 1.2%), Central America (35 | 0.8%), and Latin America (35 | 0.8%), together accounting for 5.8% of all New Boston residents.
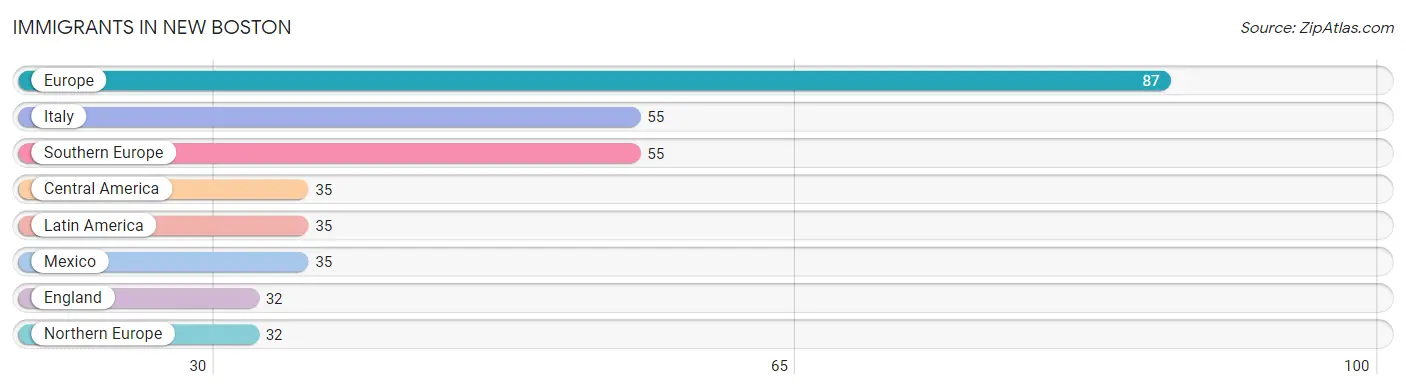
| Immigration Origin | # Population | % Population |
| Central America | 35 | 0.8% |
| England | 32 | 0.7% |
| Europe | 87 | 1.9% |
| Italy | 55 | 1.2% |
| Latin America | 35 | 0.8% |
| Mexico | 35 | 0.8% |
| Northern Europe | 32 | 0.7% |
| Southern Europe | 55 | 1.2% | View All 8 Rows |
Sex and Age in New Boston
Sex and Age in New Boston
The most populous age groups in New Boston are 10 to 14 Years (266 | 11.3%) for men and 50 to 54 Years (358 | 15.7%) for women.
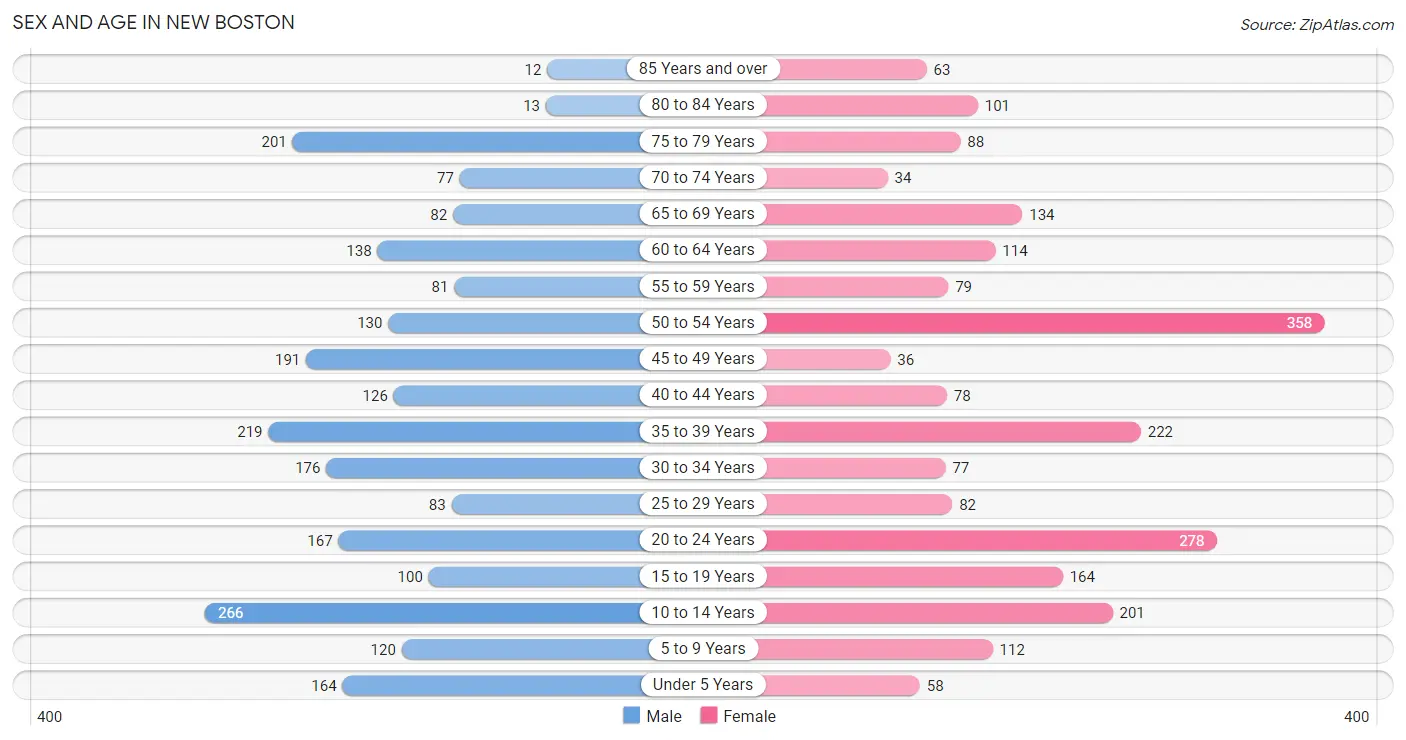
| Age Bracket | Male | Female |
| Under 5 Years | 164 (7.0%) | 58 (2.5%) |
| 5 to 9 Years | 120 (5.1%) | 112 (4.9%) |
| 10 to 14 Years | 266 (11.3%) | 201 (8.8%) |
| 15 to 19 Years | 100 (4.3%) | 164 (7.2%) |
| 20 to 24 Years | 167 (7.1%) | 278 (12.2%) |
| 25 to 29 Years | 83 (3.5%) | 82 (3.6%) |
| 30 to 34 Years | 176 (7.5%) | 77 (3.4%) |
| 35 to 39 Years | 219 (9.3%) | 222 (9.7%) |
| 40 to 44 Years | 126 (5.4%) | 78 (3.4%) |
| 45 to 49 Years | 191 (8.1%) | 36 (1.6%) |
| 50 to 54 Years | 130 (5.5%) | 358 (15.7%) |
| 55 to 59 Years | 81 (3.5%) | 79 (3.5%) |
| 60 to 64 Years | 138 (5.9%) | 114 (5.0%) |
| 65 to 69 Years | 82 (3.5%) | 134 (5.9%) |
| 70 to 74 Years | 77 (3.3%) | 34 (1.5%) |
| 75 to 79 Years | 201 (8.6%) | 88 (3.9%) |
| 80 to 84 Years | 13 (0.5%) | 101 (4.4%) |
| 85 Years and over | 12 (0.5%) | 63 (2.8%) |
| Total | 2,346 (100.0%) | 2,279 (100.0%) |
Families and Households in New Boston
Median Family Size in New Boston
The median family size in New Boston is 3.34 persons per family, with single female/mother families (240 | 23.7%) accounting for the largest median family size of 4.12 persons per family. On the other hand, single male/father families (166 | 16.4%) represent the smallest median family size with 3.08 persons per family.
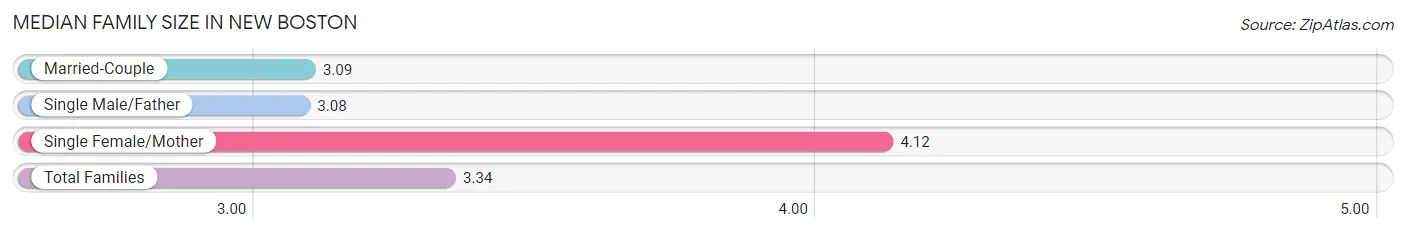
| Family Type | # Families | Family Size |
| Married-Couple | 605 (59.8%) | 3.09 |
| Single Male/Father | 166 (16.4%) | 3.08 |
| Single Female/Mother | 240 (23.7%) | 4.12 |
| Total Families | 1,011 (100.0%) | 3.34 |
Median Household Size in New Boston
The median household size in New Boston is 2.48 persons per household, with single female/mother households (240 | 12.9%) accounting for the largest median household size of 4.43 persons per household. non-family households (844 | 45.5%) represent the smallest median household size with 1.20 persons per household.
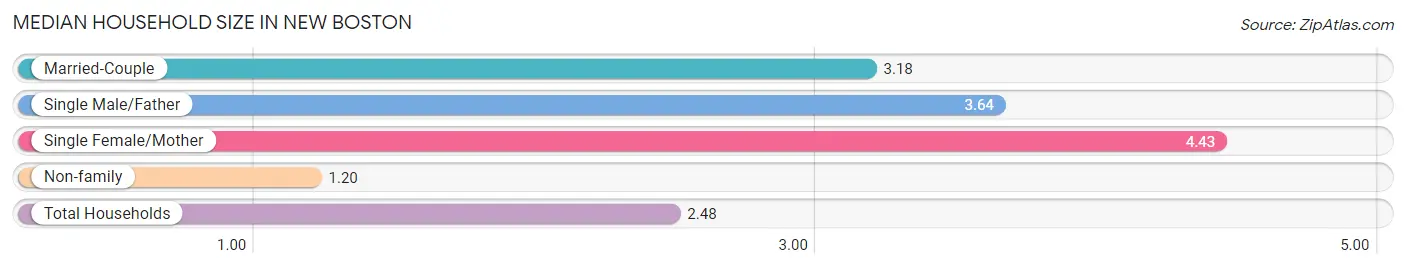
| Household Type | # Households | Household Size |
| Married-Couple | 605 (32.6%) | 3.18 |
| Single Male/Father | 166 (8.9%) | 3.64 |
| Single Female/Mother | 240 (12.9%) | 4.43 |
| Non-family | 844 (45.5%) | 1.20 |
| Total Households | 1,855 (100.0%) | 2.48 |
Household Size by Marriage Status in New Boston
Out of a total of 1,855 households in New Boston, 1,011 (54.5%) are family households, while 844 (45.5%) are nonfamily households. The most numerous type of family households are 2-person households, comprising 370, and the most common type of nonfamily households are 1-person households, comprising 702.
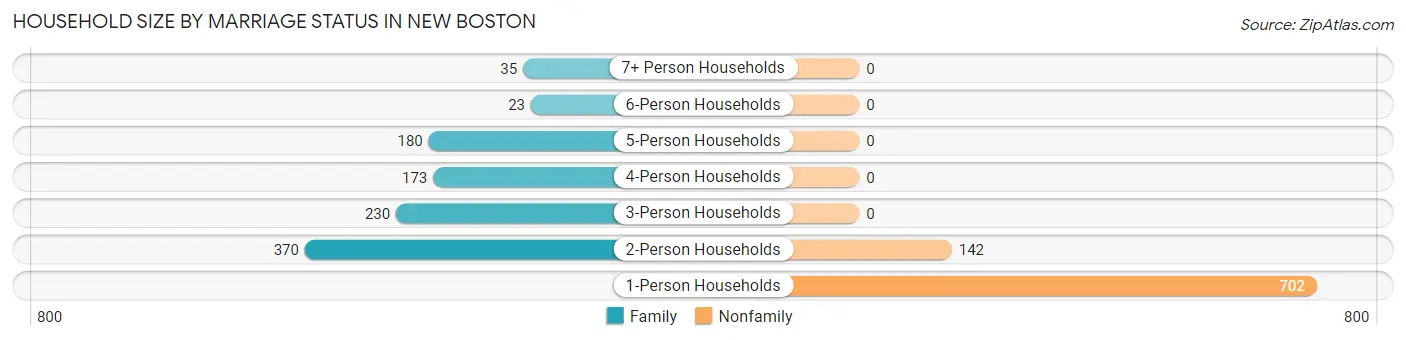
| Household Size | Family Households | Nonfamily Households |
| 1-Person Households | - | 702 (37.8%) |
| 2-Person Households | 370 (20.0%) | 142 (7.6%) |
| 3-Person Households | 230 (12.4%) | 0 (0.0%) |
| 4-Person Households | 173 (9.3%) | 0 (0.0%) |
| 5-Person Households | 180 (9.7%) | 0 (0.0%) |
| 6-Person Households | 23 (1.2%) | 0 (0.0%) |
| 7+ Person Households | 35 (1.9%) | 0 (0.0%) |
| Total | 1,011 (54.5%) | 844 (45.5%) |
Female Fertility in New Boston
Fertility by Age in New Boston
Average fertility rate in New Boston is 8.0 births per 1,000 women. Women in the age bracket of 20 to 34 years have the highest fertility rate with 18.0 births per 1,000 women. Women in the age bracket of 20 to 34 years acount for 100.0% of all women with births.
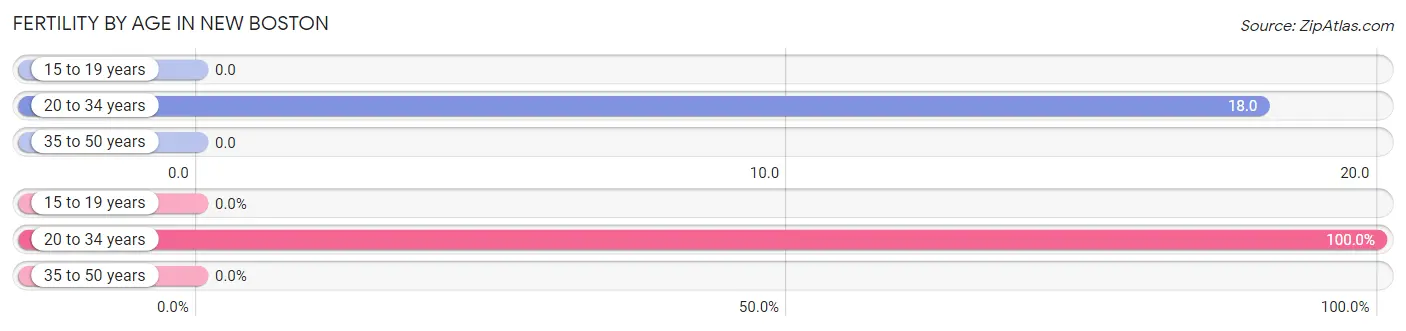
| Age Bracket | Women with Births | Births / 1,000 Women |
| 15 to 19 years | 0 (0.0%) | 0.0 |
| 20 to 34 years | 8 (100.0%) | 18.0 |
| 35 to 50 years | 0 (0.0%) | 0.0 |
| Total | 8 (100.0%) | 8.0 |
Fertility by Age by Marriage Status in New Boston
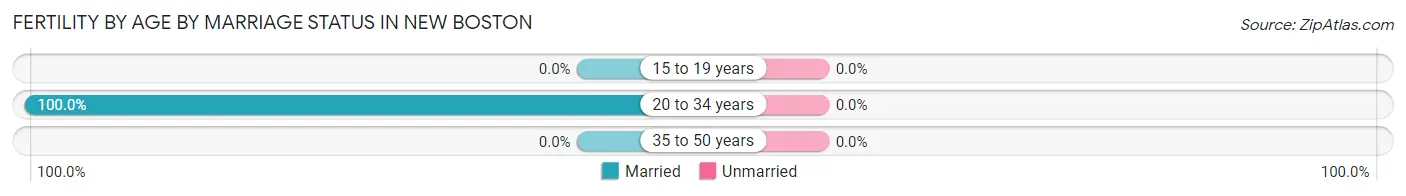
| Age Bracket | Married | Unmarried |
| 15 to 19 years | 0 (0.0%) | 0 (0.0%) |
| 20 to 34 years | 8 (100.0%) | 0 (0.0%) |
| 35 to 50 years | 0 (0.0%) | 0 (0.0%) |
| Total | 8 (100.0%) | 0 (0.0%) |
Fertility by Education in New Boston
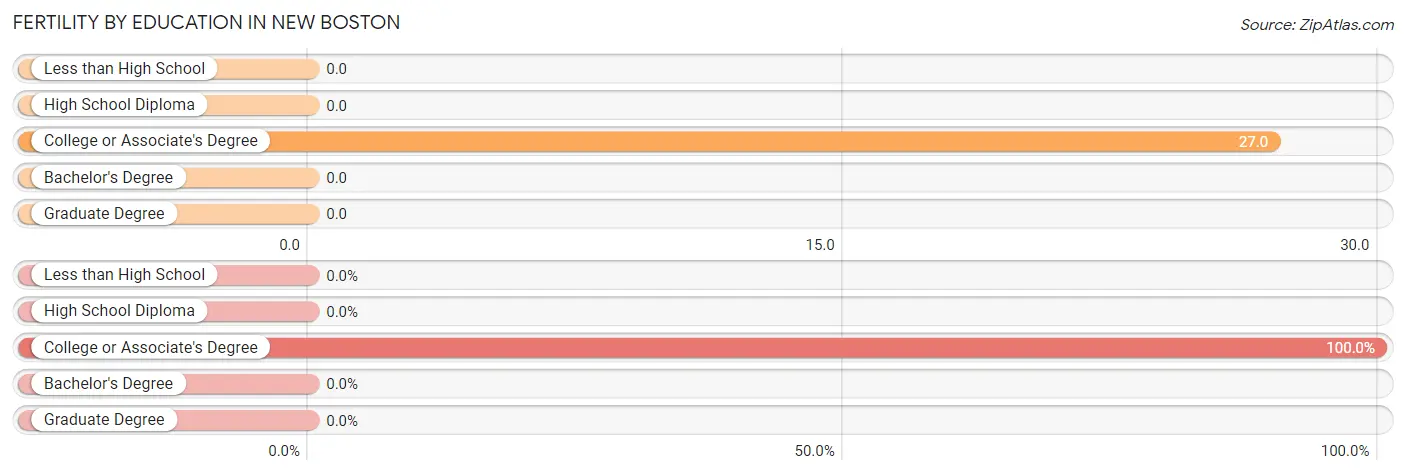
| Educational Attainment | Women with Births | Births / 1,000 Women |
| Less than High School | 0 (0.0%) | 0.0 |
| High School Diploma | 0 (0.0%) | 0.0 |
| College or Associate's Degree | 8 (100.0%) | 27.0 |
| Bachelor's Degree | 0 (0.0%) | 0.0 |
| Graduate Degree | 0 (0.0%) | 0.0 |
| Total | 8 (100.0%) | 8.0 |
Fertility by Education by Marriage Status in New Boston
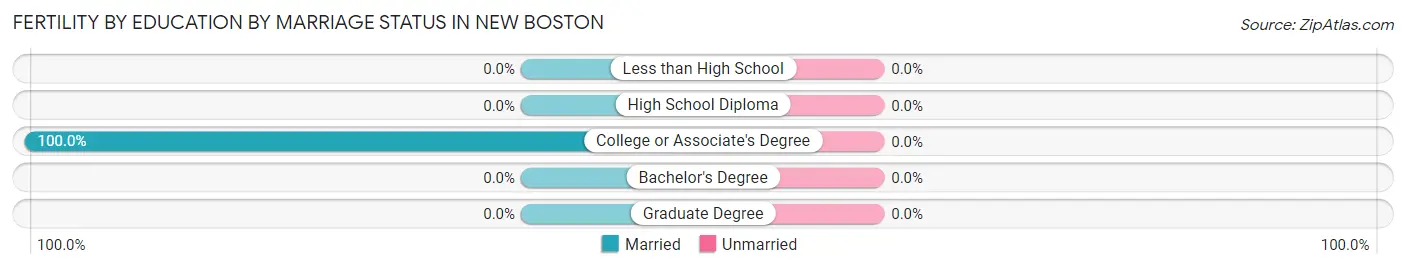
| Educational Attainment | Married | Unmarried |
| Less than High School | 0 (0.0%) | 0 (0.0%) |
| High School Diploma | 0 (0.0%) | 0 (0.0%) |
| College or Associate's Degree | 8 (100.0%) | 0 (0.0%) |
| Bachelor's Degree | 0 (0.0%) | 0 (0.0%) |
| Graduate Degree | 0 (0.0%) | 0 (0.0%) |
| Total | 8 (100.0%) | 0 (0.0%) |
Employment Characteristics in New Boston
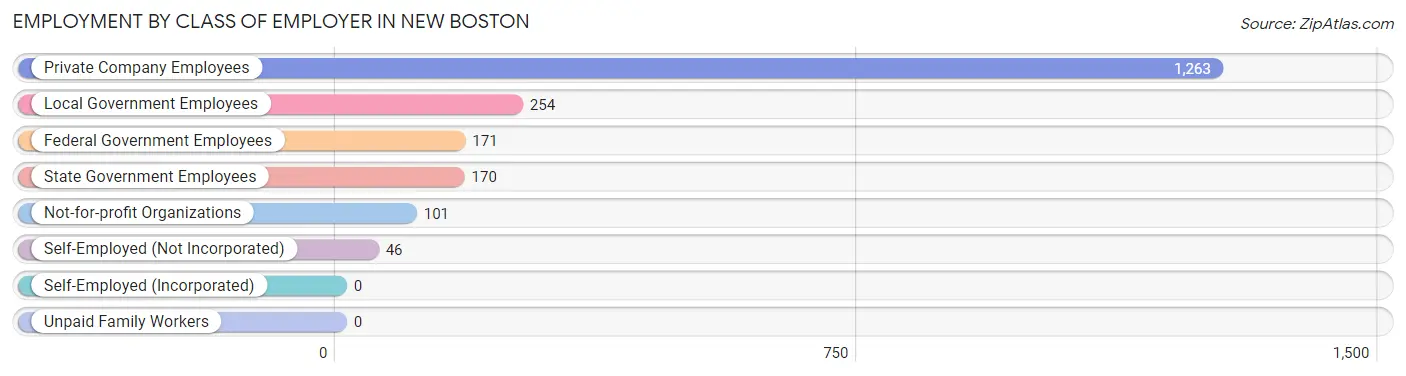
Employment by Class of Employer in New Boston
Among the 2,005 employed individuals in New Boston, private company employees (1,263 | 63.0%), local government employees (254 | 12.7%), and federal government employees (171 | 8.5%) make up the most common classes of employment.
| Employer Class | # Employees | % Employees |
| Private Company Employees | 1,263 | 63.0% |
| Self-Employed (Incorporated) | 0 | 0.0% |
| Self-Employed (Not Incorporated) | 46 | 2.3% |
| Not-for-profit Organizations | 101 | 5.0% |
| Local Government Employees | 254 | 12.7% |
| State Government Employees | 170 | 8.5% |
| Federal Government Employees | 171 | 8.5% |
| Unpaid Family Workers | 0 | 0.0% |
| Total | 2,005 | 100.0% |
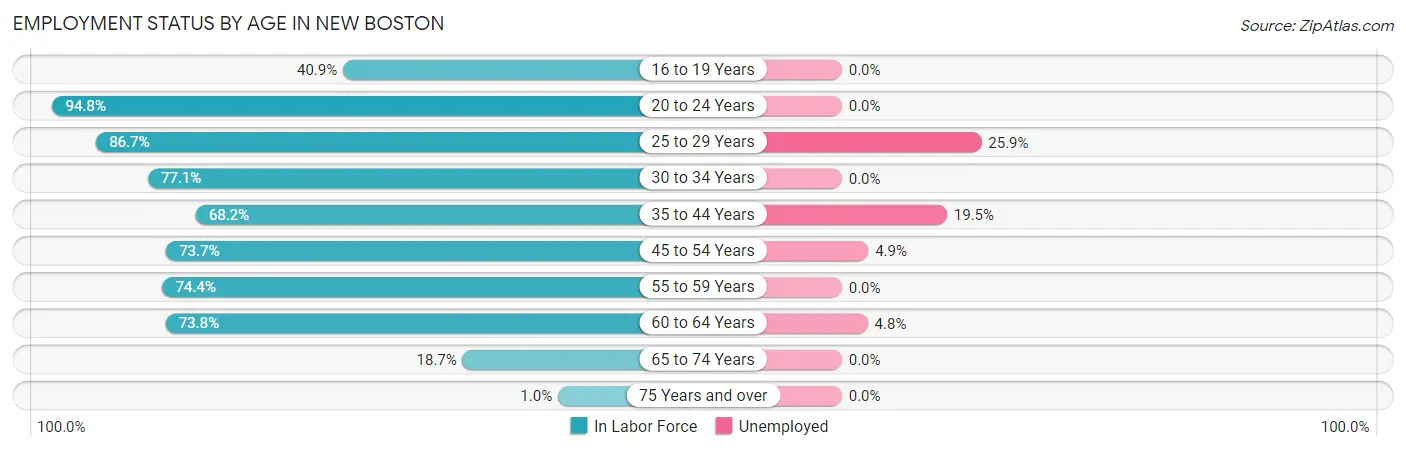
Employment Status by Age in New Boston
According to the labor force statistics for New Boston, out of the total population over 16 years of age (3,599), 60.1% or 2,163 individuals are in the labor force, with 7.3% or 158 of them unemployed. The age group with the highest labor force participation rate is 20 to 24 years, with 94.8% or 422 individuals in the labor force. Within the labor force, the 25 to 29 years age range has the highest percentage of unemployed individuals, with 25.9% or 37 of them being unemployed.
| Age Bracket | In Labor Force | Unemployed |
| 16 to 19 Years | 65 (40.9%) | 0 (0.0%) |
| 20 to 24 Years | 422 (94.8%) | 0 (0.0%) |
| 25 to 29 Years | 143 (86.7%) | 37 (25.9%) |
| 30 to 34 Years | 195 (77.1%) | 0 (0.0%) |
| 35 to 44 Years | 440 (68.2%) | 86 (19.5%) |
| 45 to 54 Years | 527 (73.7%) | 26 (4.9%) |
| 55 to 59 Years | 119 (74.4%) | 0 (0.0%) |
| 60 to 64 Years | 186 (73.8%) | 9 (4.8%) |
| 65 to 74 Years | 61 (18.7%) | 0 (0.0%) |
| 75 Years and over | 5 (1.0%) | 0 (0.0%) |
| Total | 2,163 (60.1%) | 158 (7.3%) |
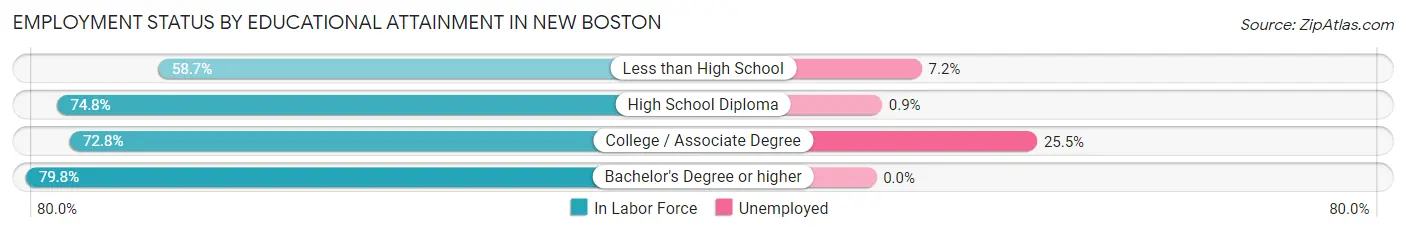
Employment Status by Educational Attainment in New Boston
According to labor force statistics for New Boston, 73.5% of individuals (1,610) out of the total population between 25 and 64 years of age (2,190) are in the labor force, with 9.8% or 158 of them being unemployed. The group with the highest labor force participation rate are those with the educational attainment of bachelor's degree or higher, with 79.8% or 344 individuals in the labor force. Within the labor force, individuals with college / associate degree education have the highest percentage of unemployment, with 25.5% or 144 of them being unemployed.
| Educational Attainment | In Labor Force | Unemployed |
| Less than High School | 125 (58.7%) | 15 (7.2%) |
| High School Diploma | 577 (74.8%) | 7 (0.9%) |
| College / Associate Degree | 564 (72.8%) | 198 (25.5%) |
| Bachelor's Degree or higher | 344 (79.8%) | 0 (0.0%) |
| Total | 1,610 (73.5%) | 215 (9.8%) |
Employment Occupations by Sex in New Boston
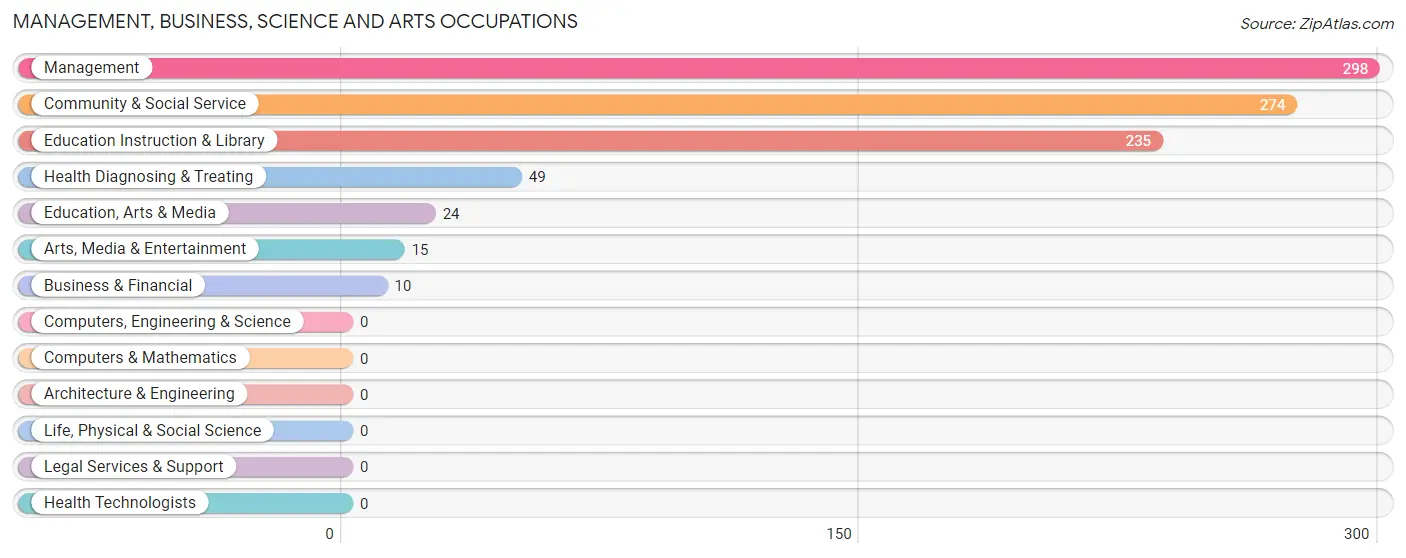
Management, Business, Science and Arts Occupations
The most common Management, Business, Science and Arts occupations in New Boston are Management (298 | 14.9%), Community & Social Service (274 | 13.7%), Education Instruction & Library (235 | 11.7%), Health Diagnosing & Treating (49 | 2.4%), and Education, Arts & Media (24 | 1.2%).
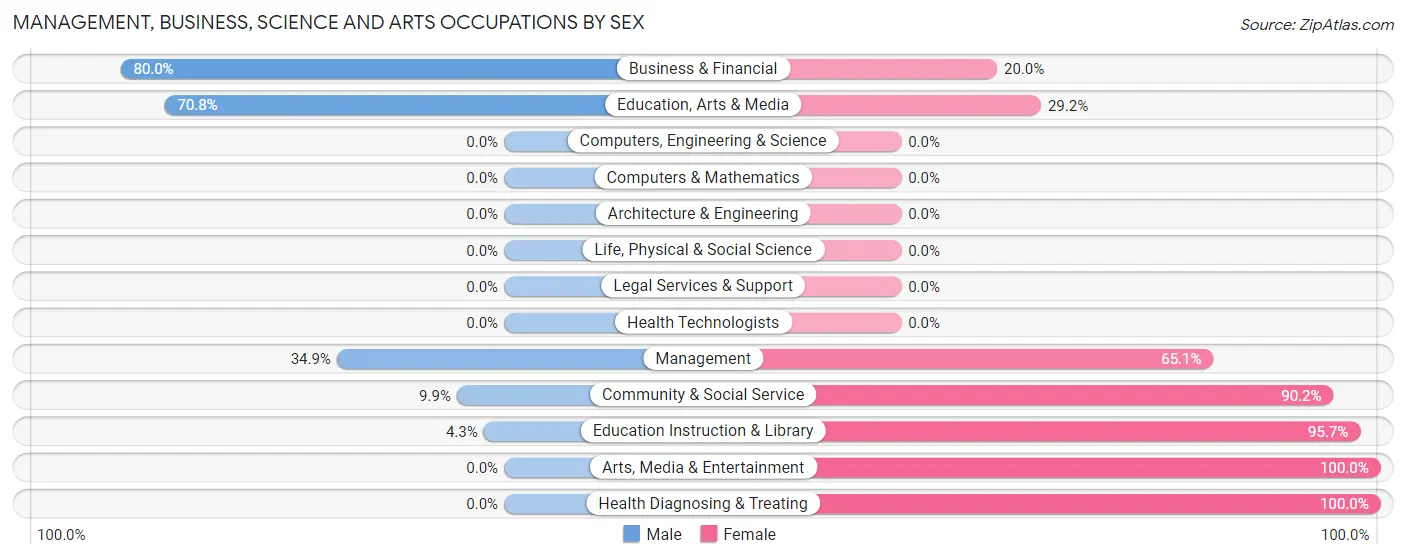
Management, Business, Science and Arts Occupations by Sex
Within the Management, Business, Science and Arts occupations in New Boston, the most male-oriented occupations are Business & Financial (80.0%), Education, Arts & Media (70.8%), and Management (34.9%), while the most female-oriented occupations are Arts, Media & Entertainment (100.0%), Health Diagnosing & Treating (100.0%), and Education Instruction & Library (95.7%).
| Occupation | Male | Female |
| Management | 104 (34.9%) | 194 (65.1%) |
| Business & Financial | 8 (80.0%) | 2 (20.0%) |
| Computers, Engineering & Science | 0 (0.0%) | 0 (0.0%) |
| Computers & Mathematics | 0 (0.0%) | 0 (0.0%) |
| Architecture & Engineering | 0 (0.0%) | 0 (0.0%) |
| Life, Physical & Social Science | 0 (0.0%) | 0 (0.0%) |
| Community & Social Service | 27 (9.9%) | 247 (90.1%) |
| Education, Arts & Media | 17 (70.8%) | 7 (29.2%) |
| Legal Services & Support | 0 (0.0%) | 0 (0.0%) |
| Education Instruction & Library | 10 (4.3%) | 225 (95.7%) |
| Arts, Media & Entertainment | 0 (0.0%) | 15 (100.0%) |
| Health Diagnosing & Treating | 0 (0.0%) | 49 (100.0%) |
| Health Technologists | 0 (0.0%) | 0 (0.0%) |
| Total (Category) | 139 (22.0%) | 492 (78.0%) |
| Total (Overall) | 1,005 (50.1%) | 1,000 (49.9%) |
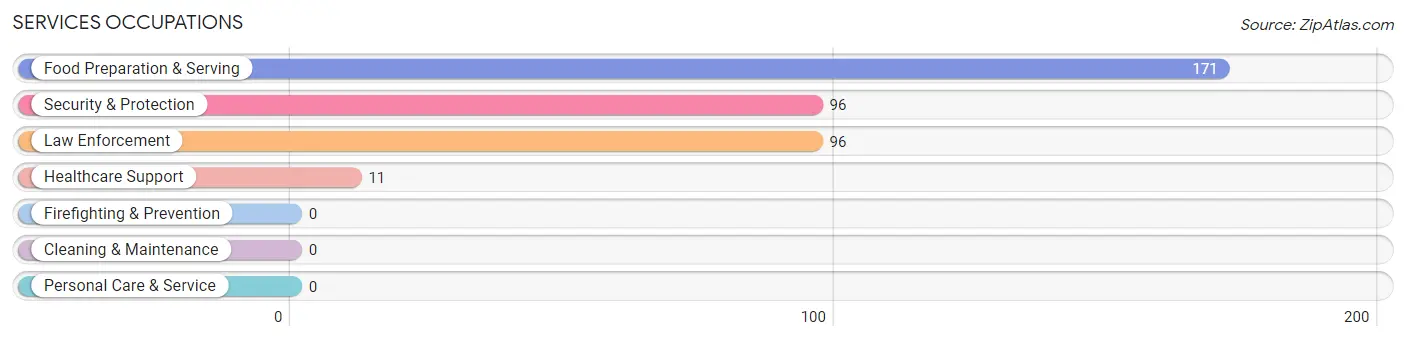
Services Occupations
The most common Services occupations in New Boston are Food Preparation & Serving (171 | 8.5%), Security & Protection (96 | 4.8%), Law Enforcement (96 | 4.8%), and Healthcare Support (11 | 0.5%).
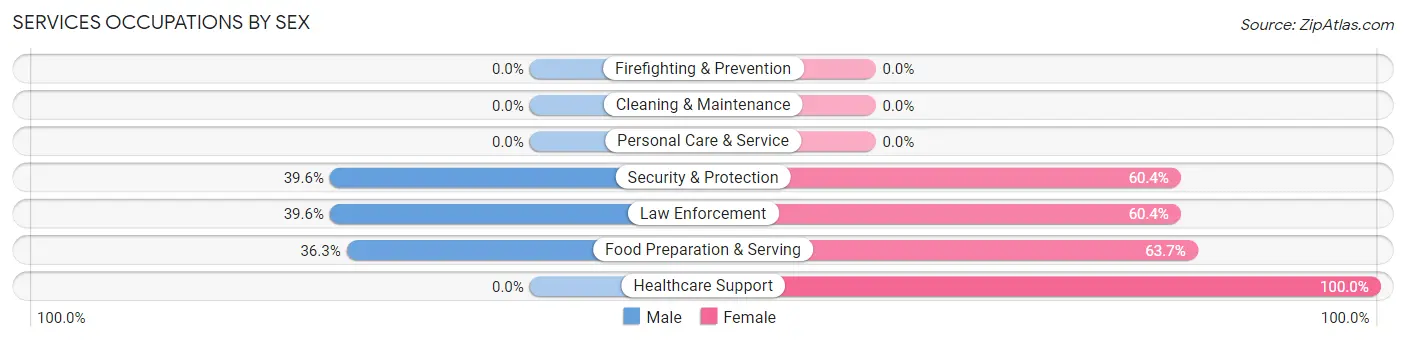
Services Occupations by Sex
Within the Services occupations in New Boston, the most male-oriented occupations are Security & Protection (39.6%), Law Enforcement (39.6%), and Food Preparation & Serving (36.3%), while the most female-oriented occupations are Healthcare Support (100.0%), Food Preparation & Serving (63.7%), and Security & Protection (60.4%).
| Occupation | Male | Female |
| Healthcare Support | 0 (0.0%) | 11 (100.0%) |
| Security & Protection | 38 (39.6%) | 58 (60.4%) |
| Firefighting & Prevention | 0 (0.0%) | 0 (0.0%) |
| Law Enforcement | 38 (39.6%) | 58 (60.4%) |
| Food Preparation & Serving | 62 (36.3%) | 109 (63.7%) |
| Cleaning & Maintenance | 0 (0.0%) | 0 (0.0%) |
| Personal Care & Service | 0 (0.0%) | 0 (0.0%) |
| Total (Category) | 100 (36.0%) | 178 (64.0%) |
| Total (Overall) | 1,005 (50.1%) | 1,000 (49.9%) |
Sales and Office Occupations
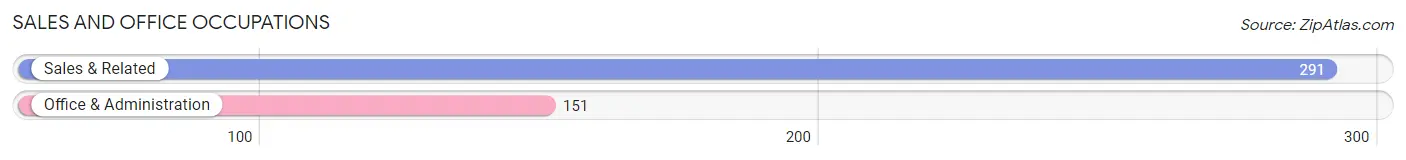
The most common Sales and Office occupations in New Boston are Sales & Related (291 | 14.5%), and Office & Administration (151 | 7.5%).
Sales and Office Occupations by Sex
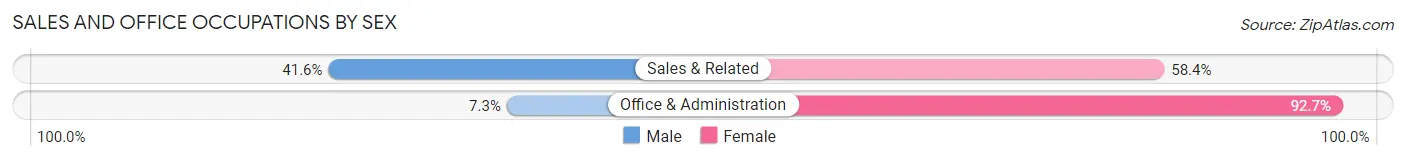
| Occupation | Male | Female |
| Sales & Related | 121 (41.6%) | 170 (58.4%) |
| Office & Administration | 11 (7.3%) | 140 (92.7%) |
| Total (Category) | 132 (29.9%) | 310 (70.1%) |
| Total (Overall) | 1,005 (50.1%) | 1,000 (49.9%) |
Natural Resources, Construction and Maintenance Occupations
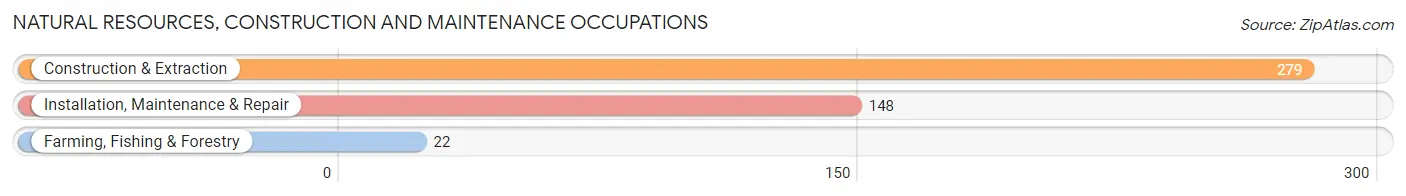
The most common Natural Resources, Construction and Maintenance occupations in New Boston are Construction & Extraction (279 | 13.9%), Installation, Maintenance & Repair (148 | 7.4%), and Farming, Fishing & Forestry (22 | 1.1%).
Natural Resources, Construction and Maintenance Occupations by Sex
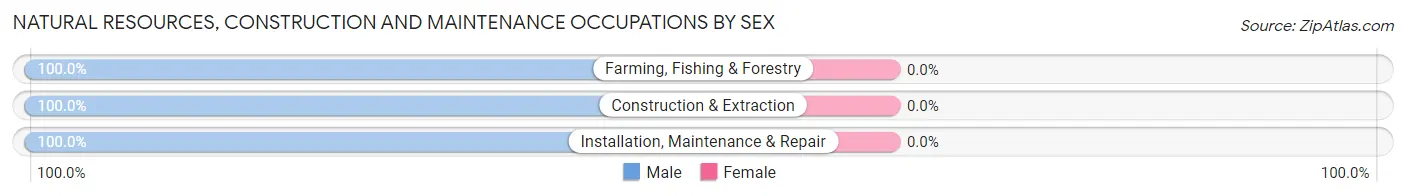
| Occupation | Male | Female |
| Farming, Fishing & Forestry | 22 (100.0%) | 0 (0.0%) |
| Construction & Extraction | 279 (100.0%) | 0 (0.0%) |
| Installation, Maintenance & Repair | 148 (100.0%) | 0 (0.0%) |
| Total (Category) | 449 (100.0%) | 0 (0.0%) |
| Total (Overall) | 1,005 (50.1%) | 1,000 (49.9%) |
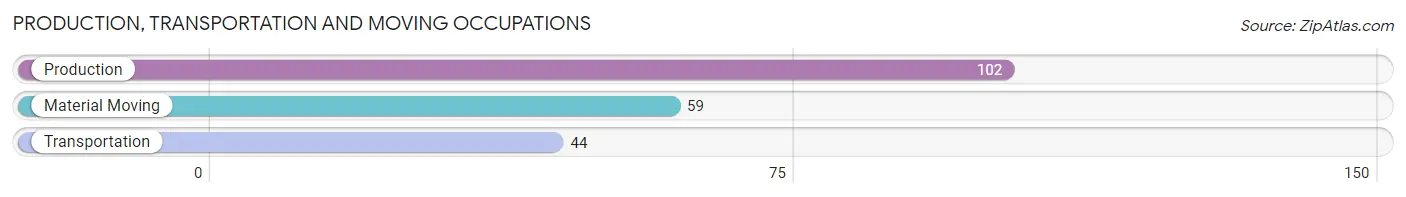
Production, Transportation and Moving Occupations
The most common Production, Transportation and Moving occupations in New Boston are Production (102 | 5.1%), Material Moving (59 | 2.9%), and Transportation (44 | 2.2%).
Production, Transportation and Moving Occupations by Sex
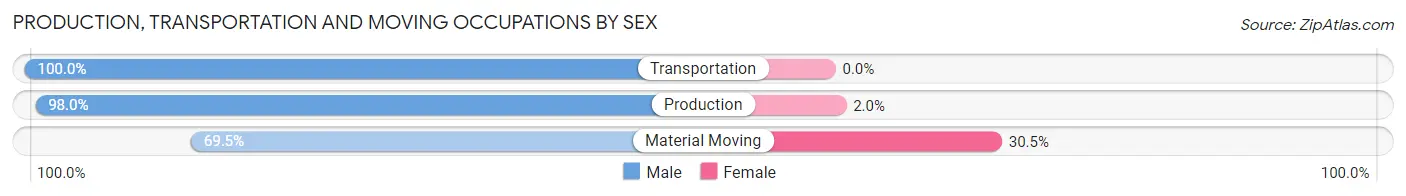
| Occupation | Male | Female |
| Production | 100 (98.0%) | 2 (2.0%) |
| Transportation | 44 (100.0%) | 0 (0.0%) |
| Material Moving | 41 (69.5%) | 18 (30.5%) |
| Total (Category) | 185 (90.2%) | 20 (9.8%) |
| Total (Overall) | 1,005 (50.1%) | 1,000 (49.9%) |
Employment Industries by Sex in New Boston
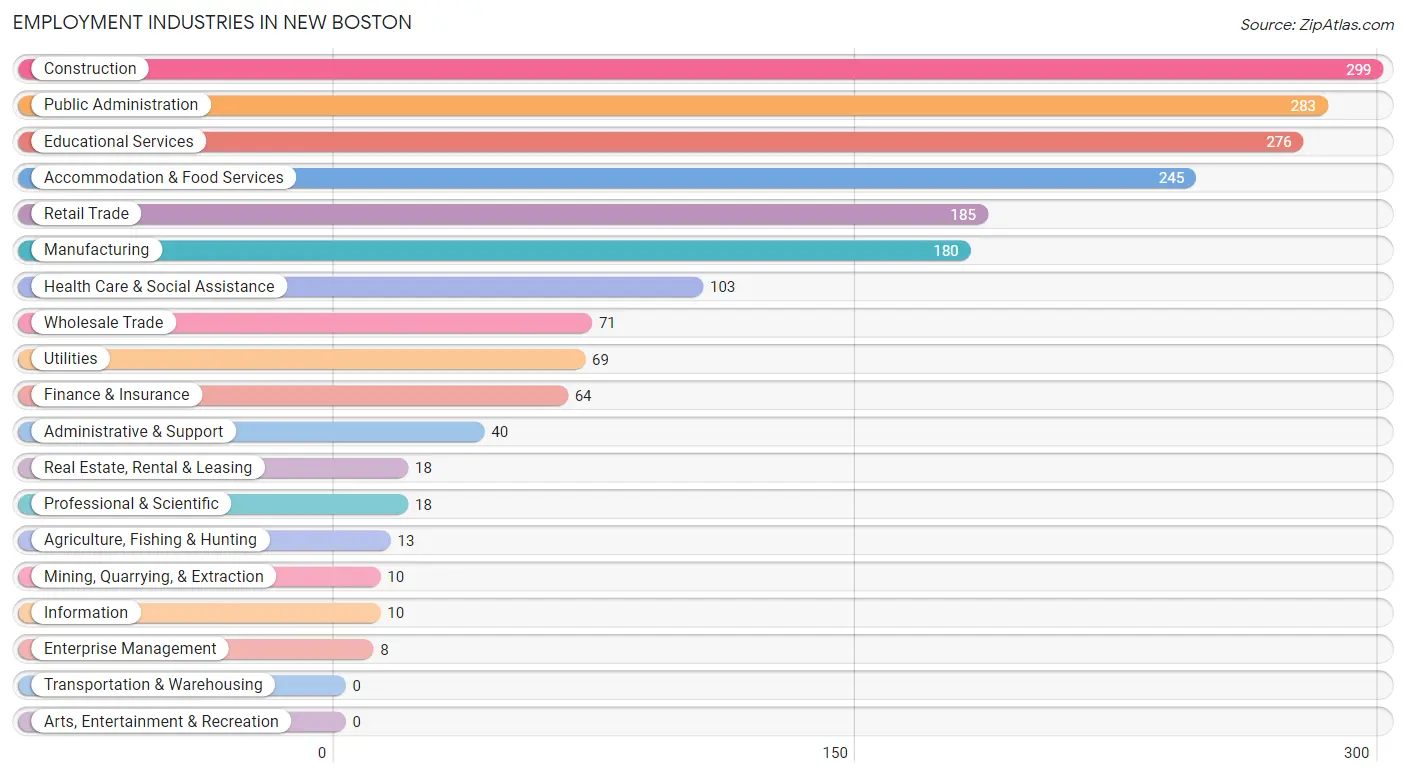
Employment Industries in New Boston
The major employment industries in New Boston include Construction (299 | 14.9%), Public Administration (283 | 14.1%), Educational Services (276 | 13.8%), Accommodation & Food Services (245 | 12.2%), and Retail Trade (185 | 9.2%).
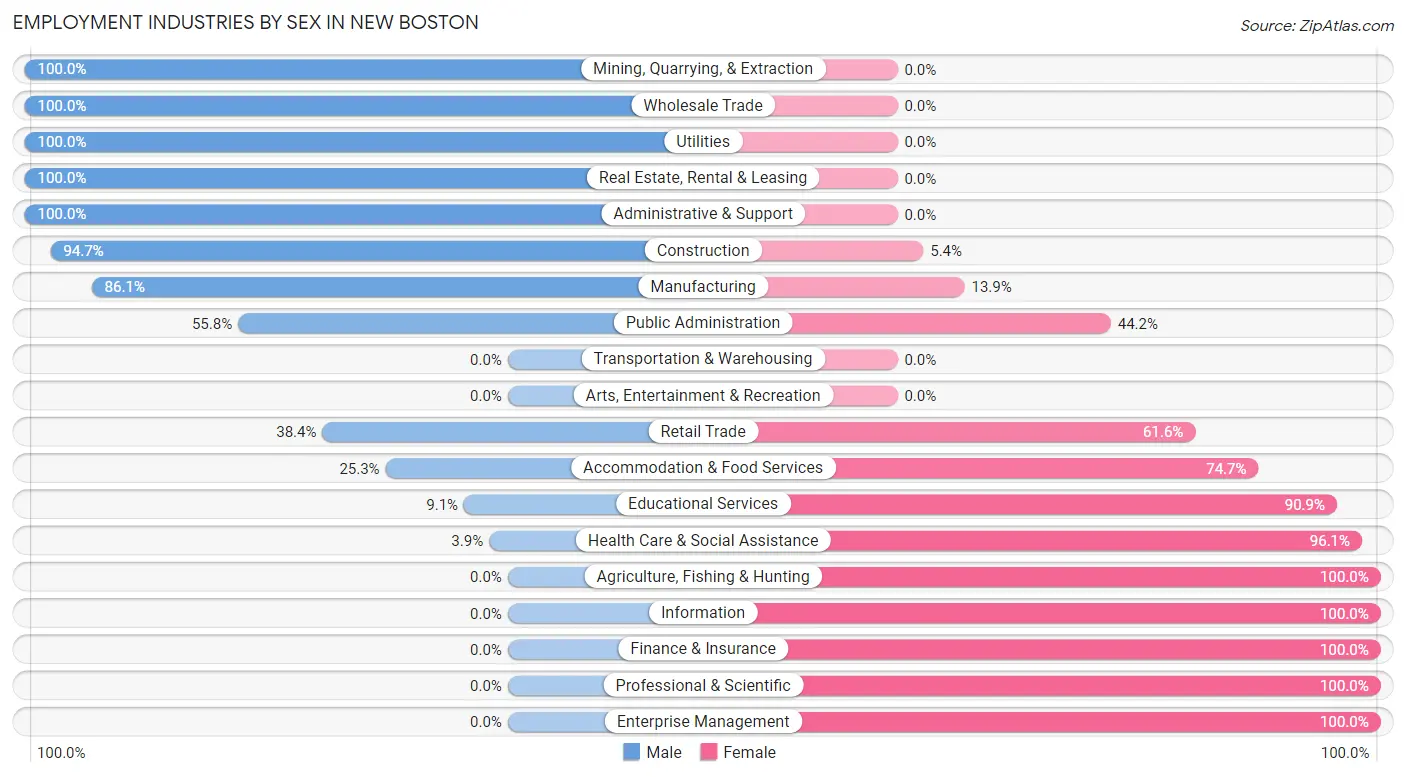
Employment Industries by Sex in New Boston
The New Boston industries that see more men than women are Mining, Quarrying, & Extraction (100.0%), Wholesale Trade (100.0%), and Utilities (100.0%), whereas the industries that tend to have a higher number of women are Agriculture, Fishing & Hunting (100.0%), Information (100.0%), and Finance & Insurance (100.0%).
| Industry | Male | Female |
| Agriculture, Fishing & Hunting | 0 (0.0%) | 13 (100.0%) |
| Mining, Quarrying, & Extraction | 10 (100.0%) | 0 (0.0%) |
| Construction | 283 (94.7%) | 16 (5.3%) |
| Manufacturing | 155 (86.1%) | 25 (13.9%) |
| Wholesale Trade | 71 (100.0%) | 0 (0.0%) |
| Retail Trade | 71 (38.4%) | 114 (61.6%) |
| Transportation & Warehousing | 0 (0.0%) | 0 (0.0%) |
| Utilities | 69 (100.0%) | 0 (0.0%) |
| Information | 0 (0.0%) | 10 (100.0%) |
| Finance & Insurance | 0 (0.0%) | 64 (100.0%) |
| Real Estate, Rental & Leasing | 18 (100.0%) | 0 (0.0%) |
| Professional & Scientific | 0 (0.0%) | 18 (100.0%) |
| Enterprise Management | 0 (0.0%) | 8 (100.0%) |
| Administrative & Support | 40 (100.0%) | 0 (0.0%) |
| Educational Services | 25 (9.1%) | 251 (90.9%) |
| Health Care & Social Assistance | 4 (3.9%) | 99 (96.1%) |
| Arts, Entertainment & Recreation | 0 (0.0%) | 0 (0.0%) |
| Accommodation & Food Services | 62 (25.3%) | 183 (74.7%) |
| Public Administration | 158 (55.8%) | 125 (44.2%) |
| Total | 1,005 (50.1%) | 1,000 (49.9%) |
Education in New Boston
School Enrollment in New Boston
The most common levels of schooling among the 1,150 students in New Boston are middle school (368 | 32.0%), high school (247 | 21.5%), and elementary school (210 | 18.3%).
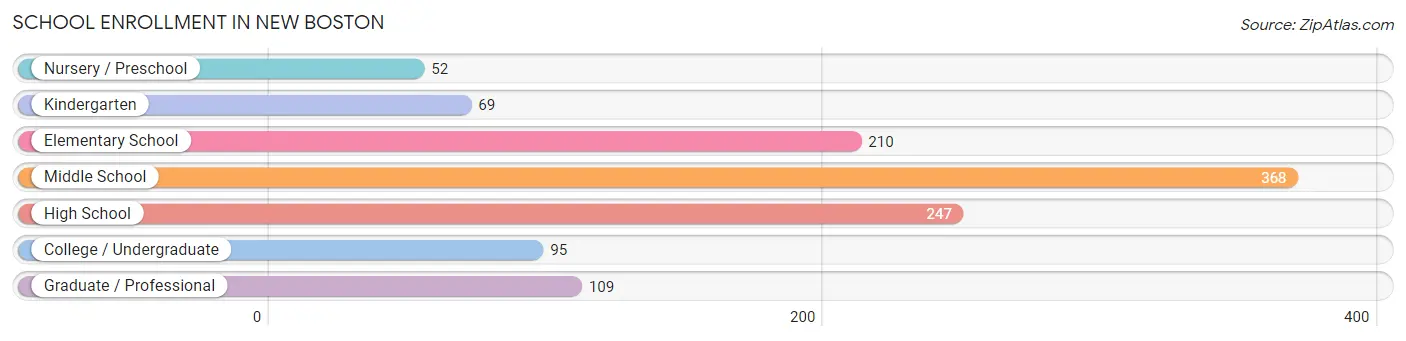
| School Level | # Students | % Students |
| Nursery / Preschool | 52 | 4.5% |
| Kindergarten | 69 | 6.0% |
| Elementary School | 210 | 18.3% |
| Middle School | 368 | 32.0% |
| High School | 247 | 21.5% |
| College / Undergraduate | 95 | 8.3% |
| Graduate / Professional | 109 | 9.5% |
| Total | 1,150 | 100.0% |
School Enrollment by Age by Funding Source in New Boston
Out of a total of 1,150 students who are enrolled in schools in New Boston, 124 (10.8%) attend a private institution, while the remaining 1,026 (89.2%) are enrolled in public schools. The age group of 25 to 34 year olds has the highest likelihood of being enrolled in private schools, with 55 (80.9% in the age bracket) enrolled. Conversely, the age group of 3 to 4 year olds has the lowest likelihood of being enrolled in a private school, with 33 (100.0% in the age bracket) attending a public institution.
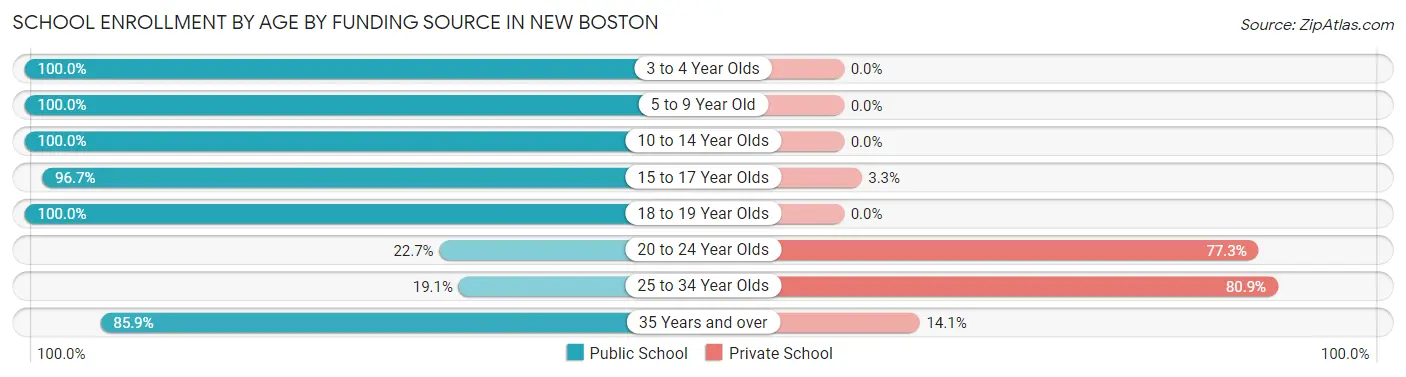
| Age Bracket | Public School | Private School |
| 3 to 4 Year Olds | 33 (100.0%) | 0 (0.0%) |
| 5 to 9 Year Old | 232 (100.0%) | 0 (0.0%) |
| 10 to 14 Year Olds | 467 (100.0%) | 0 (0.0%) |
| 15 to 17 Year Olds | 177 (96.7%) | 6 (3.3%) |
| 18 to 19 Year Olds | 16 (100.0%) | 0 (0.0%) |
| 20 to 24 Year Olds | 15 (22.7%) | 51 (77.3%) |
| 25 to 34 Year Olds | 13 (19.1%) | 55 (80.9%) |
| 35 Years and over | 73 (85.9%) | 12 (14.1%) |
| Total | 1,026 (89.2%) | 124 (10.8%) |
Educational Attainment by Field of Study in New Boston
Education (437 | 53.5%), business (102 | 12.5%), physical & health sciences (60 | 7.3%), communications (60 | 7.3%), and science & technology (57 | 7.0%) are the most common fields of study among 817 individuals in New Boston who have obtained a bachelor's degree or higher.
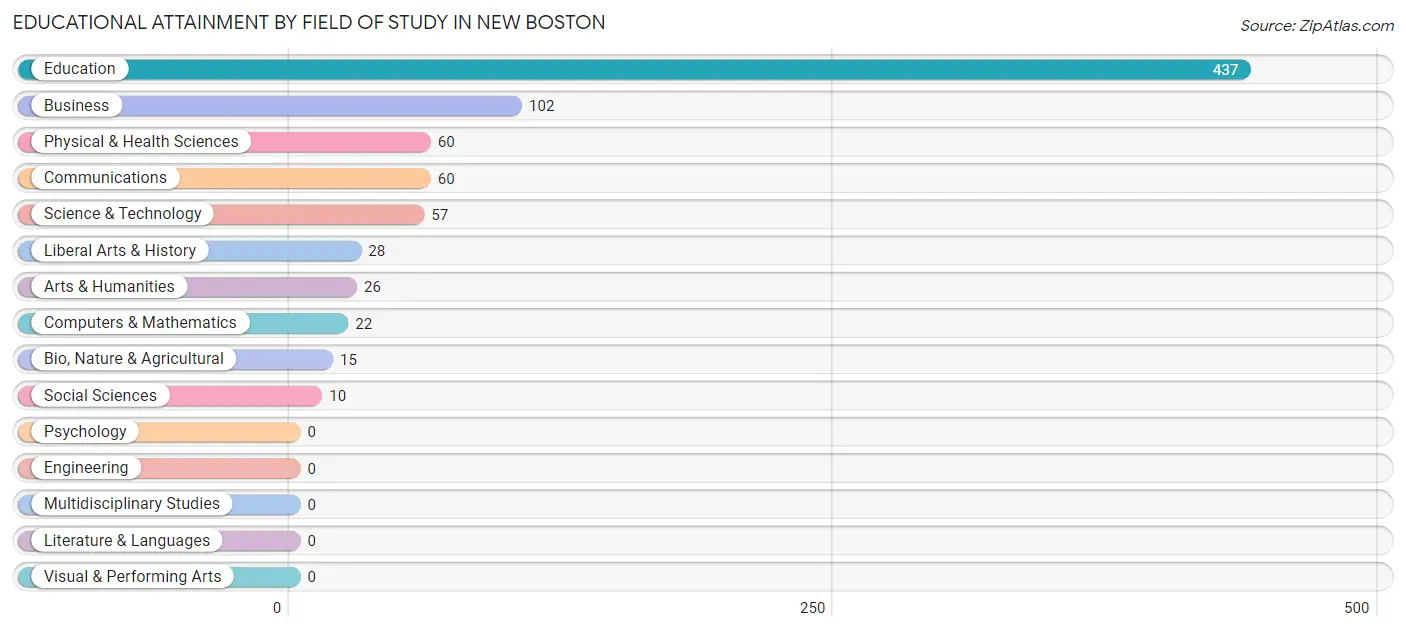
| Field of Study | # Graduates | % Graduates |
| Computers & Mathematics | 22 | 2.7% |
| Bio, Nature & Agricultural | 15 | 1.8% |
| Physical & Health Sciences | 60 | 7.3% |
| Psychology | 0 | 0.0% |
| Social Sciences | 10 | 1.2% |
| Engineering | 0 | 0.0% |
| Multidisciplinary Studies | 0 | 0.0% |
| Science & Technology | 57 | 7.0% |
| Business | 102 | 12.5% |
| Education | 437 | 53.5% |
| Literature & Languages | 0 | 0.0% |
| Liberal Arts & History | 28 | 3.4% |
| Visual & Performing Arts | 0 | 0.0% |
| Communications | 60 | 7.3% |
| Arts & Humanities | 26 | 3.2% |
| Total | 817 | 100.0% |
Transportation & Commute in New Boston
Vehicle Availability by Sex in New Boston
The most prevalent vehicle ownership categories in New Boston are males with 2 vehicles (439, accounting for 43.7%) and females with 2 vehicles (272, making up 43.9%).
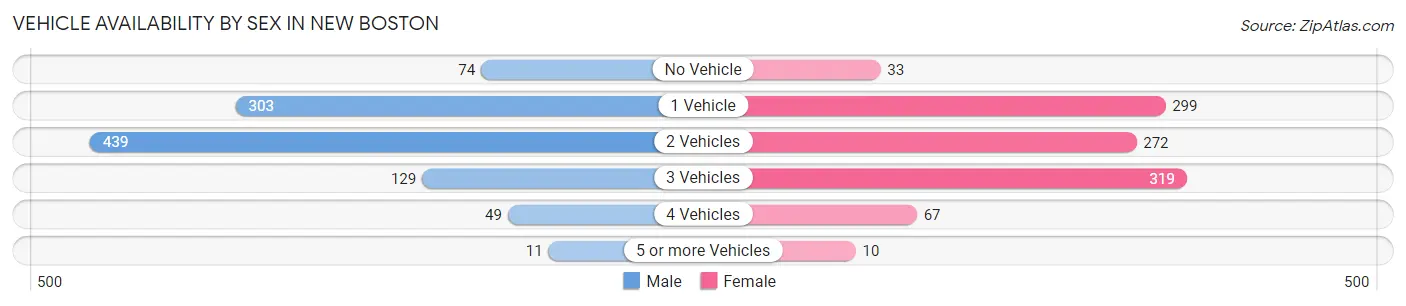
| Vehicles Available | Male | Female |
| No Vehicle | 74 (7.4%) | 33 (3.3%) |
| 1 Vehicle | 303 (30.1%) | 299 (29.9%) |
| 2 Vehicles | 439 (43.7%) | 272 (27.2%) |
| 3 Vehicles | 129 (12.8%) | 319 (31.9%) |
| 4 Vehicles | 49 (4.9%) | 67 (6.7%) |
| 5 or more Vehicles | 11 (1.1%) | 10 (1.0%) |
| Total | 1,005 (100.0%) | 1,000 (100.0%) |
Commute Time in New Boston
The most frequently occuring commute durations in New Boston are 5 to 9 minutes (613 commuters, 32.0%), 20 to 24 minutes (323 commuters, 16.9%), and 10 to 14 minutes (297 commuters, 15.5%).
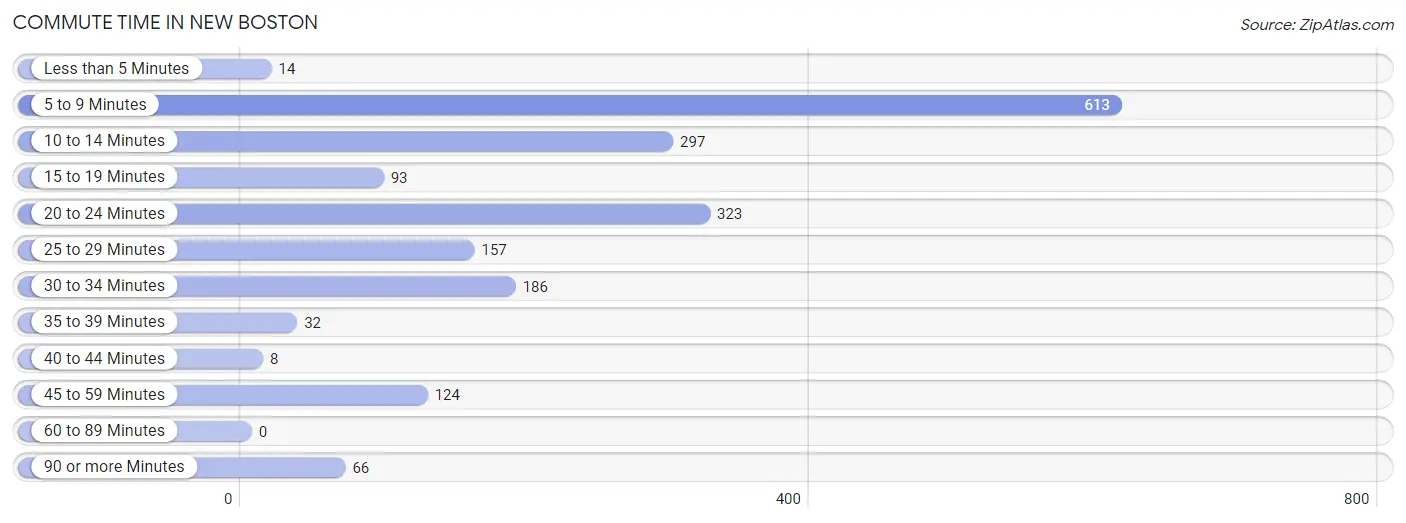
| Commute Time | # Commuters | % Commuters |
| Less than 5 Minutes | 14 | 0.7% |
| 5 to 9 Minutes | 613 | 32.0% |
| 10 to 14 Minutes | 297 | 15.5% |
| 15 to 19 Minutes | 93 | 4.9% |
| 20 to 24 Minutes | 323 | 16.9% |
| 25 to 29 Minutes | 157 | 8.2% |
| 30 to 34 Minutes | 186 | 9.7% |
| 35 to 39 Minutes | 32 | 1.7% |
| 40 to 44 Minutes | 8 | 0.4% |
| 45 to 59 Minutes | 124 | 6.5% |
| 60 to 89 Minutes | 0 | 0.0% |
| 90 or more Minutes | 66 | 3.5% |
Commute Time by Sex in New Boston
The most common commute times in New Boston are 10 to 14 minutes (241 commuters, 24.0%) for males and 5 to 9 minutes (401 commuters, 44.2%) for females.
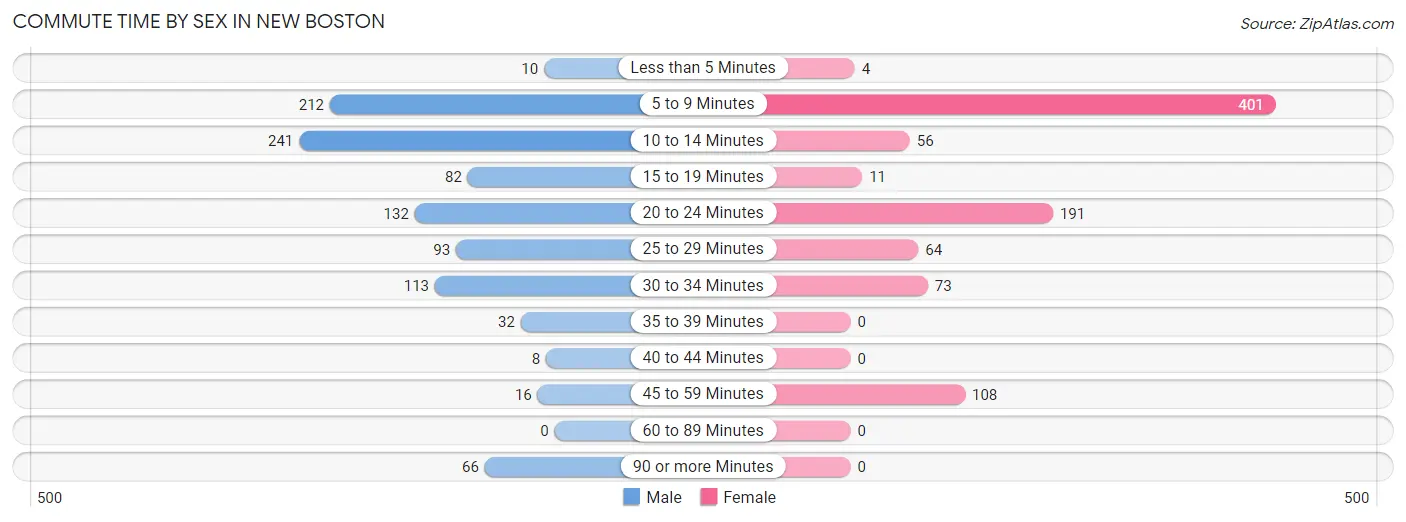
| Commute Time | Male | Female |
| Less than 5 Minutes | 10 (1.0%) | 4 (0.4%) |
| 5 to 9 Minutes | 212 (21.1%) | 401 (44.2%) |
| 10 to 14 Minutes | 241 (24.0%) | 56 (6.2%) |
| 15 to 19 Minutes | 82 (8.2%) | 11 (1.2%) |
| 20 to 24 Minutes | 132 (13.1%) | 191 (21.0%) |
| 25 to 29 Minutes | 93 (9.2%) | 64 (7.0%) |
| 30 to 34 Minutes | 113 (11.2%) | 73 (8.0%) |
| 35 to 39 Minutes | 32 (3.2%) | 0 (0.0%) |
| 40 to 44 Minutes | 8 (0.8%) | 0 (0.0%) |
| 45 to 59 Minutes | 16 (1.6%) | 108 (11.9%) |
| 60 to 89 Minutes | 0 (0.0%) | 0 (0.0%) |
| 90 or more Minutes | 66 (6.6%) | 0 (0.0%) |
Time of Departure to Work by Sex in New Boston
The most frequent times of departure to work in New Boston are 7:00 AM to 7:29 AM (213, 21.2%) for males and 4:00 PM to 11:59 PM (230, 25.3%) for females.
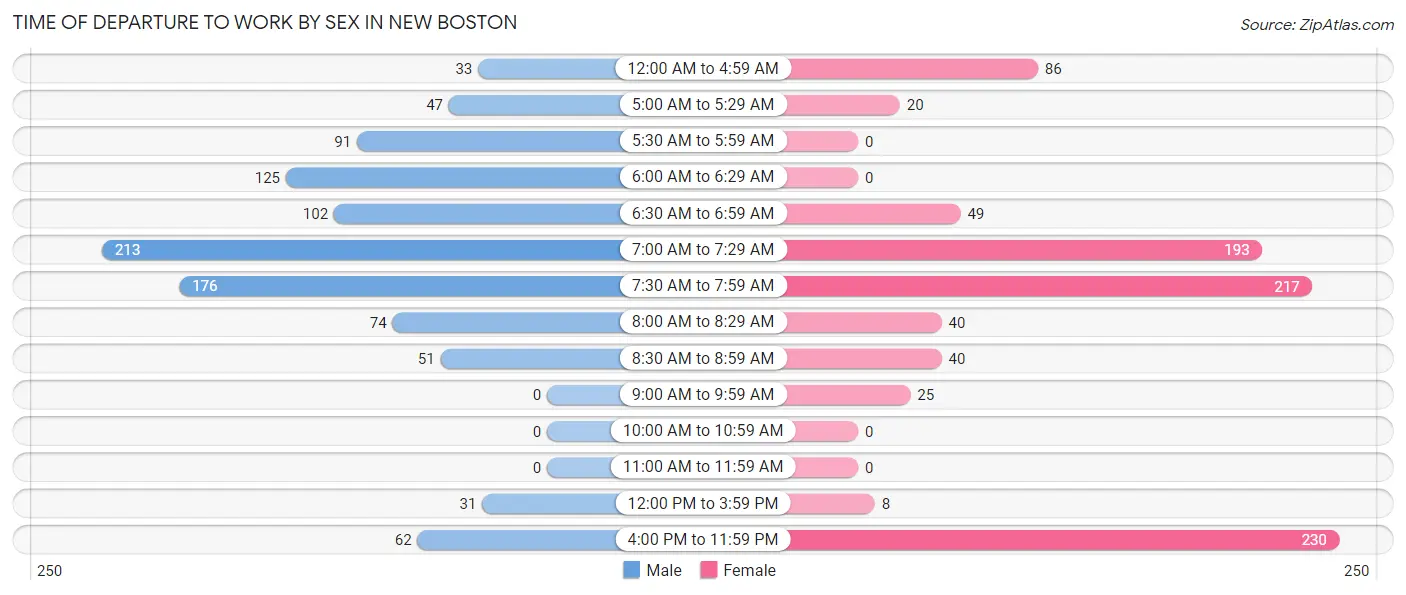
| Time of Departure | Male | Female |
| 12:00 AM to 4:59 AM | 33 (3.3%) | 86 (9.5%) |
| 5:00 AM to 5:29 AM | 47 (4.7%) | 20 (2.2%) |
| 5:30 AM to 5:59 AM | 91 (9.0%) | 0 (0.0%) |
| 6:00 AM to 6:29 AM | 125 (12.4%) | 0 (0.0%) |
| 6:30 AM to 6:59 AM | 102 (10.2%) | 49 (5.4%) |
| 7:00 AM to 7:29 AM | 213 (21.2%) | 193 (21.3%) |
| 7:30 AM to 7:59 AM | 176 (17.5%) | 217 (23.9%) |
| 8:00 AM to 8:29 AM | 74 (7.4%) | 40 (4.4%) |
| 8:30 AM to 8:59 AM | 51 (5.1%) | 40 (4.4%) |
| 9:00 AM to 9:59 AM | 0 (0.0%) | 25 (2.8%) |
| 10:00 AM to 10:59 AM | 0 (0.0%) | 0 (0.0%) |
| 11:00 AM to 11:59 AM | 0 (0.0%) | 0 (0.0%) |
| 12:00 PM to 3:59 PM | 31 (3.1%) | 8 (0.9%) |
| 4:00 PM to 11:59 PM | 62 (6.2%) | 230 (25.3%) |
| Total | 1,005 (100.0%) | 908 (100.0%) |
Housing Occupancy in New Boston
Occupancy by Ownership in New Boston
Of the total 1,855 dwellings in New Boston, owner-occupied units account for 1,062 (57.3%), while renter-occupied units make up 793 (42.7%).
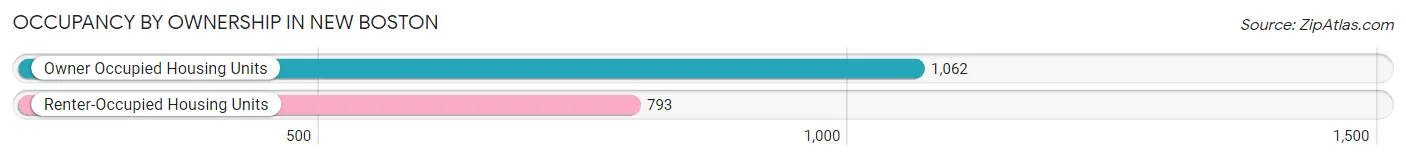
| Occupancy | # Housing Units | % Housing Units |
| Owner Occupied Housing Units | 1,062 | 57.3% |
| Renter-Occupied Housing Units | 793 | 42.7% |
| Total Occupied Housing Units | 1,855 | 100.0% |
Occupancy by Household Size in New Boston
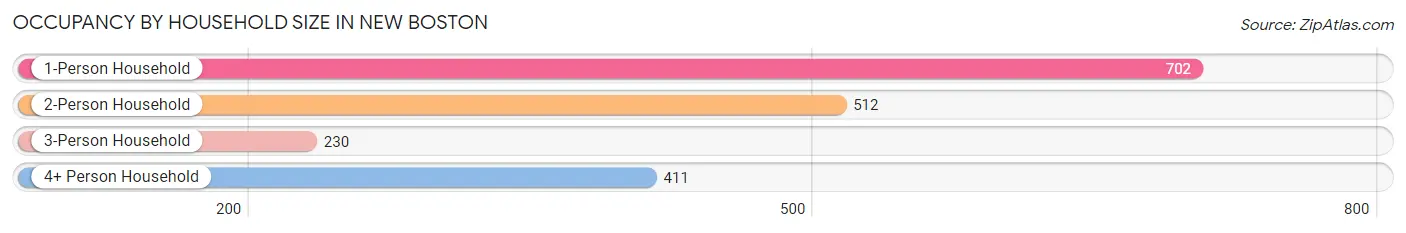
| Household Size | # Housing Units | % Housing Units |
| 1-Person Household | 702 | 37.8% |
| 2-Person Household | 512 | 27.6% |
| 3-Person Household | 230 | 12.4% |
| 4+ Person Household | 411 | 22.2% |
| Total Housing Units | 1,855 | 100.0% |
Occupancy by Ownership by Household Size in New Boston
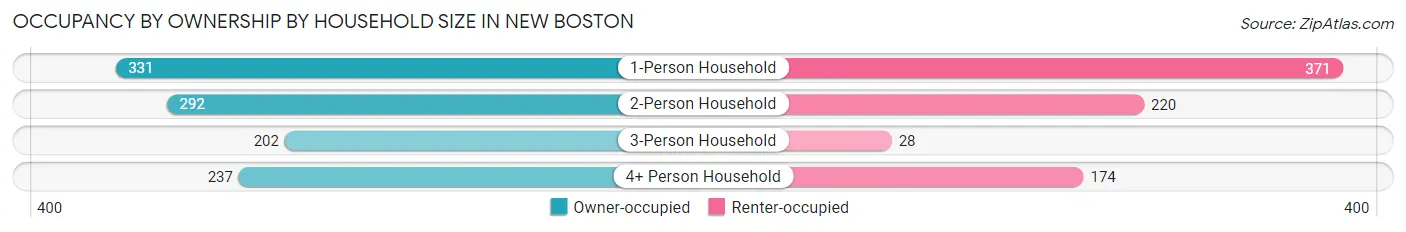
| Household Size | Owner-occupied | Renter-occupied |
| 1-Person Household | 331 (47.1%) | 371 (52.8%) |
| 2-Person Household | 292 (57.0%) | 220 (43.0%) |
| 3-Person Household | 202 (87.8%) | 28 (12.2%) |
| 4+ Person Household | 237 (57.7%) | 174 (42.3%) |
| Total Housing Units | 1,062 (57.3%) | 793 (42.7%) |
Occupancy by Educational Attainment in New Boston
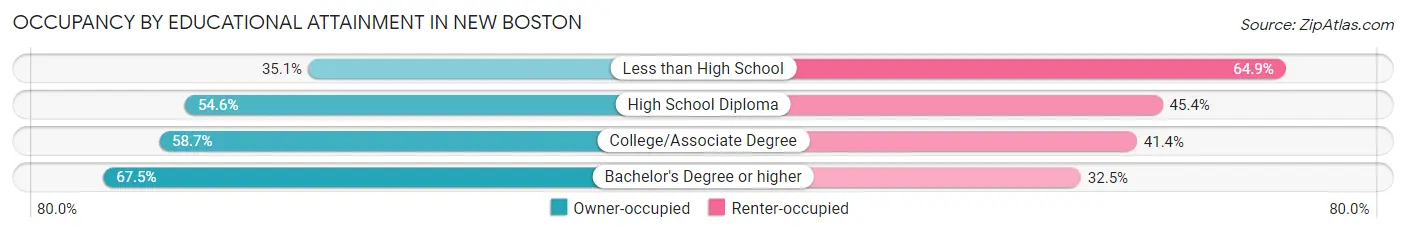
| Household Size | Owner-occupied | Renter-occupied |
| Less than High School | 54 (35.1%) | 100 (64.9%) |
| High School Diploma | 365 (54.6%) | 304 (45.4%) |
| College/Associate Degree | 356 (58.7%) | 251 (41.3%) |
| Bachelor's Degree or higher | 287 (67.5%) | 138 (32.5%) |
Occupancy by Age of Householder in New Boston
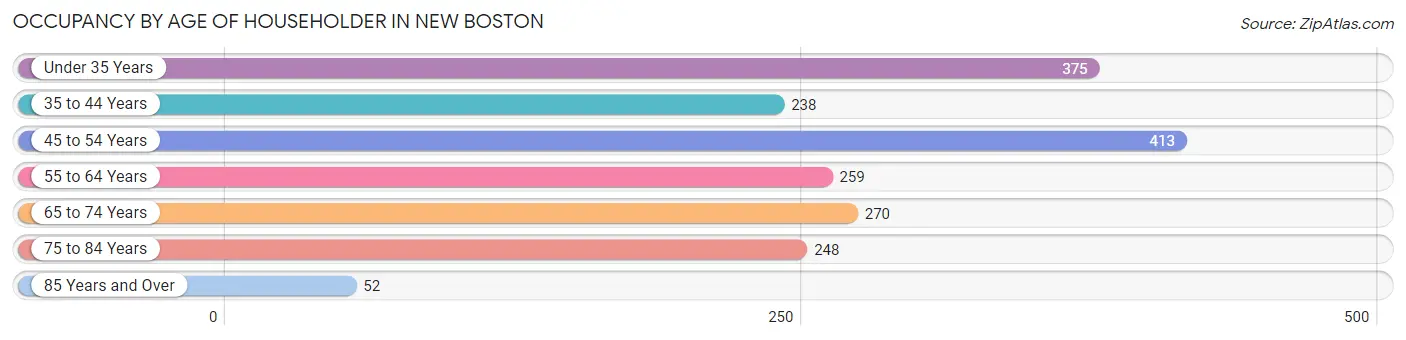
| Age Bracket | # Households | % Households |
| Under 35 Years | 375 | 20.2% |
| 35 to 44 Years | 238 | 12.8% |
| 45 to 54 Years | 413 | 22.3% |
| 55 to 64 Years | 259 | 14.0% |
| 65 to 74 Years | 270 | 14.6% |
| 75 to 84 Years | 248 | 13.4% |
| 85 Years and Over | 52 | 2.8% |
| Total | 1,855 | 100.0% |
Housing Finances in New Boston
Median Income by Occupancy in New Boston
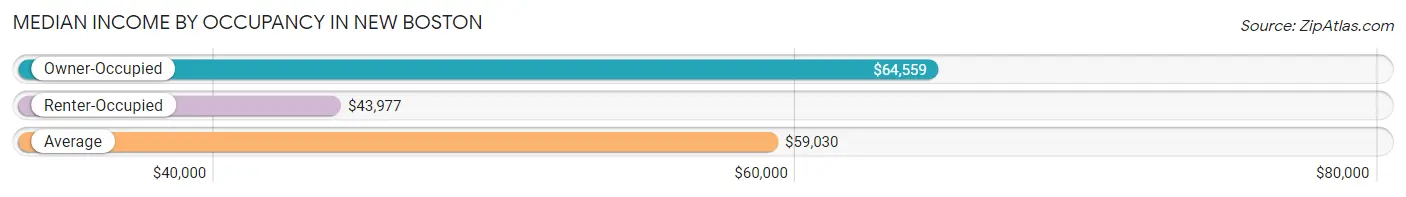
| Occupancy Type | # Households | Median Income |
| Owner-Occupied | 1,062 (57.3%) | $64,559 |
| Renter-Occupied | 793 (42.7%) | $43,977 |
| Average | 1,855 (100.0%) | $59,030 |
Occupancy by Householder Income Bracket in New Boston
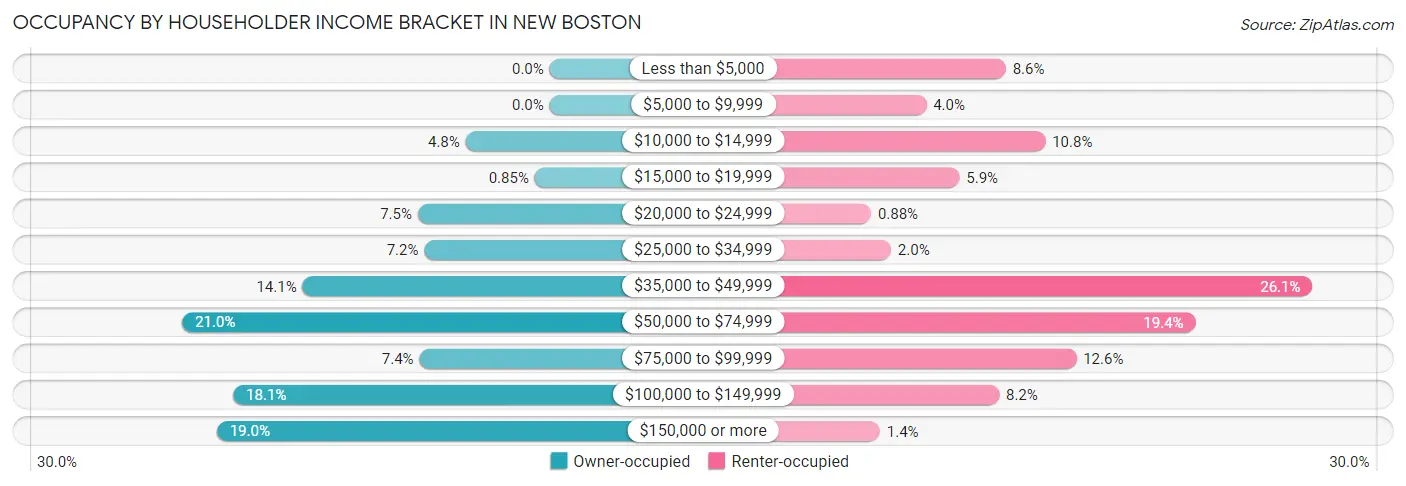
| Income Bracket | Owner-occupied | Renter-occupied |
| Less than $5,000 | 0 (0.0%) | 68 (8.6%) |
| $5,000 to $9,999 | 0 (0.0%) | 32 (4.0%) |
| $10,000 to $14,999 | 51 (4.8%) | 86 (10.8%) |
| $15,000 to $19,999 | 9 (0.9%) | 47 (5.9%) |
| $20,000 to $24,999 | 80 (7.5%) | 7 (0.9%) |
| $25,000 to $34,999 | 76 (7.2%) | 16 (2.0%) |
| $35,000 to $49,999 | 150 (14.1%) | 207 (26.1%) |
| $50,000 to $74,999 | 223 (21.0%) | 154 (19.4%) |
| $75,000 to $99,999 | 79 (7.4%) | 100 (12.6%) |
| $100,000 to $149,999 | 192 (18.1%) | 65 (8.2%) |
| $150,000 or more | 202 (19.0%) | 11 (1.4%) |
| Total | 1,062 (100.0%) | 793 (100.0%) |
Monthly Housing Cost Tiers in New Boston
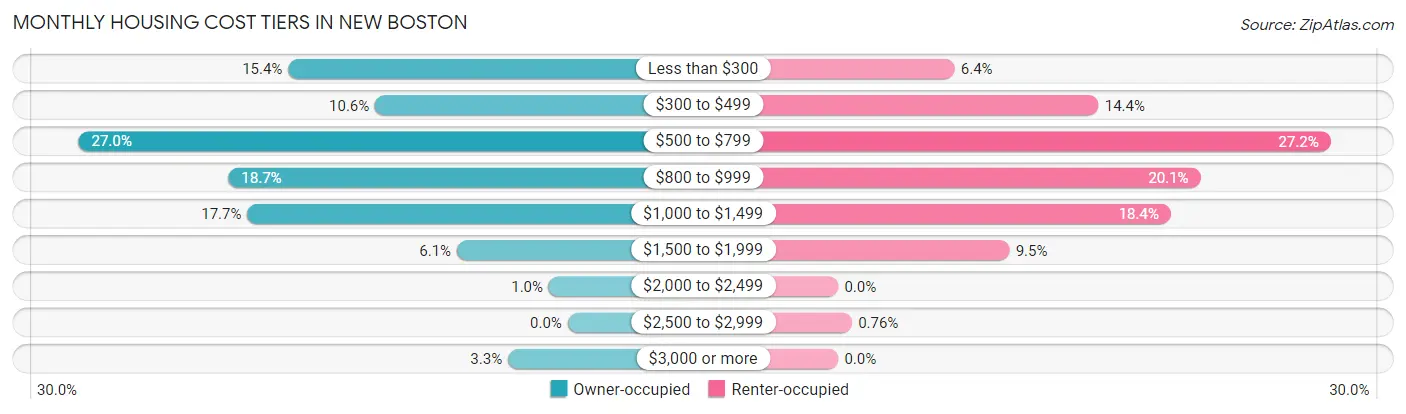
| Monthly Cost | Owner-occupied | Renter-occupied |
| Less than $300 | 164 (15.4%) | 51 (6.4%) |
| $300 to $499 | 113 (10.6%) | 114 (14.4%) |
| $500 to $799 | 287 (27.0%) | 216 (27.2%) |
| $800 to $999 | 199 (18.7%) | 159 (20.1%) |
| $1,000 to $1,499 | 188 (17.7%) | 146 (18.4%) |
| $1,500 to $1,999 | 65 (6.1%) | 75 (9.5%) |
| $2,000 to $2,499 | 11 (1.0%) | 0 (0.0%) |
| $2,500 to $2,999 | 0 (0.0%) | 6 (0.8%) |
| $3,000 or more | 35 (3.3%) | 0 (0.0%) |
| Total | 1,062 (100.0%) | 793 (100.0%) |
Physical Housing Characteristics in New Boston
Housing Structures in New Boston
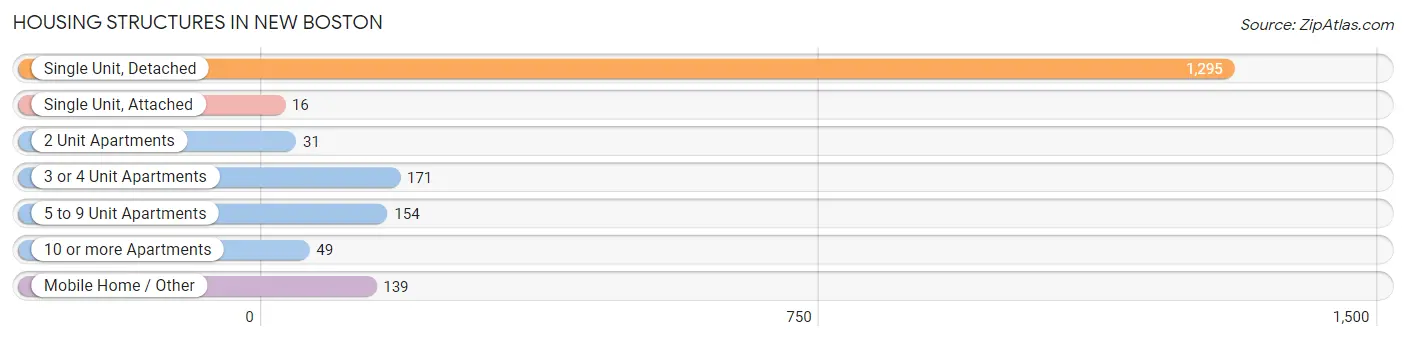
| Structure Type | # Housing Units | % Housing Units |
| Single Unit, Detached | 1,295 | 69.8% |
| Single Unit, Attached | 16 | 0.9% |
| 2 Unit Apartments | 31 | 1.7% |
| 3 or 4 Unit Apartments | 171 | 9.2% |
| 5 to 9 Unit Apartments | 154 | 8.3% |
| 10 or more Apartments | 49 | 2.6% |
| Mobile Home / Other | 139 | 7.5% |
| Total | 1,855 | 100.0% |
Housing Structures by Occupancy in New Boston
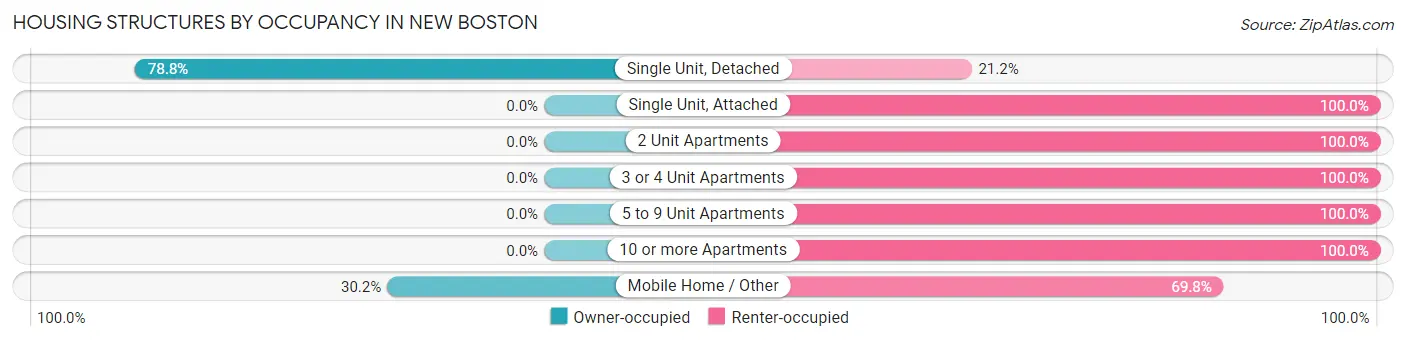
| Structure Type | Owner-occupied | Renter-occupied |
| Single Unit, Detached | 1,020 (78.8%) | 275 (21.2%) |
| Single Unit, Attached | 0 (0.0%) | 16 (100.0%) |
| 2 Unit Apartments | 0 (0.0%) | 31 (100.0%) |
| 3 or 4 Unit Apartments | 0 (0.0%) | 171 (100.0%) |
| 5 to 9 Unit Apartments | 0 (0.0%) | 154 (100.0%) |
| 10 or more Apartments | 0 (0.0%) | 49 (100.0%) |
| Mobile Home / Other | 42 (30.2%) | 97 (69.8%) |
| Total | 1,062 (57.3%) | 793 (42.7%) |
Housing Structures by Number of Rooms in New Boston
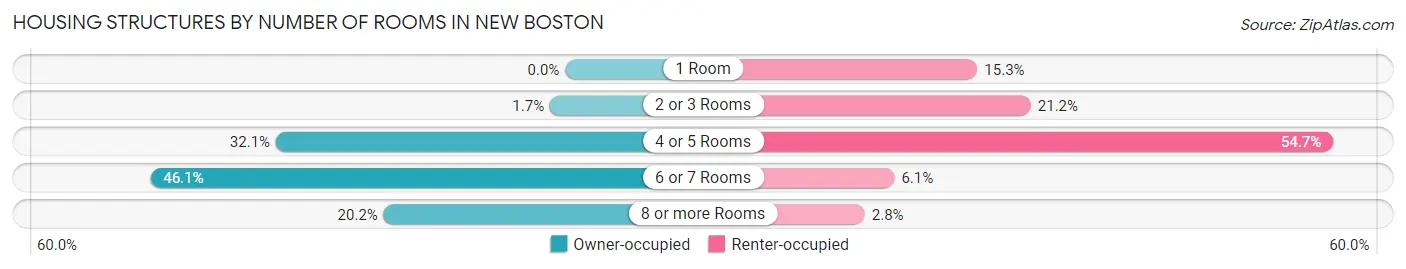
| Number of Rooms | Owner-occupied | Renter-occupied |
| 1 Room | 0 (0.0%) | 121 (15.3%) |
| 2 or 3 Rooms | 18 (1.7%) | 168 (21.2%) |
| 4 or 5 Rooms | 341 (32.1%) | 434 (54.7%) |
| 6 or 7 Rooms | 489 (46.1%) | 48 (6.0%) |
| 8 or more Rooms | 214 (20.2%) | 22 (2.8%) |
| Total | 1,062 (100.0%) | 793 (100.0%) |
Housing Structure by Heating Type in New Boston
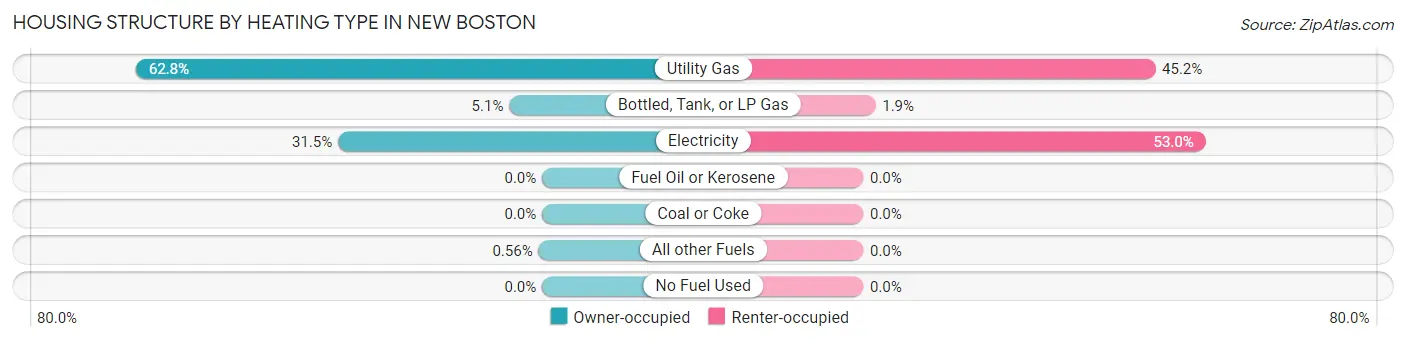
| Heating Type | Owner-occupied | Renter-occupied |
| Utility Gas | 667 (62.8%) | 358 (45.2%) |
| Bottled, Tank, or LP Gas | 54 (5.1%) | 15 (1.9%) |
| Electricity | 335 (31.5%) | 420 (53.0%) |
| Fuel Oil or Kerosene | 0 (0.0%) | 0 (0.0%) |
| Coal or Coke | 0 (0.0%) | 0 (0.0%) |
| All other Fuels | 6 (0.6%) | 0 (0.0%) |
| No Fuel Used | 0 (0.0%) | 0 (0.0%) |
| Total | 1,062 (100.0%) | 793 (100.0%) |
Household Vehicle Usage in New Boston
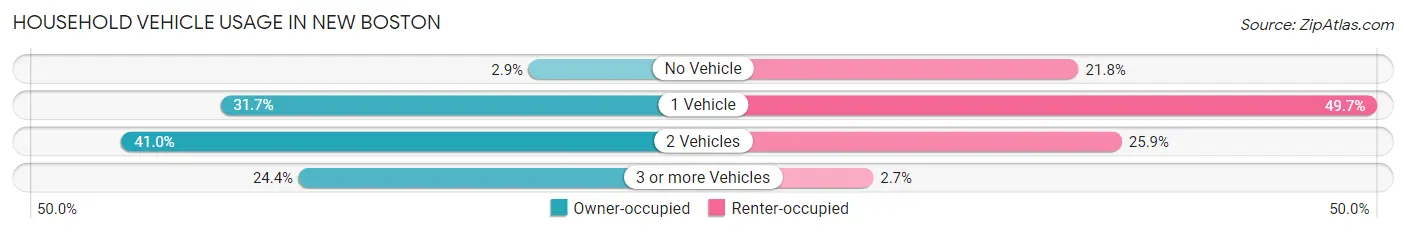
| Vehicles per Household | Owner-occupied | Renter-occupied |
| No Vehicle | 31 (2.9%) | 173 (21.8%) |
| 1 Vehicle | 337 (31.7%) | 394 (49.7%) |
| 2 Vehicles | 435 (41.0%) | 205 (25.9%) |
| 3 or more Vehicles | 259 (24.4%) | 21 (2.6%) |
| Total | 1,062 (100.0%) | 793 (100.0%) |
Real Estate & Mortgages in New Boston
Real Estate and Mortgage Overview in New Boston
| Characteristic | Without Mortgage | With Mortgage |
| Housing Units | 426 | 636 |
| Median Property Value | $84,800 | $99,500 |
| Median Household Income | $58,125 | $92 |
| Monthly Housing Costs | $389 | $35 |
| Real Estate Taxes | $1,364 | $76 |
Property Value by Mortgage Status in New Boston
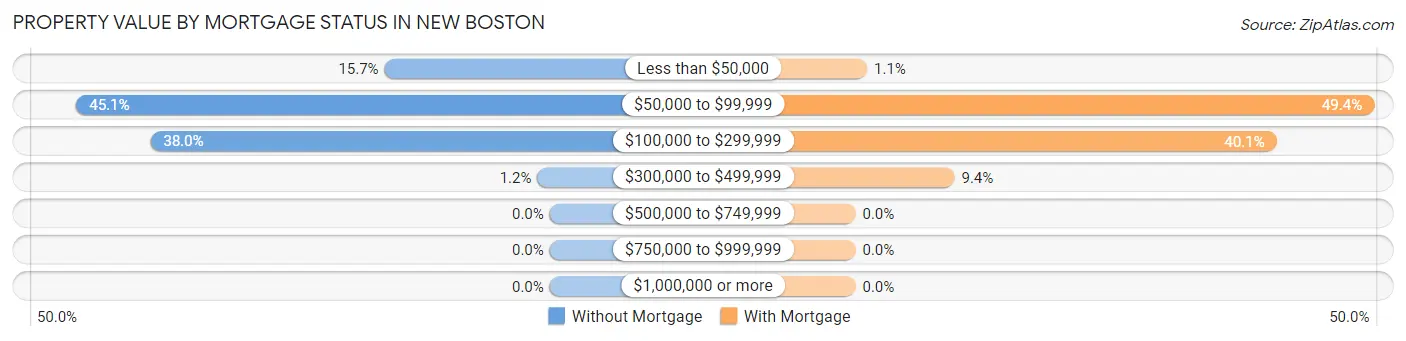
| Property Value | Without Mortgage | With Mortgage |
| Less than $50,000 | 67 (15.7%) | 7 (1.1%) |
| $50,000 to $99,999 | 192 (45.1%) | 314 (49.4%) |
| $100,000 to $299,999 | 162 (38.0%) | 255 (40.1%) |
| $300,000 to $499,999 | 5 (1.2%) | 60 (9.4%) |
| $500,000 to $749,999 | 0 (0.0%) | 0 (0.0%) |
| $750,000 to $999,999 | 0 (0.0%) | 0 (0.0%) |
| $1,000,000 or more | 0 (0.0%) | 0 (0.0%) |
| Total | 426 (100.0%) | 636 (100.0%) |
Household Income by Mortgage Status in New Boston
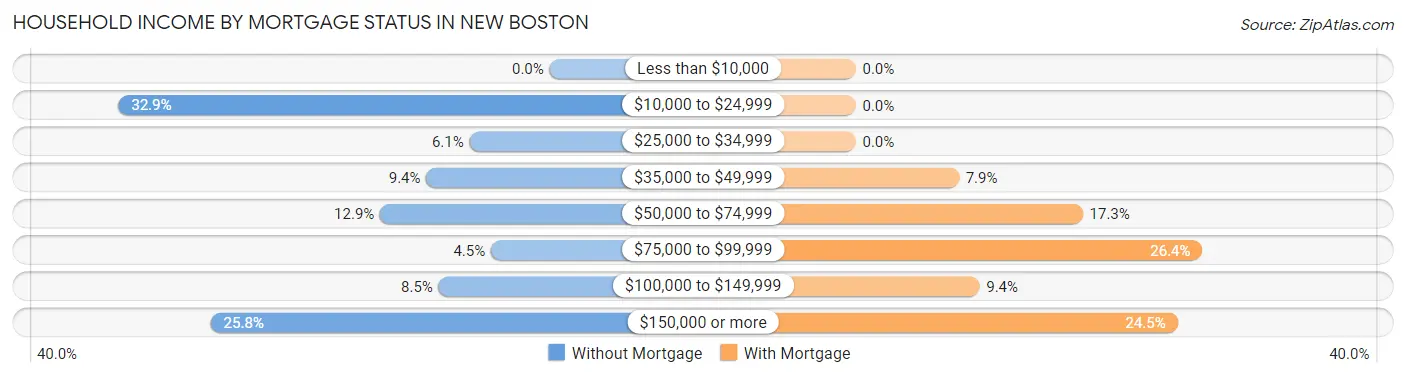
| Household Income | Without Mortgage | With Mortgage |
| Less than $10,000 | 0 (0.0%) | 0 (0.0%) |
| $10,000 to $24,999 | 140 (32.9%) | 0 (0.0%) |
| $25,000 to $34,999 | 26 (6.1%) | 0 (0.0%) |
| $35,000 to $49,999 | 40 (9.4%) | 50 (7.9%) |
| $50,000 to $74,999 | 55 (12.9%) | 110 (17.3%) |
| $75,000 to $99,999 | 19 (4.5%) | 168 (26.4%) |
| $100,000 to $149,999 | 36 (8.5%) | 60 (9.4%) |
| $150,000 or more | 110 (25.8%) | 156 (24.5%) |
| Total | 426 (100.0%) | 636 (100.0%) |
Property Value to Household Income Ratio in New Boston
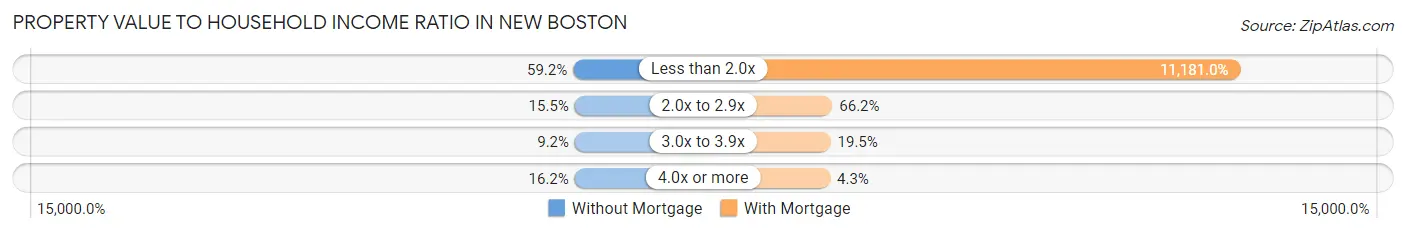
| Value-to-Income Ratio | Without Mortgage | With Mortgage |
| Less than 2.0x | 252 (59.2%) | 71,111 (11,181.0%) |
| 2.0x to 2.9x | 66 (15.5%) | 421 (66.2%) |
| 3.0x to 3.9x | 39 (9.1%) | 124 (19.5%) |
| 4.0x or more | 69 (16.2%) | 27 (4.3%) |
| Total | 426 (100.0%) | 636 (100.0%) |
Real Estate Taxes by Mortgage Status in New Boston
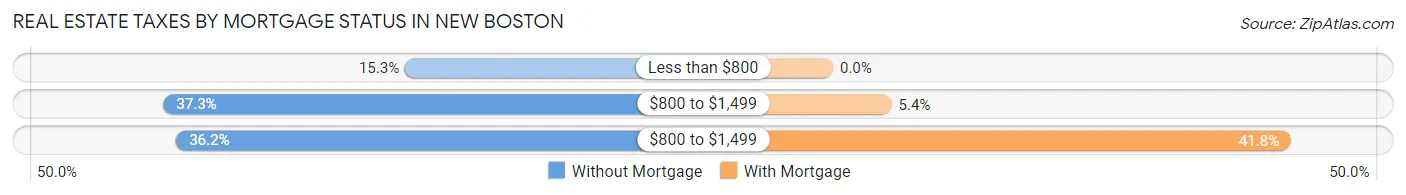
| Property Taxes | Without Mortgage | With Mortgage |
| Less than $800 | 65 (15.3%) | 0 (0.0%) |
| $800 to $1,499 | 159 (37.3%) | 34 (5.3%) |
| $800 to $1,499 | 154 (36.1%) | 266 (41.8%) |
| Total | 426 (100.0%) | 636 (100.0%) |
Health & Disability in New Boston
Health Insurance Coverage by Age in New Boston
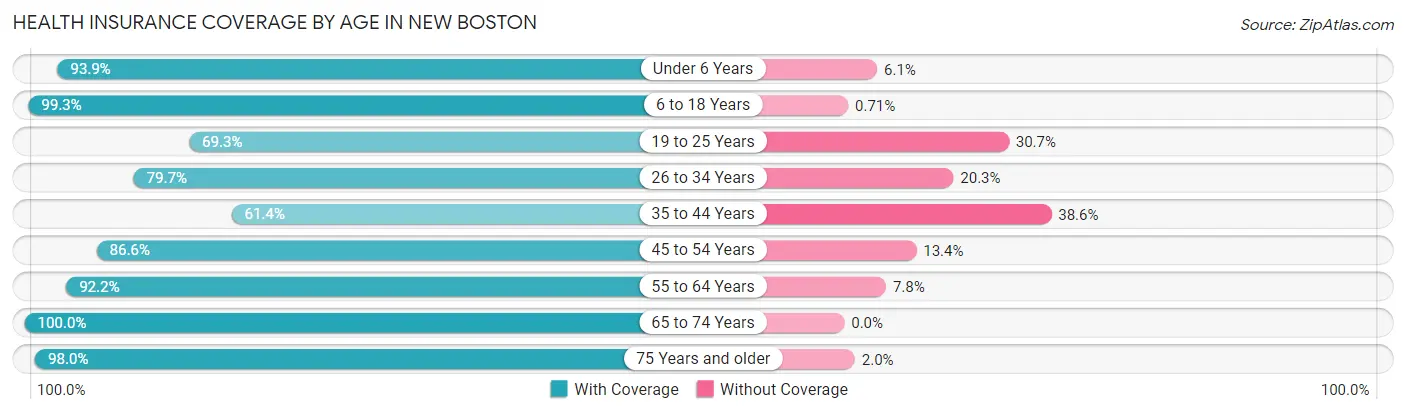
| Age Bracket | With Coverage | Without Coverage |
| Under 6 Years | 261 (93.9%) | 17 (6.1%) |
| 6 to 18 Years | 836 (99.3%) | 6 (0.7%) |
| 19 to 25 Years | 357 (69.3%) | 158 (30.7%) |
| 26 to 34 Years | 329 (79.7%) | 84 (20.3%) |
| 35 to 44 Years | 396 (61.4%) | 249 (38.6%) |
| 45 to 54 Years | 619 (86.6%) | 96 (13.4%) |
| 55 to 64 Years | 380 (92.2%) | 32 (7.8%) |
| 65 to 74 Years | 327 (100.0%) | 0 (0.0%) |
| 75 Years and older | 447 (98.0%) | 9 (2.0%) |
| Total | 3,952 (85.9%) | 651 (14.1%) |
Health Insurance Coverage by Citizenship Status in New Boston
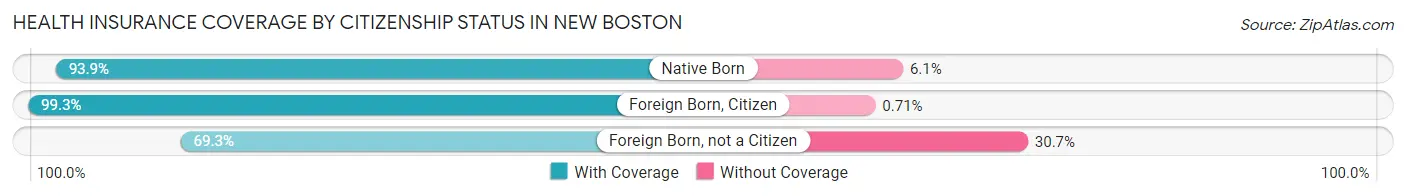
| Citizenship Status | With Coverage | Without Coverage |
| Native Born | 261 (93.9%) | 17 (6.1%) |
| Foreign Born, Citizen | 836 (99.3%) | 6 (0.7%) |
| Foreign Born, not a Citizen | 357 (69.3%) | 158 (30.7%) |
Health Insurance Coverage by Household Income in New Boston
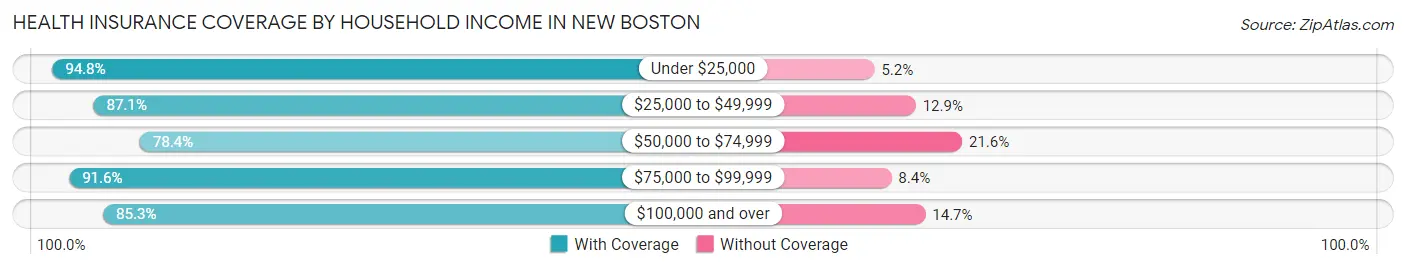
| Household Income | With Coverage | Without Coverage |
| Under $25,000 | 530 (94.8%) | 29 (5.2%) |
| $25,000 to $49,999 | 1,031 (87.1%) | 153 (12.9%) |
| $50,000 to $74,999 | 773 (78.4%) | 213 (21.6%) |
| $75,000 to $99,999 | 285 (91.6%) | 26 (8.4%) |
| $100,000 and over | 1,333 (85.3%) | 230 (14.7%) |
Public vs Private Health Insurance Coverage by Age in New Boston
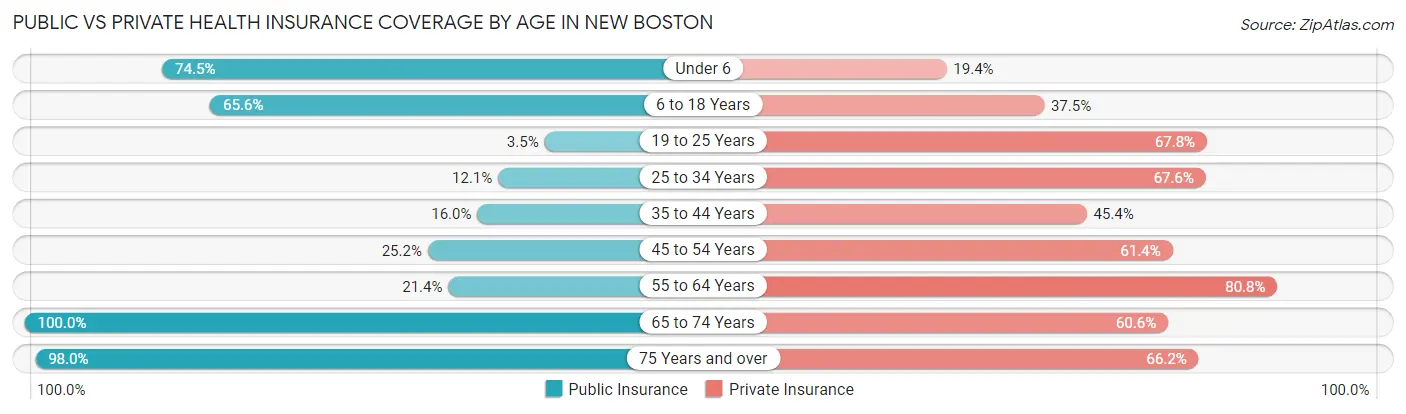
| Age Bracket | Public Insurance | Private Insurance |
| Under 6 | 207 (74.5%) | 54 (19.4%) |
| 6 to 18 Years | 552 (65.6%) | 316 (37.5%) |
| 19 to 25 Years | 18 (3.5%) | 349 (67.8%) |
| 25 to 34 Years | 50 (12.1%) | 279 (67.5%) |
| 35 to 44 Years | 103 (16.0%) | 293 (45.4%) |
| 45 to 54 Years | 180 (25.2%) | 439 (61.4%) |
| 55 to 64 Years | 88 (21.4%) | 333 (80.8%) |
| 65 to 74 Years | 327 (100.0%) | 198 (60.6%) |
| 75 Years and over | 447 (98.0%) | 302 (66.2%) |
| Total | 1,972 (42.8%) | 2,563 (55.7%) |
Disability Status by Sex by Age in New Boston
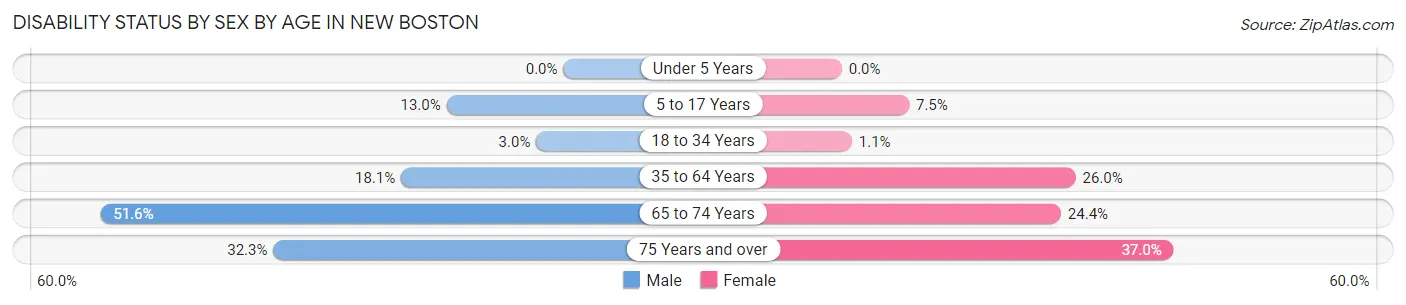
| Age Bracket | Male | Female |
| Under 5 Years | 0 (0.0%) | 0 (0.0%) |
| 5 to 17 Years | 54 (13.0%) | 35 (7.5%) |
| 18 to 34 Years | 15 (3.0%) | 5 (1.1%) |
| 35 to 64 Years | 160 (18.1%) | 231 (26.0%) |
| 65 to 74 Years | 82 (51.6%) | 41 (24.4%) |
| 75 Years and over | 73 (32.3%) | 85 (37.0%) |
Disability Class by Sex by Age in New Boston
Disability Class: Hearing Difficulty
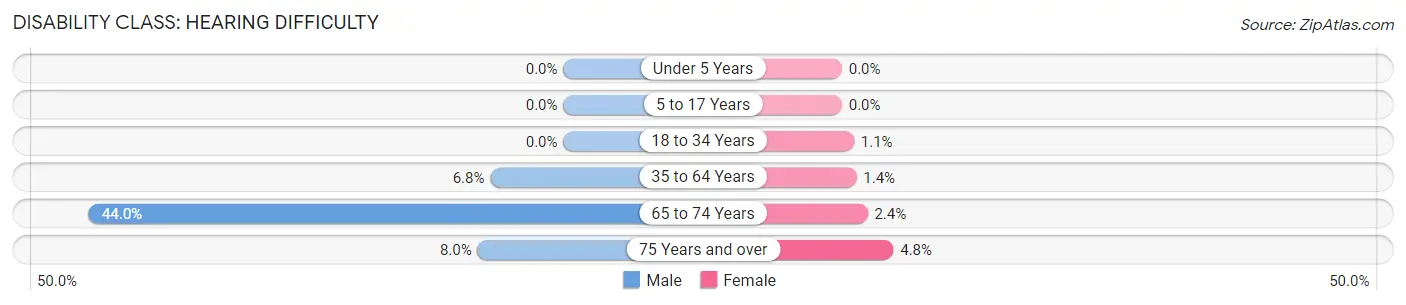
| Age Bracket | Male | Female |
| Under 5 Years | 0 (0.0%) | 0 (0.0%) |
| 5 to 17 Years | 0 (0.0%) | 0 (0.0%) |
| 18 to 34 Years | 0 (0.0%) | 5 (1.1%) |
| 35 to 64 Years | 60 (6.8%) | 12 (1.3%) |
| 65 to 74 Years | 70 (44.0%) | 4 (2.4%) |
| 75 Years and over | 18 (8.0%) | 11 (4.8%) |
Disability Class: Vision Difficulty
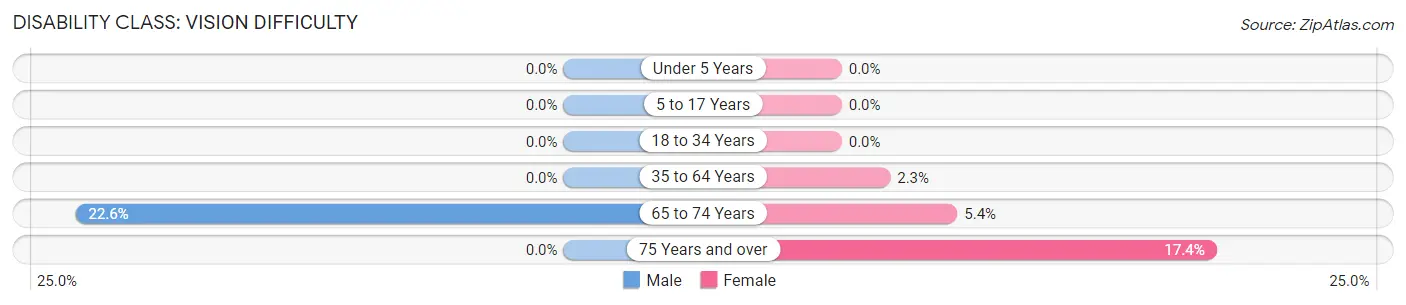
| Age Bracket | Male | Female |
| Under 5 Years | 0 (0.0%) | 0 (0.0%) |
| 5 to 17 Years | 0 (0.0%) | 0 (0.0%) |
| 18 to 34 Years | 0 (0.0%) | 0 (0.0%) |
| 35 to 64 Years | 0 (0.0%) | 20 (2.2%) |
| 65 to 74 Years | 36 (22.6%) | 9 (5.4%) |
| 75 Years and over | 0 (0.0%) | 40 (17.4%) |
Disability Class: Cognitive Difficulty
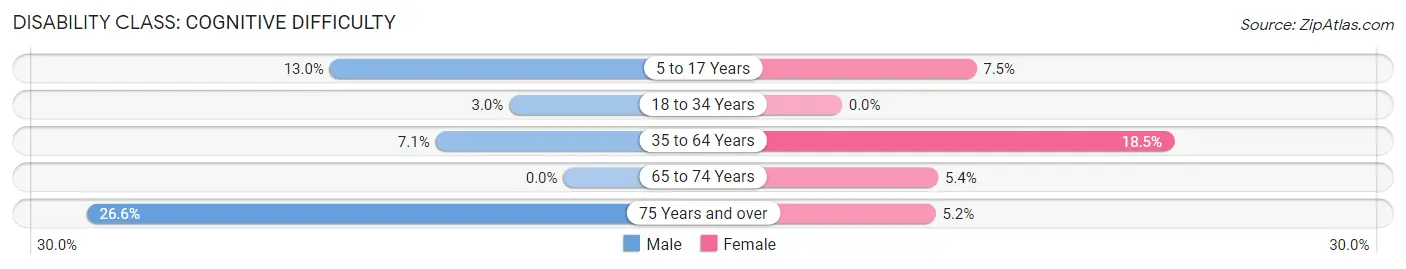
| Age Bracket | Male | Female |
| 5 to 17 Years | 54 (13.0%) | 35 (7.5%) |
| 18 to 34 Years | 15 (3.0%) | 0 (0.0%) |
| 35 to 64 Years | 63 (7.1%) | 164 (18.5%) |
| 65 to 74 Years | 0 (0.0%) | 9 (5.4%) |
| 75 Years and over | 60 (26.6%) | 12 (5.2%) |
Disability Class: Ambulatory Difficulty
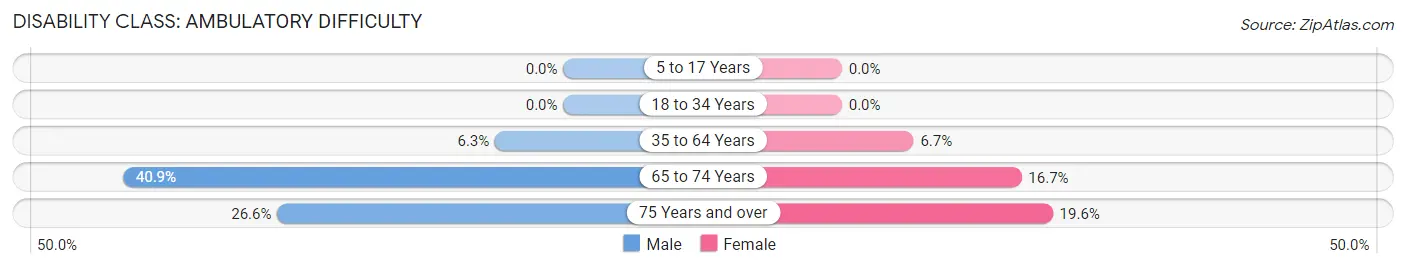
| Age Bracket | Male | Female |
| 5 to 17 Years | 0 (0.0%) | 0 (0.0%) |
| 18 to 34 Years | 0 (0.0%) | 0 (0.0%) |
| 35 to 64 Years | 56 (6.3%) | 59 (6.7%) |
| 65 to 74 Years | 65 (40.9%) | 28 (16.7%) |
| 75 Years and over | 60 (26.6%) | 45 (19.6%) |
Disability Class: Self-Care Difficulty
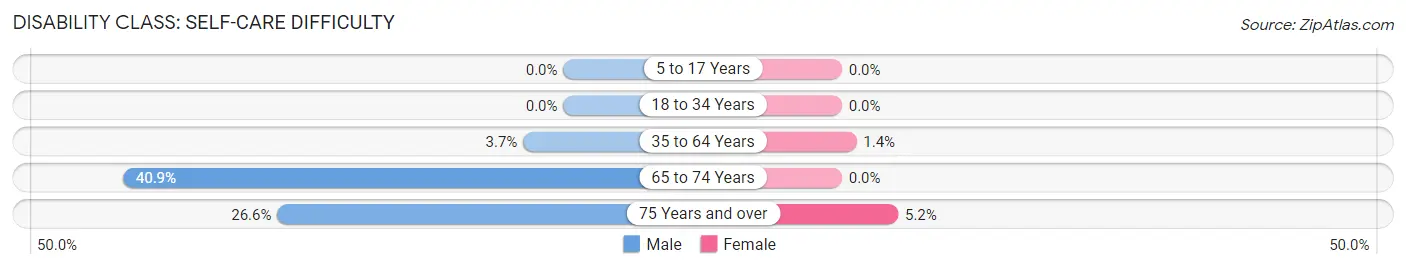
| Age Bracket | Male | Female |
| 5 to 17 Years | 0 (0.0%) | 0 (0.0%) |
| 18 to 34 Years | 0 (0.0%) | 0 (0.0%) |
| 35 to 64 Years | 33 (3.7%) | 12 (1.3%) |
| 65 to 74 Years | 65 (40.9%) | 0 (0.0%) |
| 75 Years and over | 60 (26.6%) | 12 (5.2%) |
Technology Access in New Boston
Computing Device Access in New Boston
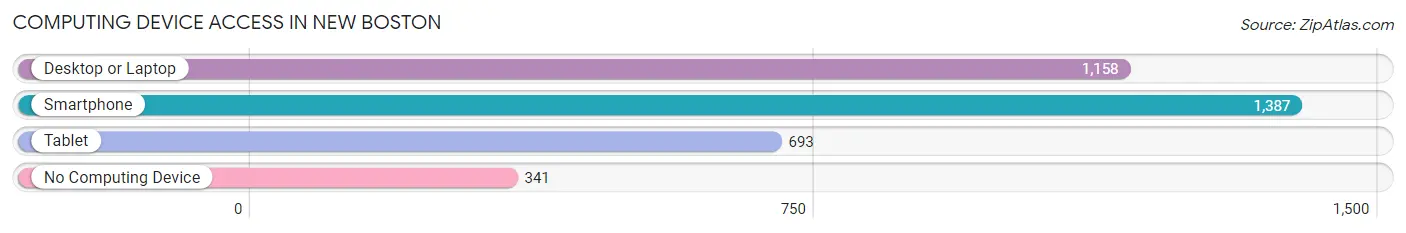
| Device Type | # Households | % Households |
| Desktop or Laptop | 1,158 | 62.4% |
| Smartphone | 1,387 | 74.8% |
| Tablet | 693 | 37.4% |
| No Computing Device | 341 | 18.4% |
| Total | 1,855 | 100.0% |
Internet Access in New Boston
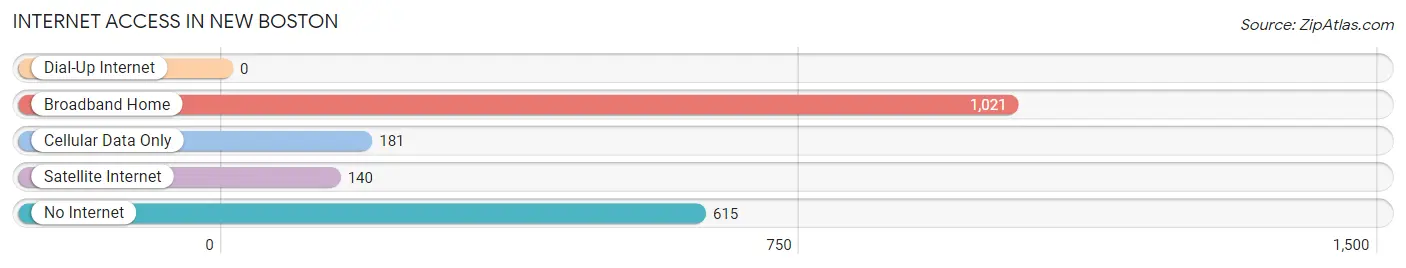
| Internet Type | # Households | % Households |
| Dial-Up Internet | 0 | 0.0% |
| Broadband Home | 1,021 | 55.0% |
| Cellular Data Only | 181 | 9.8% |
| Satellite Internet | 140 | 7.5% |
| No Internet | 615 | 33.2% |
| Total | 1,855 | 100.0% |
New Boston Summary
New Boston, Texas is a small city located in Bowie County, Texas. It is situated on the banks of the Red River, approximately 100 miles east of Dallas and 100 miles west of Texarkana. The city has a population of approximately 3,000 people and is the county seat of Bowie County.
History
New Boston was founded in 1836 by a group of settlers from the nearby town of Boston, Arkansas. The town was named after the original settlement and was incorporated in 1837. The town was originally a trading post and was used as a stopover for travelers heading west.
In 1845, the town was chosen as the county seat of Bowie County. The county courthouse was built in 1846 and the town began to grow. By the late 1800s, the town had become a major trading center for the surrounding area.
In the early 1900s, the town was connected to the rest of the state by the Texas and Pacific Railway. This allowed for the growth of the town and the surrounding area. The town was also home to a number of businesses, including a cotton gin, a flour mill, and a sawmill.
Geography
New Boston is located in the northeast corner of Texas, approximately 100 miles east of Dallas and 100 miles west of Texarkana. The city is situated on the banks of the Red River and is surrounded by rolling hills and wooded areas. The city has a total area of 4.2 square miles, all of which is land.
The climate in New Boston is classified as humid subtropical, with hot summers and mild winters. The average annual temperature is 68 degrees Fahrenheit, with an average high of 91 degrees in the summer and an average low of 44 degrees in the winter. The average annual precipitation is 40 inches.
Economy
The economy of New Boston is largely based on agriculture and manufacturing. The city is home to a number of agricultural businesses, including a cotton gin, a flour mill, and a sawmill. The city is also home to a number of manufacturing businesses, including a furniture factory, a plastics factory, and a metal fabrication plant.
The city is also home to a number of retail businesses, including a grocery store, a hardware store, and a number of restaurants. The city is also home to a number of service businesses, including a bank, a post office, and a number of medical offices.
Demographics
As of the 2010 census, the population of New Boston was 3,000. The racial makeup of the city was 79.2% White, 17.2% African American, 0.7% Native American, 0.3% Asian, 0.1% Pacific Islander, and 2.5% from other races. Hispanic or Latino of any race were 4.3% of the population.
The median household income in New Boston was $31,250, and the median family income was $37,500. The per capita income in the city was $15,845. About 17.2% of the population was below the poverty line.
New Boston is a small city with a rich history and a diverse economy. The city is home to a number of businesses, including agricultural, manufacturing, retail, and service businesses. The city is also home to a diverse population, with a mix of races and ethnicities. The city is a great place to live and work, and is a great place to visit.
Common Questions
What is Per Capita Income in New Boston?
Per Capita income in New Boston is $35,504.
What is the Median Family Income in New Boston?
Median Family Income in New Boston is $61,676.
What is the Median Household income in New Boston?
Median Household Income in New Boston is $59,030.
What is Income or Wage Gap in New Boston?
Income or Wage Gap in New Boston is 31.9%.
Women in New Boston earn 68.1 cents for every dollar earned by a man.
What is Inequality or Gini Index in New Boston?
Inequality or Gini Index in New Boston is 0.50.
What is the Total Population of New Boston?
Total Population of New Boston is 4,625.
What is the Total Male Population of New Boston?
Total Male Population of New Boston is 2,346.
What is the Total Female Population of New Boston?
Total Female Population of New Boston is 2,279.
What is the Ratio of Males per 100 Females in New Boston?
There are 102.94 Males per 100 Females in New Boston.
What is the Ratio of Females per 100 Males in New Boston?
There are 97.14 Females per 100 Males in New Boston.
What is the Median Population Age in New Boston?
Median Population Age in New Boston is 38.4 Years.
What is the Average Family Size in New Boston
Average Family Size in New Boston is 3.3 People.
What is the Average Household Size in New Boston
Average Household Size in New Boston is 2.5 People.
How Large is the Labor Force in New Boston?
There are 2,163 People in the Labor Forcein in New Boston.
What is the Percentage of People in the Labor Force in New Boston?
60.1% of People are in the Labor Force in New Boston.
What is the Unemployment Rate in New Boston?
Unemployment Rate in New Boston is 7.3%.