Roscoe, TX Map & Demographics
Roscoe Map
Roscoe Overview
$23,337
PER CAPITA INCOME
$51,905
AVG FAMILY INCOME
$44,375
AVG HOUSEHOLD INCOME
24.7%
WAGE / INCOME GAP [ % ]
75.3¢/ $1
WAGE / INCOME GAP [ $ ]
0.41
INEQUALITY / GINI INDEX
1,465
TOTAL POPULATION
748
MALE POPULATION
717
FEMALE POPULATION
104.32
MALES / 100 FEMALES
95.86
FEMALES / 100 MALES
30.2
MEDIAN AGE
3.4
AVG FAMILY SIZE
2.9
AVG HOUSEHOLD SIZE
695
LABOR FORCE [ PEOPLE ]
61.6%
PERCENT IN LABOR FORCE
7.2%
UNEMPLOYMENT RATE
Roscoe Zip Codes
Roscoe Area Codes
Income in Roscoe
Income Overview in Roscoe
Per Capita Income in Roscoe is $23,337, while median incomes of families and households are $51,905 and $44,375 respectively.
| Characteristic | Number | Measure |
| Per Capita Income | 1,465 | $23,337 |
| Median Family Income | 376 | $51,905 |
| Mean Family Income | 376 | $69,951 |
| Median Household Income | 511 | $44,375 |
| Mean Household Income | 511 | $62,677 |
| Income Deficit | 376 | $0 |
| Wage / Income Gap (%) | 1,465 | 24.73% |
| Wage / Income Gap ($) | 1,465 | 75.27¢ per $1 |
| Gini / Inequality Index | 1,465 | 0.41 |
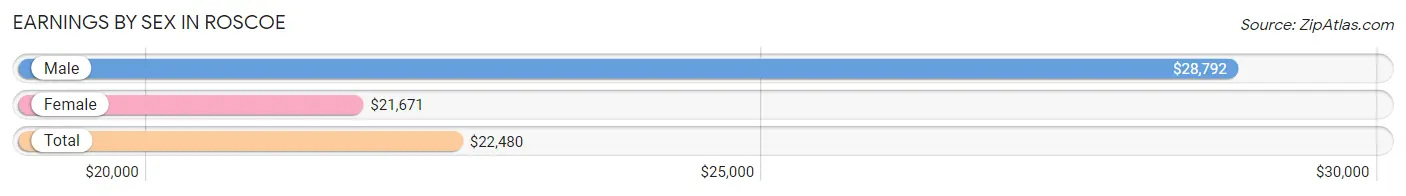
Earnings by Sex in Roscoe
Average Earnings in Roscoe are $22,480, $28,792 for men and $21,671 for women, a difference of 24.7%.
| Sex | Number | Average Earnings |
| Male | 447 (56.3%) | $28,792 |
| Female | 347 (43.7%) | $21,671 |
| Total | 794 (100.0%) | $22,480 |
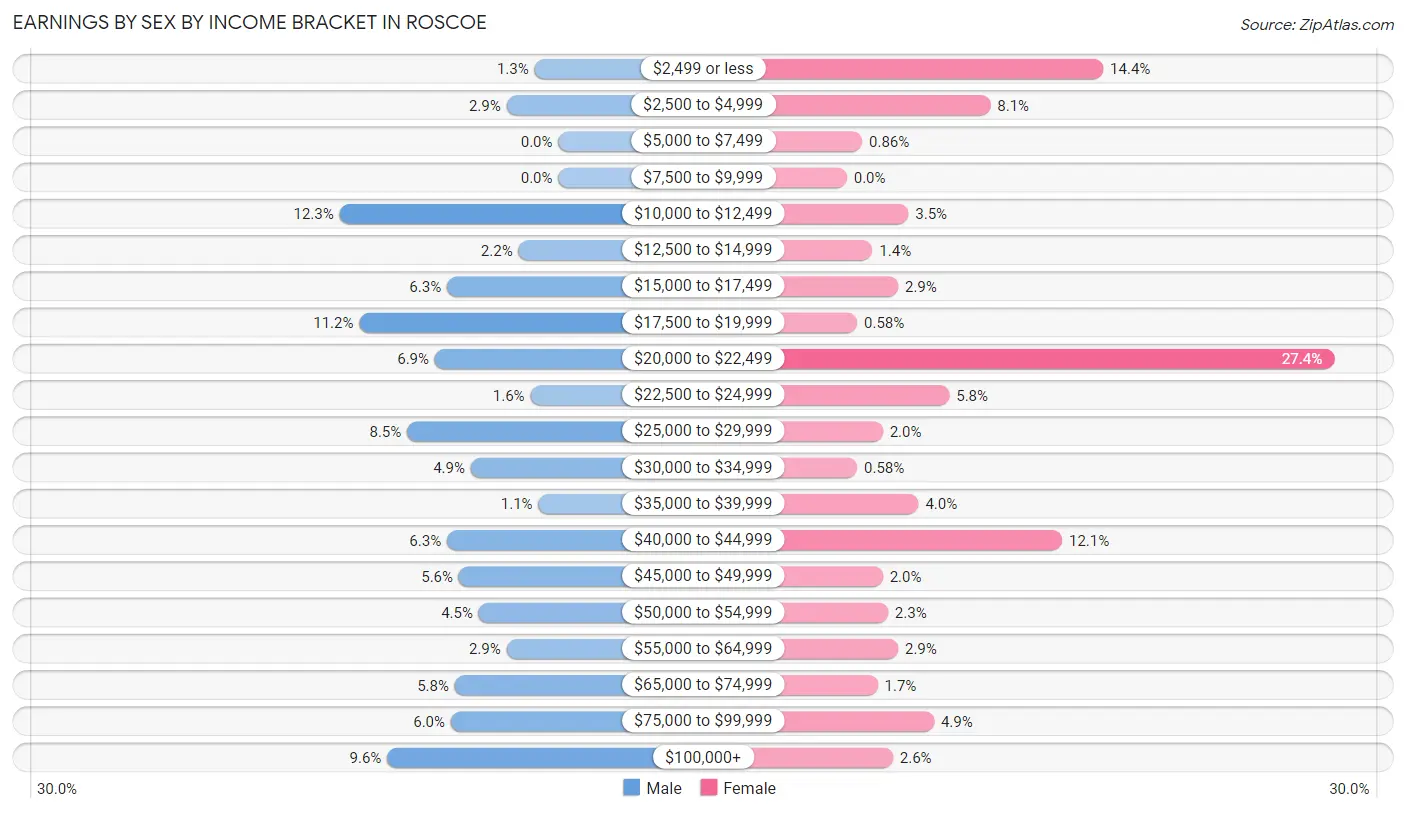
Earnings by Sex by Income Bracket in Roscoe
The most common earnings brackets in Roscoe are $10,000 to $12,499 for men (55 | 12.3%) and $20,000 to $22,499 for women (95 | 27.4%).
| Income | Male | Female |
| $2,499 or less | 6 (1.3%) | 50 (14.4%) |
| $2,500 to $4,999 | 13 (2.9%) | 28 (8.1%) |
| $5,000 to $7,499 | 0 (0.0%) | 3 (0.9%) |
| $7,500 to $9,999 | 0 (0.0%) | 0 (0.0%) |
| $10,000 to $12,499 | 55 (12.3%) | 12 (3.5%) |
| $12,500 to $14,999 | 10 (2.2%) | 5 (1.4%) |
| $15,000 to $17,499 | 28 (6.3%) | 10 (2.9%) |
| $17,500 to $19,999 | 50 (11.2%) | 2 (0.6%) |
| $20,000 to $22,499 | 31 (6.9%) | 95 (27.4%) |
| $22,500 to $24,999 | 7 (1.6%) | 20 (5.8%) |
| $25,000 to $29,999 | 38 (8.5%) | 7 (2.0%) |
| $30,000 to $34,999 | 22 (4.9%) | 2 (0.6%) |
| $35,000 to $39,999 | 5 (1.1%) | 14 (4.0%) |
| $40,000 to $44,999 | 28 (6.3%) | 42 (12.1%) |
| $45,000 to $49,999 | 25 (5.6%) | 7 (2.0%) |
| $50,000 to $54,999 | 20 (4.5%) | 8 (2.3%) |
| $55,000 to $64,999 | 13 (2.9%) | 10 (2.9%) |
| $65,000 to $74,999 | 26 (5.8%) | 6 (1.7%) |
| $75,000 to $99,999 | 27 (6.0%) | 17 (4.9%) |
| $100,000+ | 43 (9.6%) | 9 (2.6%) |
| Total | 447 (100.0%) | 347 (100.0%) |
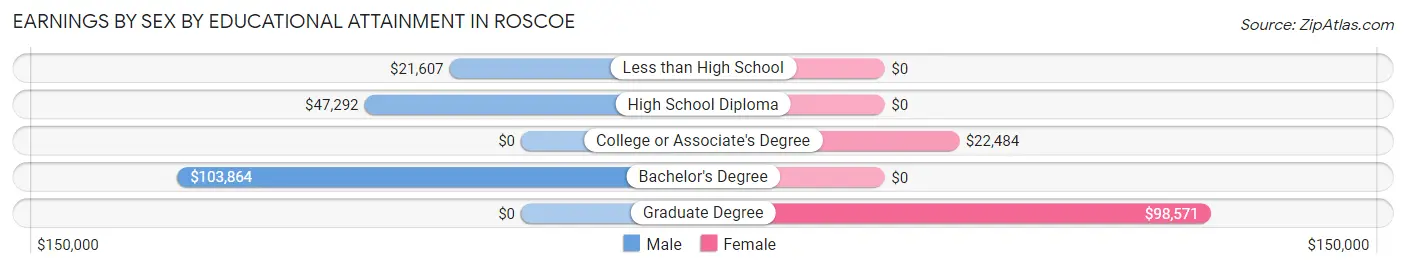
Earnings by Sex by Educational Attainment in Roscoe
Average earnings in Roscoe are $45,208 for men and $22,184 for women, a difference of 50.9%. Men with an educational attainment of bachelor's degree enjoy the highest average annual earnings of $103,864, while those with less than high school education earn the least with $21,607. Women with an educational attainment of graduate degree earn the most with the average annual earnings of $98,571, while those with college or associate's degree education have the smallest earnings of $22,484.
| Educational Attainment | Male Income | Female Income |
| Less than High School | $21,607 | $0 |
| High School Diploma | $47,292 | $0 |
| College or Associate's Degree | - | - |
| Bachelor's Degree | $103,864 | $0 |
| Graduate Degree | - | - |
| Total | $45,208 | $22,184 |
Family Income in Roscoe
Family Income Brackets in Roscoe
According to the Roscoe family income data, there are 78 families falling into the $15,000 to $24,999 income range, which is the most common income bracket and makes up 20.7% of all families.
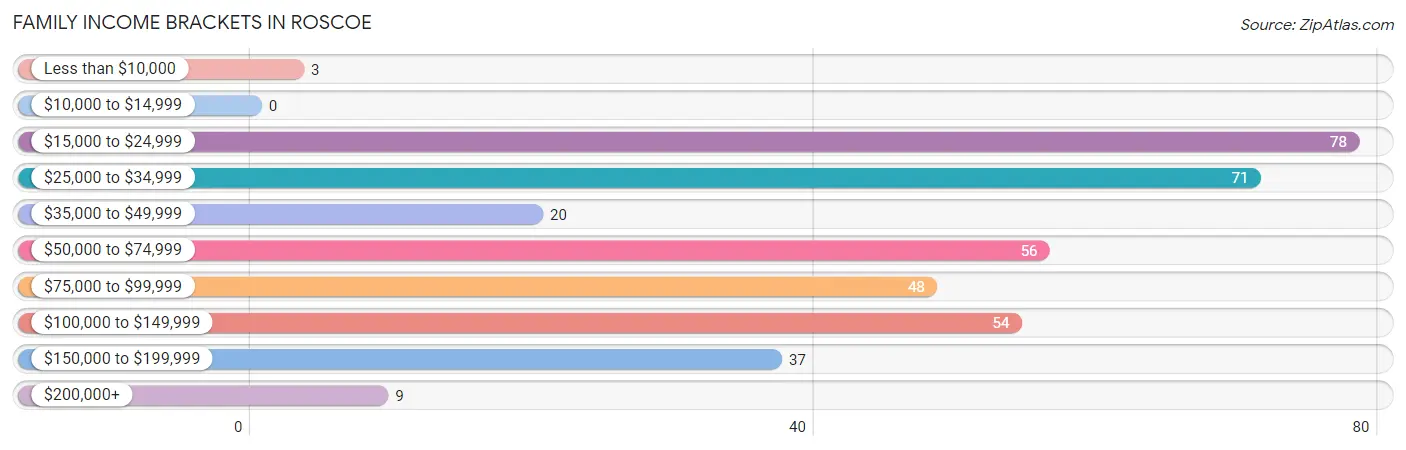
| Income Bracket | # Families | % Families |
| Less than $10,000 | 3 | 0.8% |
| $10,000 to $14,999 | 0 | 0.0% |
| $15,000 to $24,999 | 78 | 20.7% |
| $25,000 to $34,999 | 71 | 18.9% |
| $35,000 to $49,999 | 20 | 5.3% |
| $50,000 to $74,999 | 56 | 14.9% |
| $75,000 to $99,999 | 48 | 12.8% |
| $100,000 to $149,999 | 54 | 14.4% |
| $150,000 to $199,999 | 37 | 9.8% |
| $200,000+ | 9 | 2.4% |
Family Income by Famaliy Size in Roscoe
5-person families (42 | 11.2%) account for the highest median family income in Roscoe with $152,813 per family, while 2-person families (98 | 26.1%) have the highest median income of $30,938 per family member.
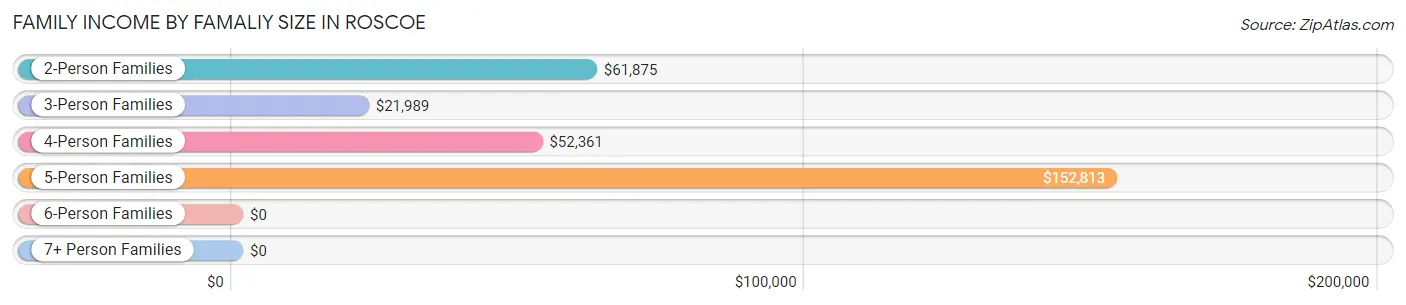
| Income Bracket | # Families | Median Income |
| 2-Person Families | 98 (26.1%) | $61,875 |
| 3-Person Families | 113 (30.0%) | $21,989 |
| 4-Person Families | 98 (26.1%) | $52,361 |
| 5-Person Families | 42 (11.2%) | $152,813 |
| 6-Person Families | 19 (5.1%) | $0 |
| 7+ Person Families | 6 (1.6%) | $0 |
| Total | 376 (100.0%) | $51,905 |
Family Income by Number of Earners in Roscoe
The median family income in Roscoe is $51,905, with families comprising 3+ earners (46) having the highest median family income of $152,813, while families with 1 earner (185) have the lowest median family income of $29,042, accounting for 12.2% and 49.2% of families, respectively.
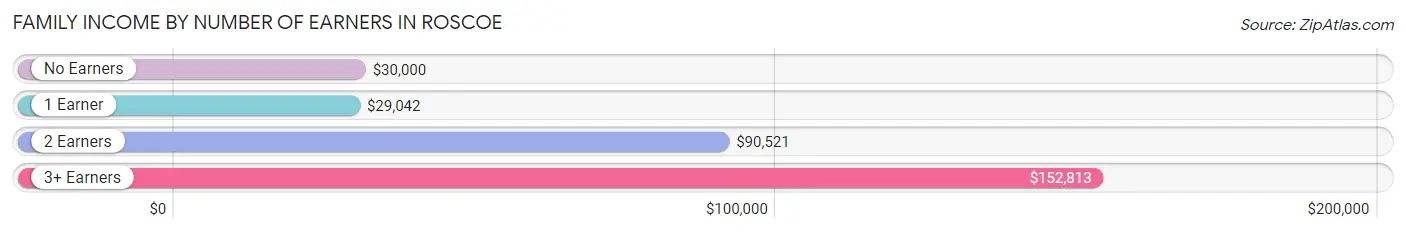
| Number of Earners | # Families | Median Income |
| No Earners | 34 (9.0%) | $30,000 |
| 1 Earner | 185 (49.2%) | $29,042 |
| 2 Earners | 111 (29.5%) | $90,521 |
| 3+ Earners | 46 (12.2%) | $152,813 |
| Total | 376 (100.0%) | $51,905 |
Household Income in Roscoe
Household Income Brackets in Roscoe
With 121 households falling in the category, the $15,000 to $24,999 income range is the most frequent in Roscoe, accounting for 23.7% of all households. In contrast, only 5 households (1.0%) fall into the less than $10,000 income bracket, making it the least populous group.
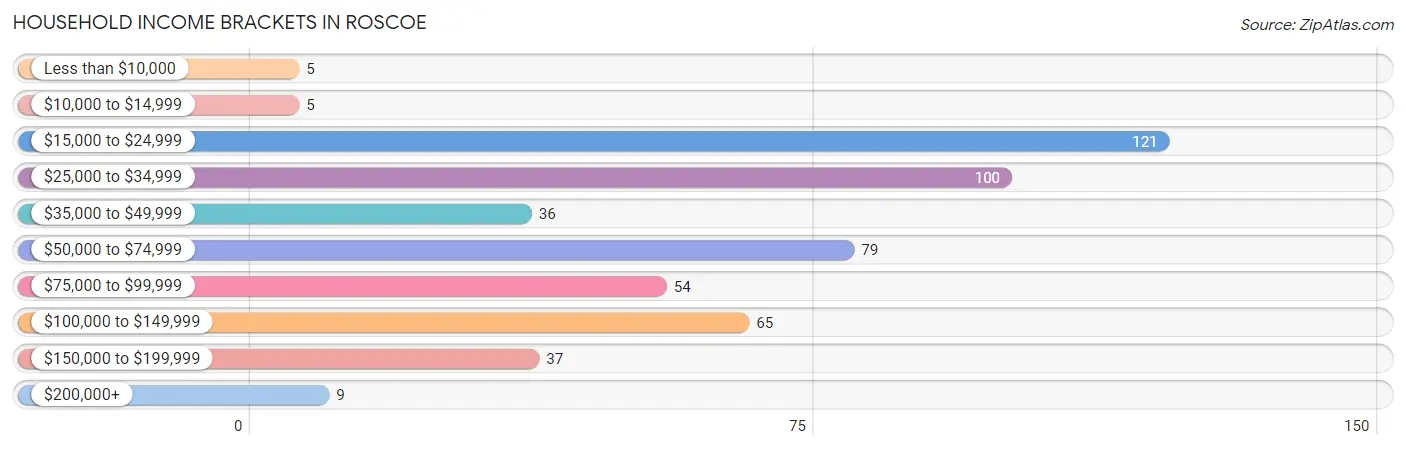
| Income Bracket | # Households | % Households |
| Less than $10,000 | 5 | 1.0% |
| $10,000 to $14,999 | 5 | 1.0% |
| $15,000 to $24,999 | 121 | 23.7% |
| $25,000 to $34,999 | 100 | 19.6% |
| $35,000 to $49,999 | 36 | 7.0% |
| $50,000 to $74,999 | 79 | 15.5% |
| $75,000 to $99,999 | 54 | 10.6% |
| $100,000 to $149,999 | 65 | 12.7% |
| $150,000 to $199,999 | 37 | 7.2% |
| $200,000+ | 9 | 1.8% |
Household Income by Householder Age in Roscoe
The median household income in Roscoe is $44,375, with the highest median household income of $69,861 found in the 45 to 64 years age bracket for the primary householder. A total of 171 households (33.5%) fall into this category. Meanwhile, the 15 to 24 years age bracket for the primary householder has the lowest median household income of $0, with 12 households (2.4%) in this group.
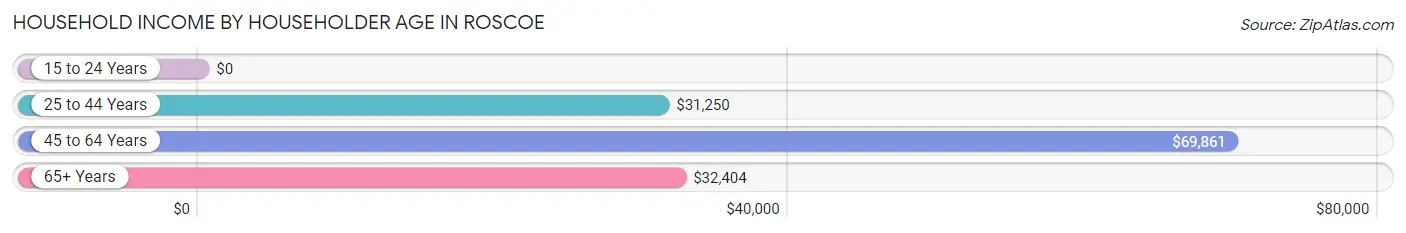
| Income Bracket | # Households | Median Income |
| 15 to 24 Years | 12 (2.4%) | $0 |
| 25 to 44 Years | 239 (46.8%) | $31,250 |
| 45 to 64 Years | 171 (33.5%) | $69,861 |
| 65+ Years | 89 (17.4%) | $32,404 |
| Total | 511 (100.0%) | $44,375 |
Poverty in Roscoe
Income Below Poverty by Sex and Age in Roscoe
With 6.6% poverty level for males and 21.5% for females among the residents of Roscoe, 15 year old males and 25 to 34 year old females are the most vulnerable to poverty, with 11 males (100.0%) and 71 females (53.0%) in their respective age groups living below the poverty level.
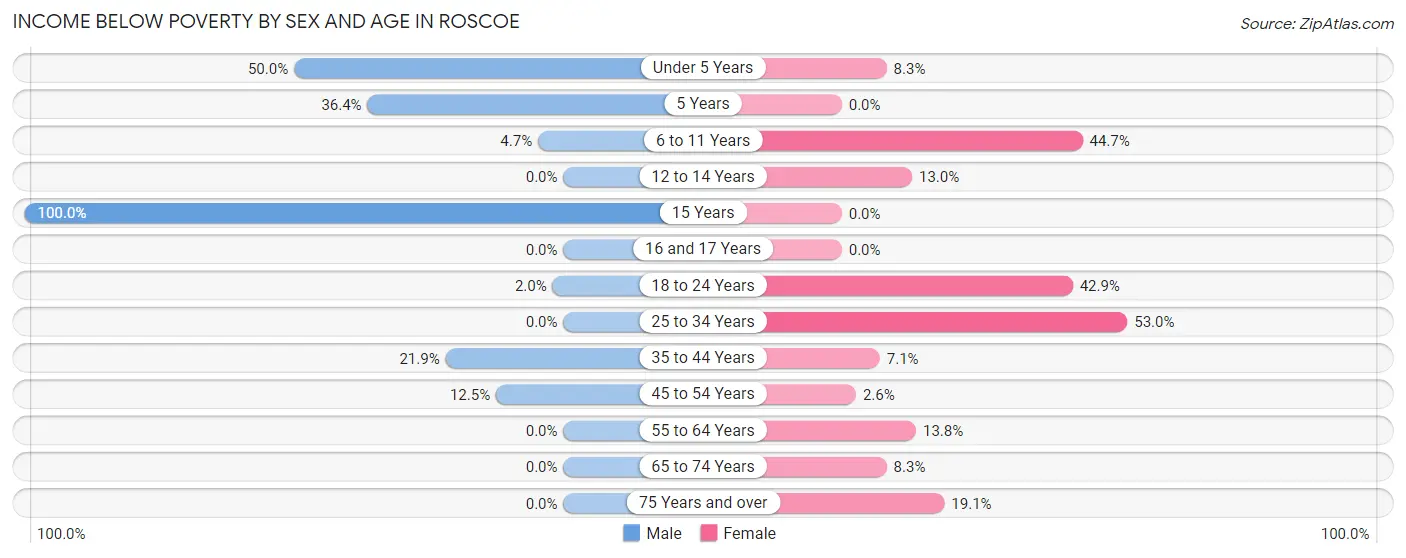
| Age Bracket | Male | Female |
| Under 5 Years | 8 (50.0%) | 4 (8.3%) |
| 5 Years | 4 (36.4%) | 0 (0.0%) |
| 6 to 11 Years | 4 (4.7%) | 21 (44.7%) |
| 12 to 14 Years | 0 (0.0%) | 3 (13.0%) |
| 15 Years | 11 (100.0%) | 0 (0.0%) |
| 16 and 17 Years | 0 (0.0%) | 0 (0.0%) |
| 18 to 24 Years | 3 (2.0%) | 24 (42.9%) |
| 25 to 34 Years | 0 (0.0%) | 71 (53.0%) |
| 35 to 44 Years | 7 (21.9%) | 6 (7.1%) |
| 45 to 54 Years | 12 (12.5%) | 3 (2.6%) |
| 55 to 64 Years | 0 (0.0%) | 4 (13.8%) |
| 65 to 74 Years | 0 (0.0%) | 2 (8.3%) |
| 75 Years and over | 0 (0.0%) | 16 (19.1%) |
| Total | 49 (6.6%) | 154 (21.5%) |
Income Above Poverty by Sex and Age in Roscoe
According to the poverty statistics in Roscoe, males aged 12 to 14 years and females aged 5 years are the age groups that are most secure financially, with 100.0% of males and 100.0% of females in these age groups living above the poverty line.
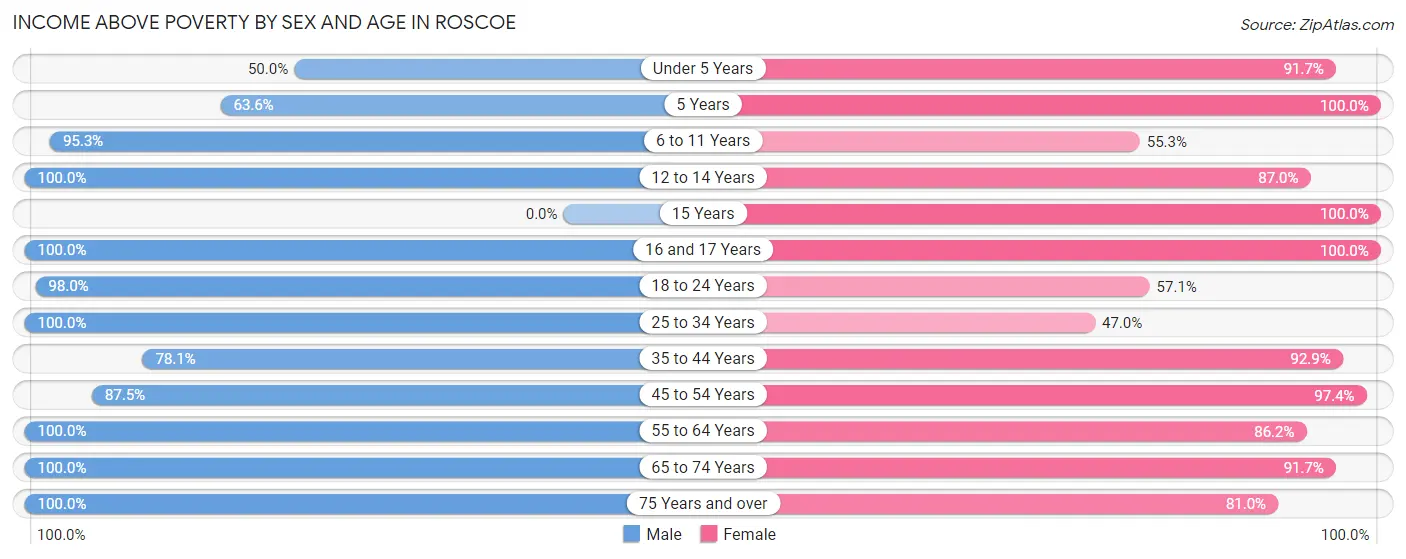
| Age Bracket | Male | Female |
| Under 5 Years | 8 (50.0%) | 44 (91.7%) |
| 5 Years | 7 (63.6%) | 52 (100.0%) |
| 6 to 11 Years | 81 (95.3%) | 26 (55.3%) |
| 12 to 14 Years | 41 (100.0%) | 20 (87.0%) |
| 15 Years | 0 (0.0%) | 3 (100.0%) |
| 16 and 17 Years | 21 (100.0%) | 18 (100.0%) |
| 18 to 24 Years | 146 (98.0%) | 32 (57.1%) |
| 25 to 34 Years | 164 (100.0%) | 63 (47.0%) |
| 35 to 44 Years | 25 (78.1%) | 79 (92.9%) |
| 45 to 54 Years | 84 (87.5%) | 111 (97.4%) |
| 55 to 64 Years | 39 (100.0%) | 25 (86.2%) |
| 65 to 74 Years | 27 (100.0%) | 22 (91.7%) |
| 75 Years and over | 56 (100.0%) | 68 (80.9%) |
| Total | 699 (93.4%) | 563 (78.5%) |
Income Below Poverty Among Married-Couple Families in Roscoe
The poverty statistics for married-couple families in Roscoe show that 4.1% or 9 of the total 220 families live below the poverty line. Families with 1 or 2 children have the highest poverty rate of 8.1%, comprising of 7 families. On the other hand, families with no children have the lowest poverty rate of 0.0%, which includes 0 families.
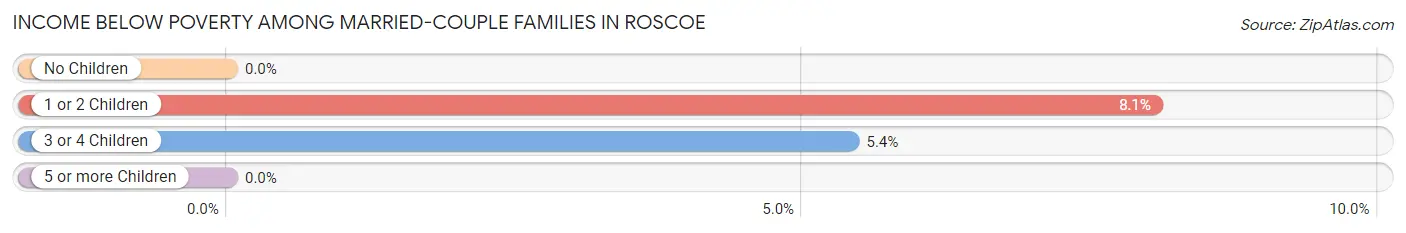
| Children | Above Poverty | Below Poverty |
| No Children | 96 (100.0%) | 0 (0.0%) |
| 1 or 2 Children | 80 (91.9%) | 7 (8.1%) |
| 3 or 4 Children | 35 (94.6%) | 2 (5.4%) |
| 5 or more Children | 0 (0.0%) | 0 (0.0%) |
| Total | 211 (95.9%) | 9 (4.1%) |
Income Below Poverty Among Single-Parent Households in Roscoe
According to the poverty data in Roscoe, 16.3% or 7 single-father households and 65.5% or 74 single-mother households are living below the poverty line. Among single-father households, those with no children have the highest poverty rate, with 7 households (100.0%) experiencing poverty. Likewise, among single-mother households, those with 1 or 2 children have the highest poverty rate, with 74 households (89.2%) falling below the poverty line.
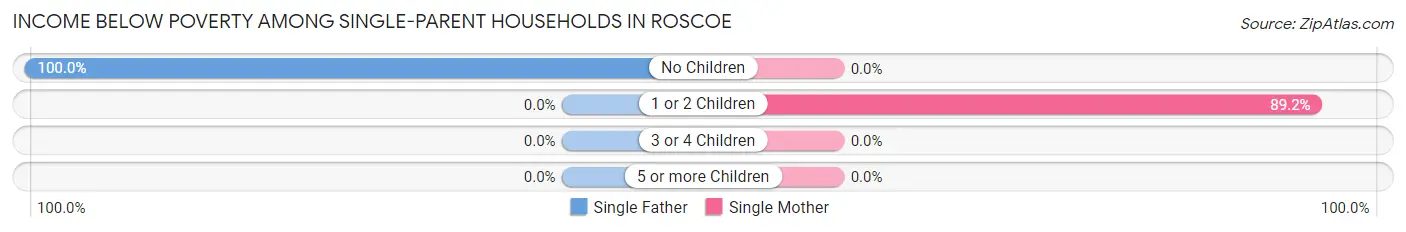
| Children | Single Father | Single Mother |
| No Children | 7 (100.0%) | 0 (0.0%) |
| 1 or 2 Children | 0 (0.0%) | 74 (89.2%) |
| 3 or 4 Children | 0 (0.0%) | 0 (0.0%) |
| 5 or more Children | 0 (0.0%) | 0 (0.0%) |
| Total | 7 (16.3%) | 74 (65.5%) |
Income Below Poverty Among Married-Couple vs Single-Parent Households in Roscoe
The poverty data for Roscoe shows that 9 of the married-couple family households (4.1%) and 81 of the single-parent households (51.9%) are living below the poverty level. Within the married-couple family households, those with 1 or 2 children have the highest poverty rate, with 7 households (8.1%) falling below the poverty line. Among the single-parent households, those with 1 or 2 children have the highest poverty rate, with 74 household (62.2%) living below poverty.
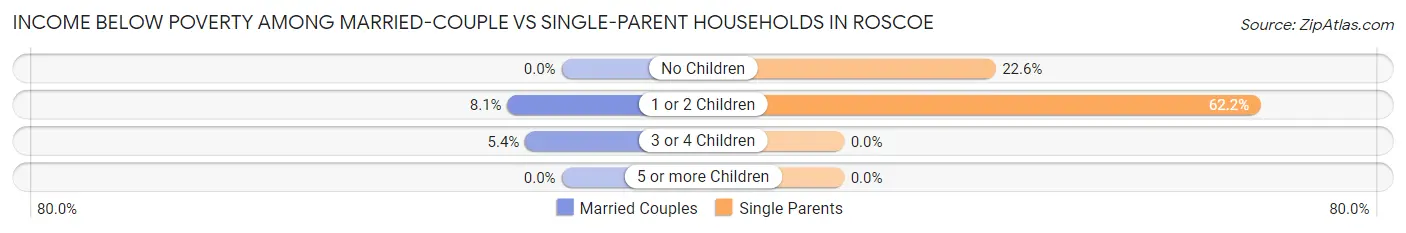
| Children | Married-Couple Families | Single-Parent Households |
| No Children | 0 (0.0%) | 7 (22.6%) |
| 1 or 2 Children | 7 (8.1%) | 74 (62.2%) |
| 3 or 4 Children | 2 (5.4%) | 0 (0.0%) |
| 5 or more Children | 0 (0.0%) | 0 (0.0%) |
| Total | 9 (4.1%) | 81 (51.9%) |
Race in Roscoe
The most populous races in Roscoe are White / Caucasian (1,214 | 82.9%), Hispanic or Latino (833 | 56.9%), and Two or more Races (180 | 12.3%).
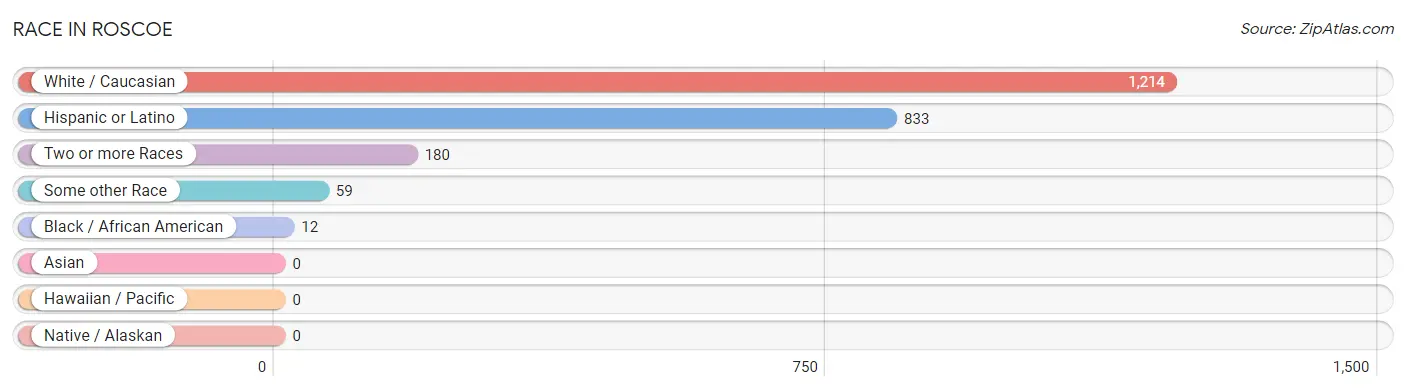
| Race | # Population | % Population |
| Asian | 0 | 0.0% |
| Black / African American | 12 | 0.8% |
| Hawaiian / Pacific | 0 | 0.0% |
| Hispanic or Latino | 833 | 56.9% |
| Native / Alaskan | 0 | 0.0% |
| White / Caucasian | 1,214 | 82.9% |
| Two or more Races | 180 | 12.3% |
| Some other Race | 59 | 4.0% |
| Total | 1,465 | 100.0% |
Ancestry in Roscoe
The most populous ancestries reported in Roscoe are Mexican (784 | 53.5%), German (215 | 14.7%), American (152 | 10.4%), Irish (111 | 7.6%), and English (35 | 2.4%), together accounting for 88.6% of all Roscoe residents.
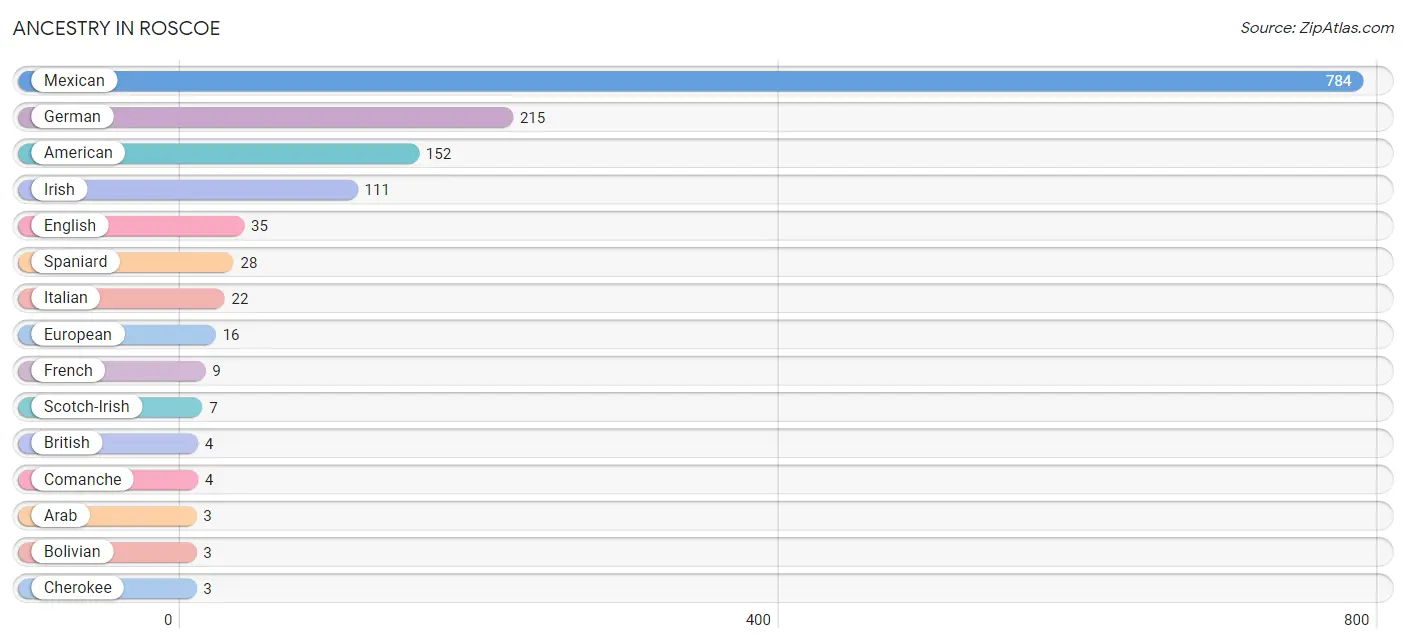
| Ancestry | # Population | % Population |
| American | 152 | 10.4% |
| Arab | 3 | 0.2% |
| Bolivian | 3 | 0.2% |
| British | 4 | 0.3% |
| Cherokee | 3 | 0.2% |
| Comanche | 4 | 0.3% |
| Dutch | 3 | 0.2% |
| English | 35 | 2.4% |
| European | 16 | 1.1% |
| French | 9 | 0.6% |
| German | 215 | 14.7% |
| Irish | 111 | 7.6% |
| Italian | 22 | 1.5% |
| Mexican | 784 | 53.5% |
| Norwegian | 2 | 0.1% |
| Scotch-Irish | 7 | 0.5% |
| South American | 3 | 0.2% |
| Spaniard | 28 | 1.9% | View All 18 Rows |
Immigrants in Roscoe
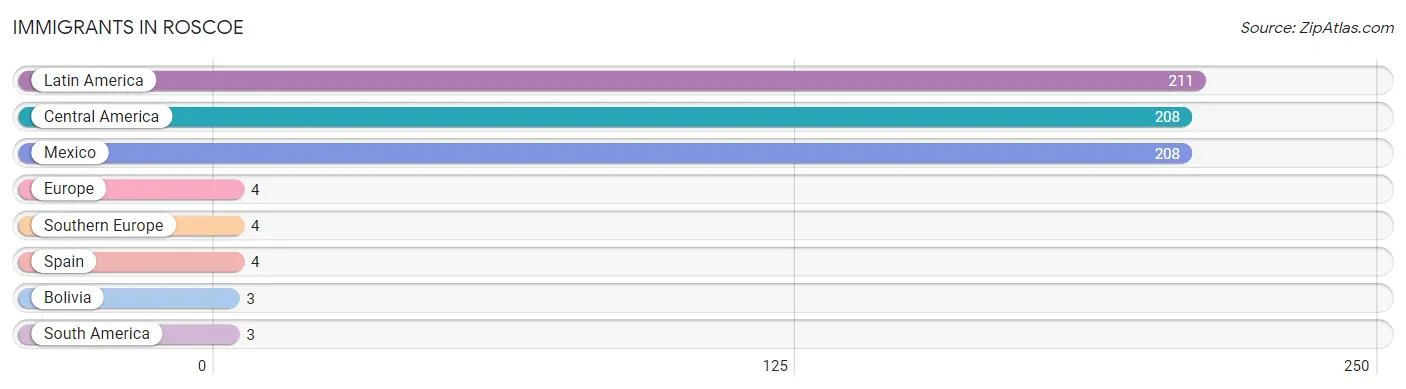
The most numerous immigrant groups reported in Roscoe came from Latin America (211 | 14.4%), Central America (208 | 14.2%), Mexico (208 | 14.2%), Europe (4 | 0.3%), and Southern Europe (4 | 0.3%), together accounting for 43.3% of all Roscoe residents.
| Immigration Origin | # Population | % Population |
| Bolivia | 3 | 0.2% |
| Central America | 208 | 14.2% |
| Europe | 4 | 0.3% |
| Latin America | 211 | 14.4% |
| Mexico | 208 | 14.2% |
| South America | 3 | 0.2% |
| Southern Europe | 4 | 0.3% |
| Spain | 4 | 0.3% | View All 8 Rows |
Sex and Age in Roscoe
Sex and Age in Roscoe
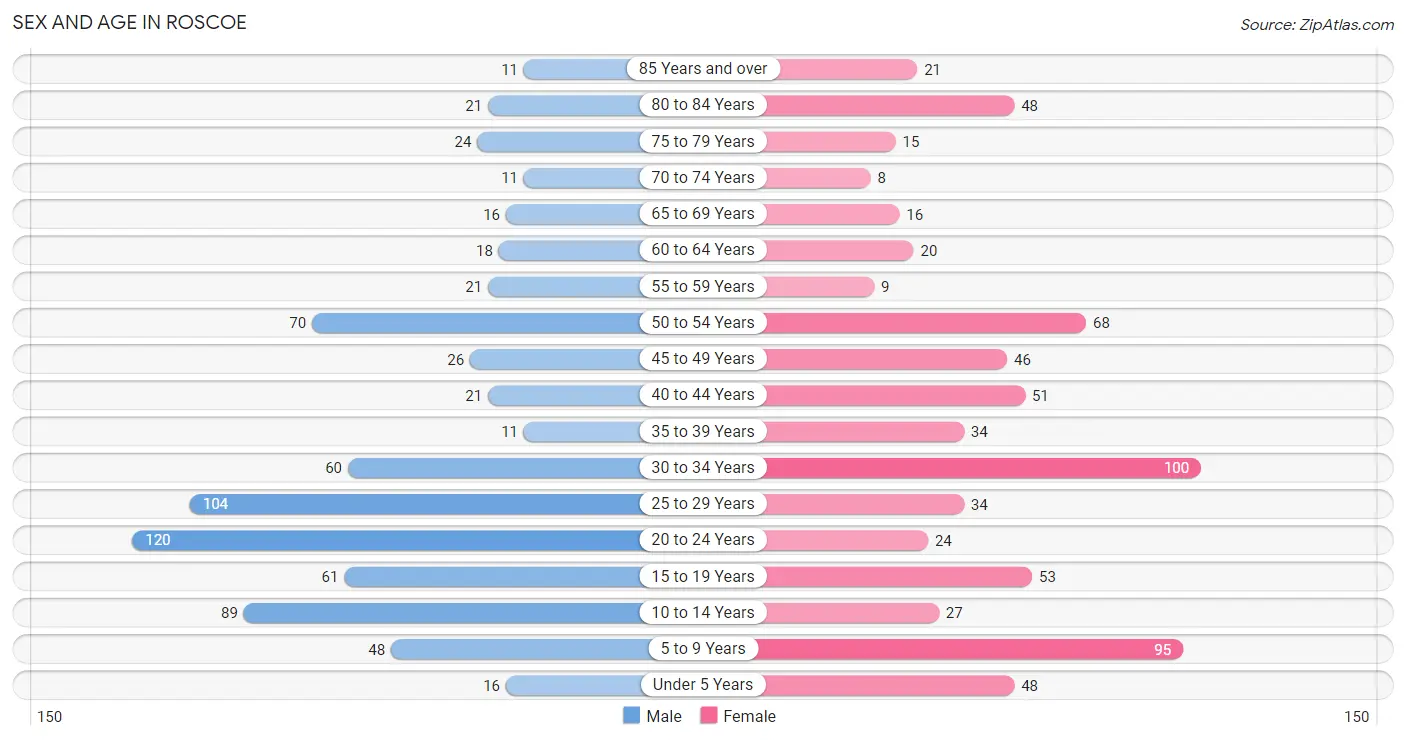
The most populous age groups in Roscoe are 20 to 24 Years (120 | 16.0%) for men and 30 to 34 Years (100 | 14.0%) for women.
| Age Bracket | Male | Female |
| Under 5 Years | 16 (2.1%) | 48 (6.7%) |
| 5 to 9 Years | 48 (6.4%) | 95 (13.3%) |
| 10 to 14 Years | 89 (11.9%) | 27 (3.8%) |
| 15 to 19 Years | 61 (8.2%) | 53 (7.4%) |
| 20 to 24 Years | 120 (16.0%) | 24 (3.4%) |
| 25 to 29 Years | 104 (13.9%) | 34 (4.7%) |
| 30 to 34 Years | 60 (8.0%) | 100 (14.0%) |
| 35 to 39 Years | 11 (1.5%) | 34 (4.7%) |
| 40 to 44 Years | 21 (2.8%) | 51 (7.1%) |
| 45 to 49 Years | 26 (3.5%) | 46 (6.4%) |
| 50 to 54 Years | 70 (9.4%) | 68 (9.5%) |
| 55 to 59 Years | 21 (2.8%) | 9 (1.3%) |
| 60 to 64 Years | 18 (2.4%) | 20 (2.8%) |
| 65 to 69 Years | 16 (2.1%) | 16 (2.2%) |
| 70 to 74 Years | 11 (1.5%) | 8 (1.1%) |
| 75 to 79 Years | 24 (3.2%) | 15 (2.1%) |
| 80 to 84 Years | 21 (2.8%) | 48 (6.7%) |
| 85 Years and over | 11 (1.5%) | 21 (2.9%) |
| Total | 748 (100.0%) | 717 (100.0%) |
Families and Households in Roscoe
Median Family Size in Roscoe
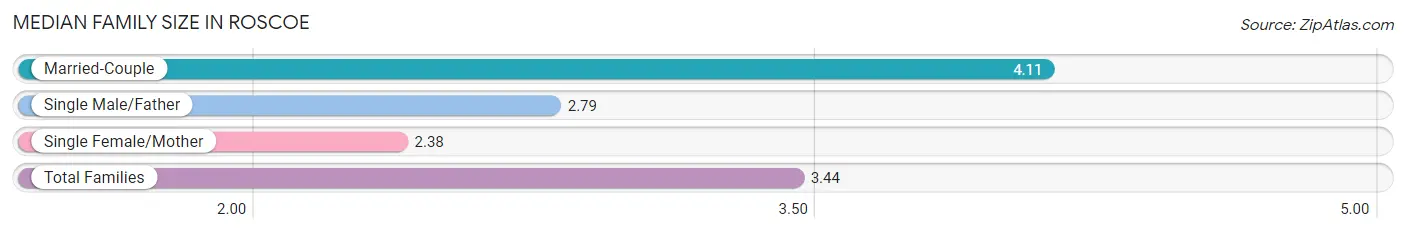
The median family size in Roscoe is 3.44 persons per family, with married-couple families (220 | 58.5%) accounting for the largest median family size of 4.11 persons per family. On the other hand, single female/mother families (113 | 30.0%) represent the smallest median family size with 2.38 persons per family.
| Family Type | # Families | Family Size |
| Married-Couple | 220 (58.5%) | 4.11 |
| Single Male/Father | 43 (11.4%) | 2.79 |
| Single Female/Mother | 113 (30.0%) | 2.38 |
| Total Families | 376 (100.0%) | 3.44 |
Median Household Size in Roscoe
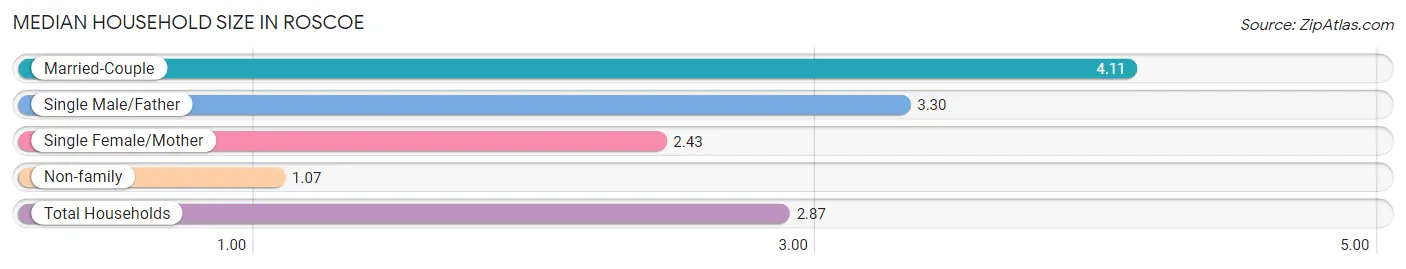
The median household size in Roscoe is 2.87 persons per household, with married-couple households (220 | 43.0%) accounting for the largest median household size of 4.11 persons per household. non-family households (135 | 26.4%) represent the smallest median household size with 1.07 persons per household.
| Household Type | # Households | Household Size |
| Married-Couple | 220 (43.0%) | 4.11 |
| Single Male/Father | 43 (8.4%) | 3.30 |
| Single Female/Mother | 113 (22.1%) | 2.43 |
| Non-family | 135 (26.4%) | 1.07 |
| Total Households | 511 (100.0%) | 2.87 |
Household Size by Marriage Status in Roscoe
Out of a total of 511 households in Roscoe, 376 (73.6%) are family households, while 135 (26.4%) are nonfamily households. The most numerous type of family households are 4-person households, comprising 119, and the most common type of nonfamily households are 1-person households, comprising 126.
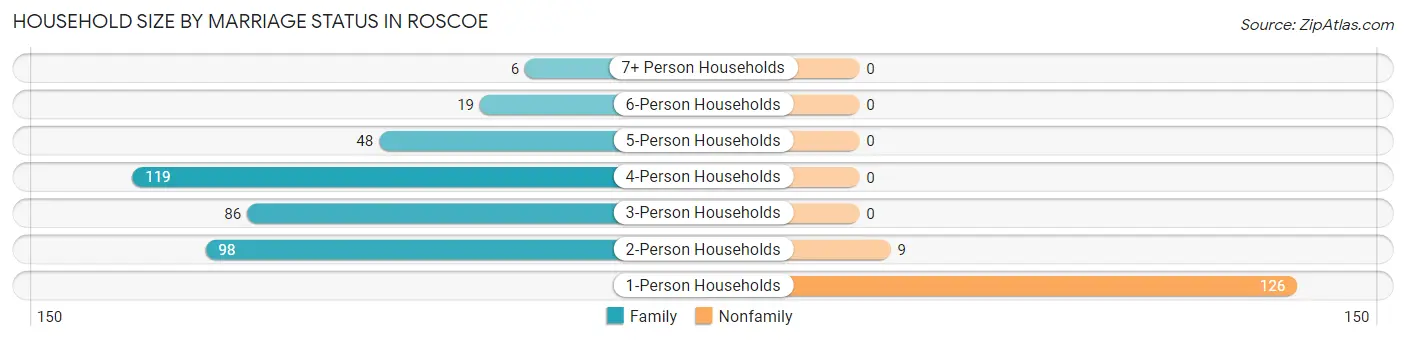
| Household Size | Family Households | Nonfamily Households |
| 1-Person Households | - | 126 (24.7%) |
| 2-Person Households | 98 (19.2%) | 9 (1.8%) |
| 3-Person Households | 86 (16.8%) | 0 (0.0%) |
| 4-Person Households | 119 (23.3%) | 0 (0.0%) |
| 5-Person Households | 48 (9.4%) | 0 (0.0%) |
| 6-Person Households | 19 (3.7%) | 0 (0.0%) |
| 7+ Person Households | 6 (1.2%) | 0 (0.0%) |
| Total | 376 (73.6%) | 135 (26.4%) |
Female Fertility in Roscoe
Fertility by Age in Roscoe
Average fertility rate in Roscoe is 38.0 births per 1,000 women. Women in the age bracket of 15 to 19 years have the highest fertility rate with 189.0 births per 1,000 women. Women in the age bracket of 15 to 19 years acount for 76.9% of all women with births.
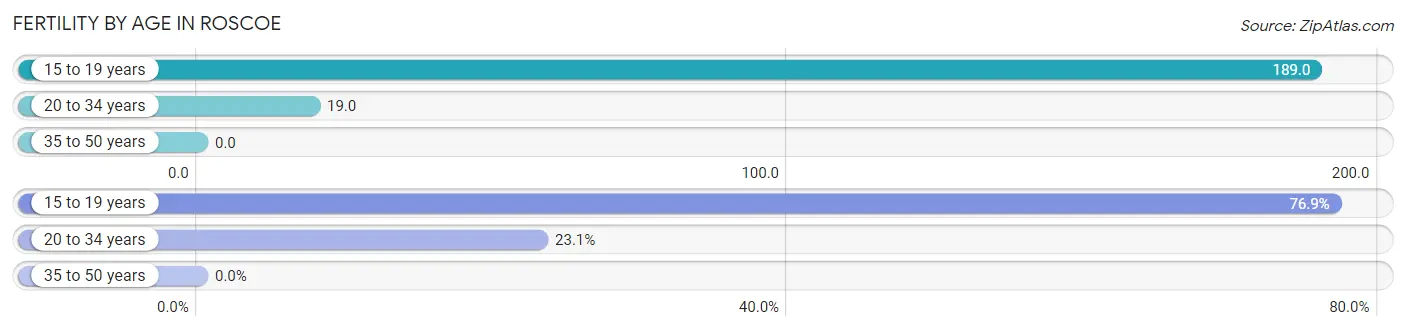
| Age Bracket | Women with Births | Births / 1,000 Women |
| 15 to 19 years | 10 (76.9%) | 189.0 |
| 20 to 34 years | 3 (23.1%) | 19.0 |
| 35 to 50 years | 0 (0.0%) | 0.0 |
| Total | 13 (100.0%) | 38.0 |
Fertility by Age by Marriage Status in Roscoe
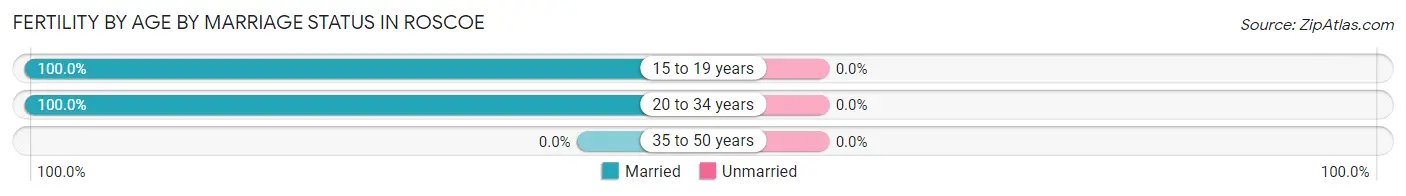
| Age Bracket | Married | Unmarried |
| 15 to 19 years | 10 (100.0%) | 0 (0.0%) |
| 20 to 34 years | 3 (100.0%) | 0 (0.0%) |
| 35 to 50 years | 0 (0.0%) | 0 (0.0%) |
| Total | 13 (100.0%) | 0 (0.0%) |
Fertility by Education in Roscoe
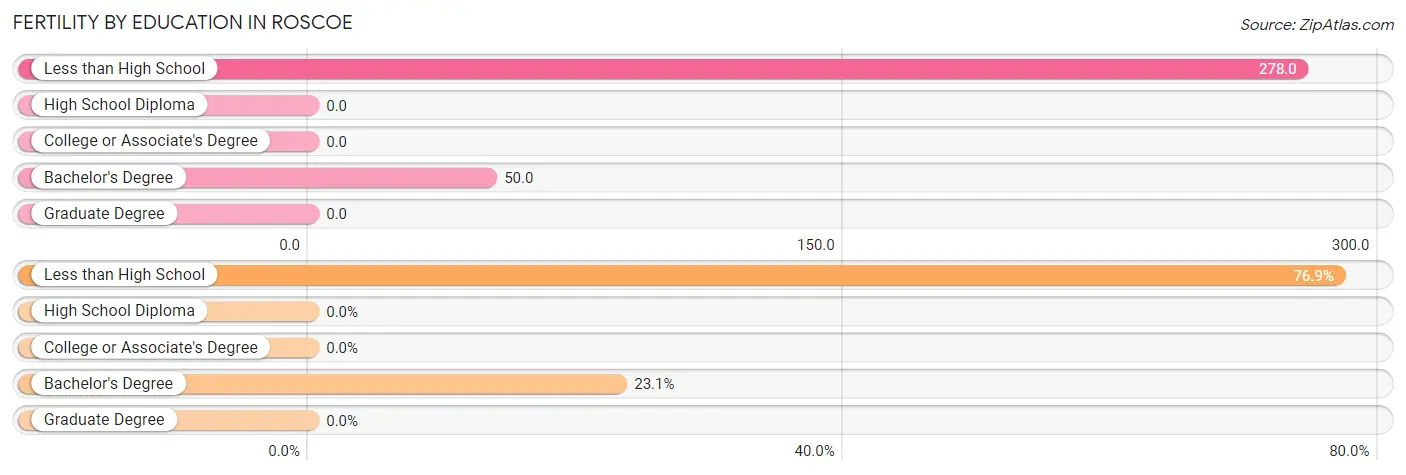
| Educational Attainment | Women with Births | Births / 1,000 Women |
| Less than High School | 10 (76.9%) | 278.0 |
| High School Diploma | 0 (0.0%) | 0.0 |
| College or Associate's Degree | 0 (0.0%) | 0.0 |
| Bachelor's Degree | 3 (23.1%) | 50.0 |
| Graduate Degree | 0 (0.0%) | 0.0 |
| Total | 13 (100.0%) | 38.0 |
Fertility by Education by Marriage Status in Roscoe
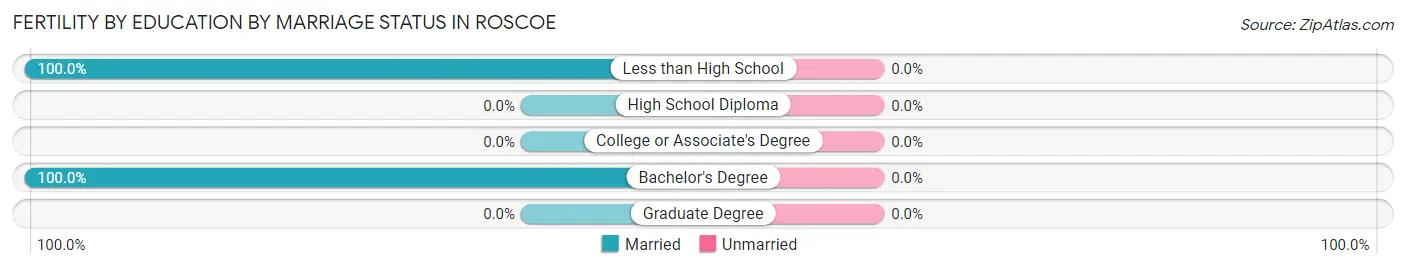
| Educational Attainment | Married | Unmarried |
| Less than High School | 10 (100.0%) | 0 (0.0%) |
| High School Diploma | 0 (0.0%) | 0 (0.0%) |
| College or Associate's Degree | 0 (0.0%) | 0 (0.0%) |
| Bachelor's Degree | 3 (100.0%) | 0 (0.0%) |
| Graduate Degree | 0 (0.0%) | 0 (0.0%) |
| Total | 13 (100.0%) | 0 (0.0%) |
Employment Characteristics in Roscoe
Employment by Class of Employer in Roscoe
Among the 645 employed individuals in Roscoe, private company employees (495 | 76.7%), local government employees (58 | 9.0%), and self-employed (not incorporated) (50 | 7.7%) make up the most common classes of employment.
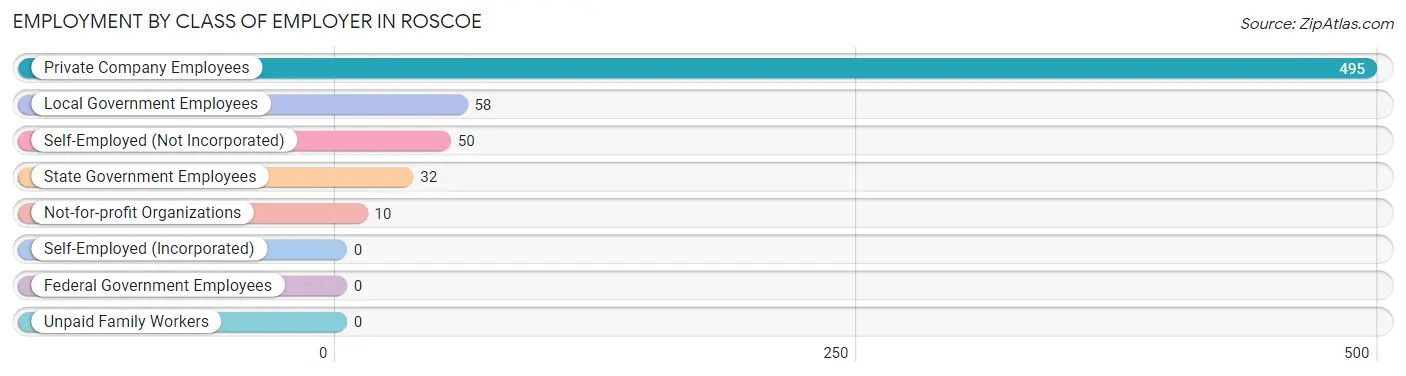
| Employer Class | # Employees | % Employees |
| Private Company Employees | 495 | 76.7% |
| Self-Employed (Incorporated) | 0 | 0.0% |
| Self-Employed (Not Incorporated) | 50 | 7.7% |
| Not-for-profit Organizations | 10 | 1.5% |
| Local Government Employees | 58 | 9.0% |
| State Government Employees | 32 | 5.0% |
| Federal Government Employees | 0 | 0.0% |
| Unpaid Family Workers | 0 | 0.0% |
| Total | 645 | 100.0% |
Employment Status by Age in Roscoe
According to the labor force statistics for Roscoe, out of the total population over 16 years of age (1,128), 61.6% or 695 individuals are in the labor force, with 7.2% or 50 of them unemployed. The age group with the highest labor force participation rate is 55 to 59 years, with 100.0% or 30 individuals in the labor force. Within the labor force, the 16 to 19 years age range has the highest percentage of unemployed individuals, with 37.9% or 22 of them being unemployed.
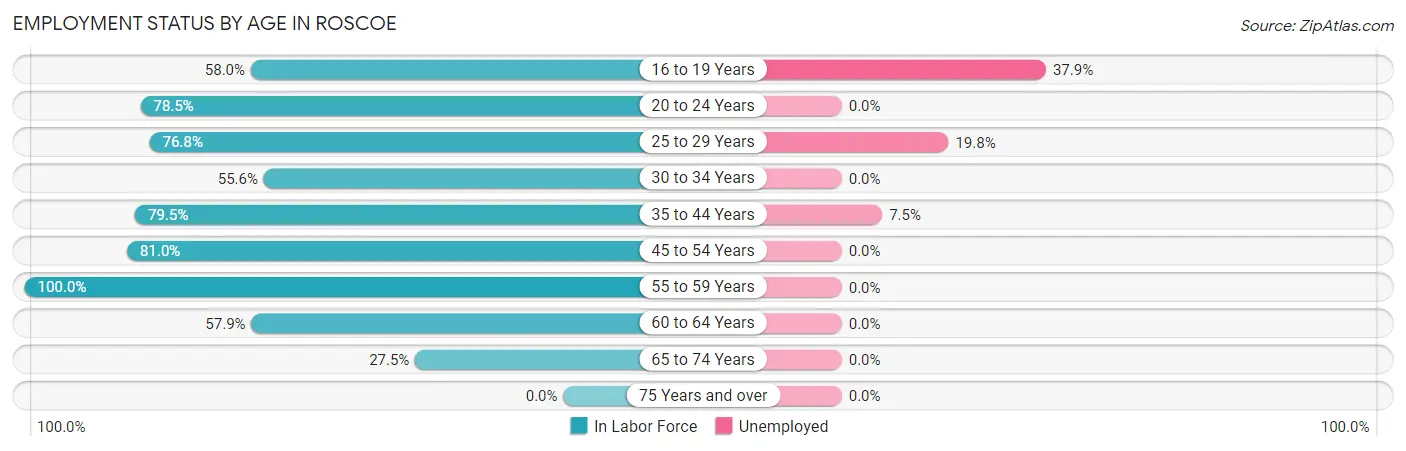
| Age Bracket | In Labor Force | Unemployed |
| 16 to 19 Years | 58 (58.0%) | 22 (37.9%) |
| 20 to 24 Years | 113 (78.5%) | 0 (0.0%) |
| 25 to 29 Years | 106 (76.8%) | 21 (19.8%) |
| 30 to 34 Years | 89 (55.6%) | 0 (0.0%) |
| 35 to 44 Years | 93 (79.5%) | 7 (7.5%) |
| 45 to 54 Years | 170 (81.0%) | 0 (0.0%) |
| 55 to 59 Years | 30 (100.0%) | 0 (0.0%) |
| 60 to 64 Years | 22 (57.9%) | 0 (0.0%) |
| 65 to 74 Years | 14 (27.5%) | 0 (0.0%) |
| 75 Years and over | 0 (0.0%) | 0 (0.0%) |
| Total | 695 (61.6%) | 50 (7.2%) |
Employment Status by Educational Attainment in Roscoe
According to labor force statistics for Roscoe, 73.6% of individuals (510) out of the total population between 25 and 64 years of age (693) are in the labor force, with 5.5% or 28 of them being unemployed. The group with the highest labor force participation rate are those with the educational attainment of high school diploma, with 81.2% or 238 individuals in the labor force. Within the labor force, individuals with less than high school education have the highest percentage of unemployment, with 46.7% or 7 of them being unemployed.
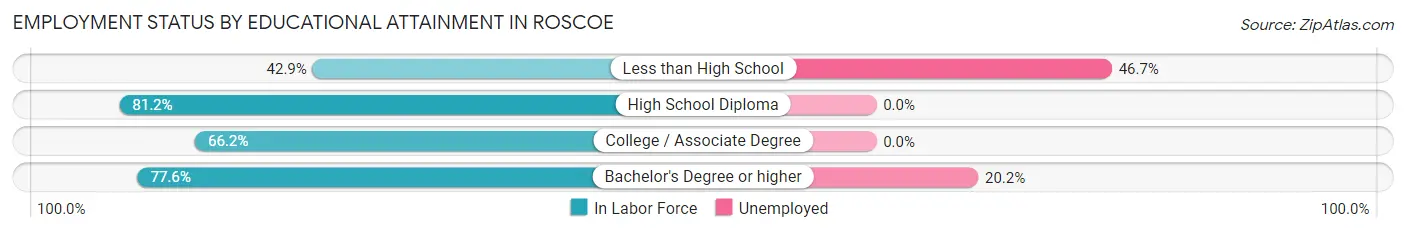
| Educational Attainment | In Labor Force | Unemployed |
| Less than High School | 15 (42.9%) | 16 (46.7%) |
| High School Diploma | 238 (81.2%) | 0 (0.0%) |
| College / Associate Degree | 153 (66.2%) | 0 (0.0%) |
| Bachelor's Degree or higher | 104 (77.6%) | 27 (20.2%) |
| Total | 510 (73.6%) | 38 (5.5%) |
Employment Occupations by Sex in Roscoe
Management, Business, Science and Arts Occupations
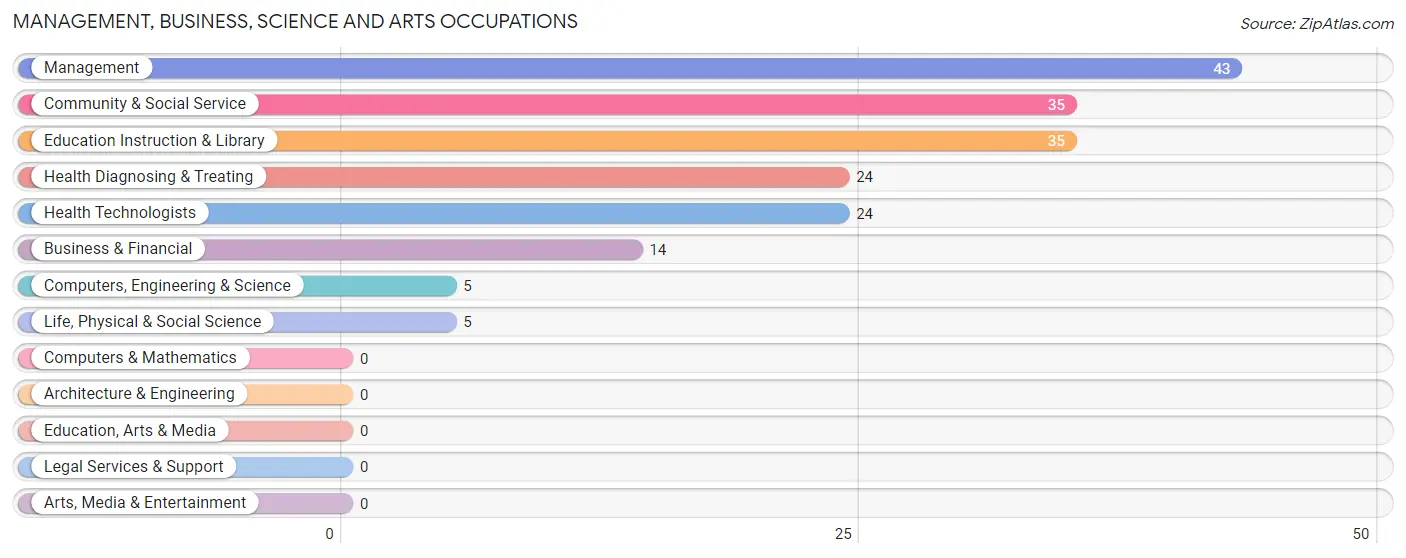
The most common Management, Business, Science and Arts occupations in Roscoe are Management (43 | 6.7%), Community & Social Service (35 | 5.4%), Education Instruction & Library (35 | 5.4%), Health Diagnosing & Treating (24 | 3.7%), and Health Technologists (24 | 3.7%).
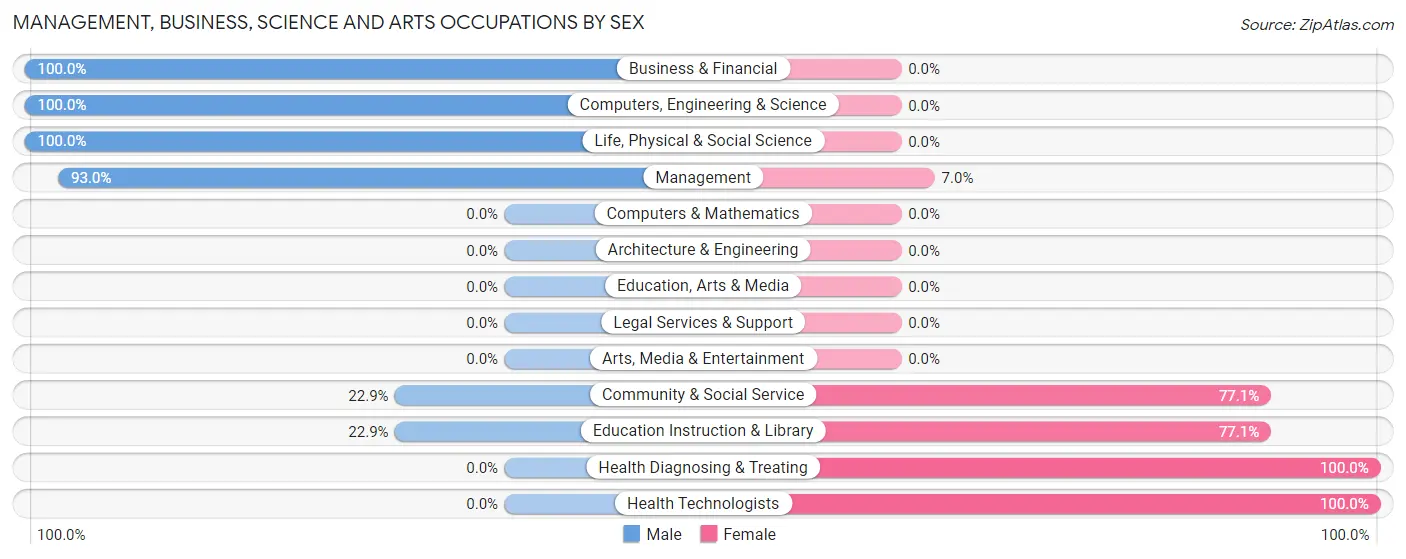
Management, Business, Science and Arts Occupations by Sex
Within the Management, Business, Science and Arts occupations in Roscoe, the most male-oriented occupations are Business & Financial (100.0%), Computers, Engineering & Science (100.0%), and Life, Physical & Social Science (100.0%), while the most female-oriented occupations are Health Diagnosing & Treating (100.0%), Health Technologists (100.0%), and Community & Social Service (77.1%).
| Occupation | Male | Female |
| Management | 40 (93.0%) | 3 (7.0%) |
| Business & Financial | 14 (100.0%) | 0 (0.0%) |
| Computers, Engineering & Science | 5 (100.0%) | 0 (0.0%) |
| Computers & Mathematics | 0 (0.0%) | 0 (0.0%) |
| Architecture & Engineering | 0 (0.0%) | 0 (0.0%) |
| Life, Physical & Social Science | 5 (100.0%) | 0 (0.0%) |
| Community & Social Service | 8 (22.9%) | 27 (77.1%) |
| Education, Arts & Media | 0 (0.0%) | 0 (0.0%) |
| Legal Services & Support | 0 (0.0%) | 0 (0.0%) |
| Education Instruction & Library | 8 (22.9%) | 27 (77.1%) |
| Arts, Media & Entertainment | 0 (0.0%) | 0 (0.0%) |
| Health Diagnosing & Treating | 0 (0.0%) | 24 (100.0%) |
| Health Technologists | 0 (0.0%) | 24 (100.0%) |
| Total (Category) | 67 (55.4%) | 54 (44.6%) |
| Total (Overall) | 421 (65.3%) | 224 (34.7%) |
Services Occupations
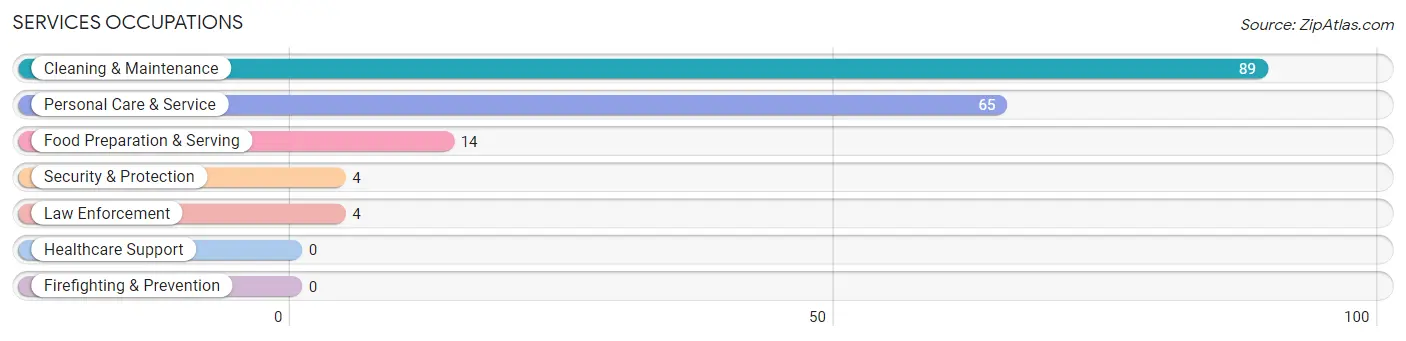
The most common Services occupations in Roscoe are Cleaning & Maintenance (89 | 13.8%), Personal Care & Service (65 | 10.1%), Food Preparation & Serving (14 | 2.2%), Security & Protection (4 | 0.6%), and Law Enforcement (4 | 0.6%).
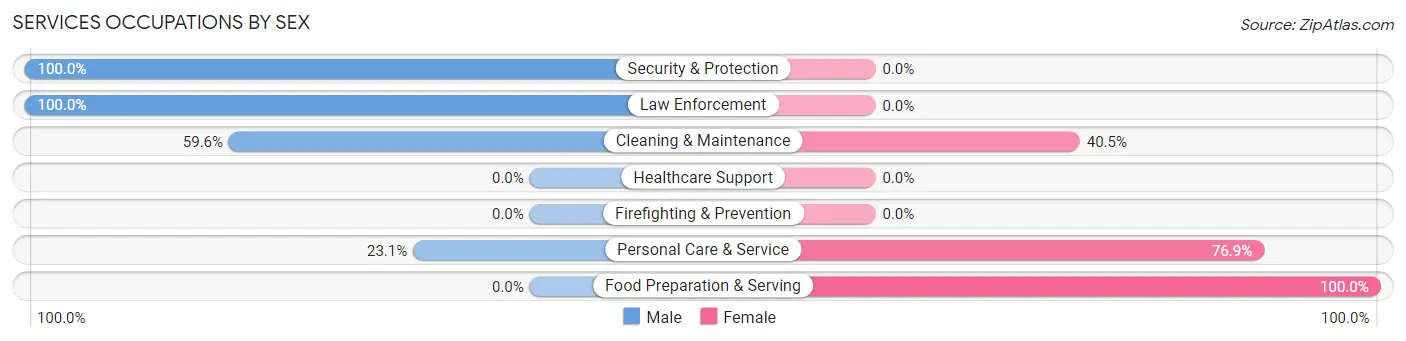
Services Occupations by Sex
Within the Services occupations in Roscoe, the most male-oriented occupations are Security & Protection (100.0%), Law Enforcement (100.0%), and Cleaning & Maintenance (59.6%), while the most female-oriented occupations are Food Preparation & Serving (100.0%), Personal Care & Service (76.9%), and Cleaning & Maintenance (40.5%).
| Occupation | Male | Female |
| Healthcare Support | 0 (0.0%) | 0 (0.0%) |
| Security & Protection | 4 (100.0%) | 0 (0.0%) |
| Firefighting & Prevention | 0 (0.0%) | 0 (0.0%) |
| Law Enforcement | 4 (100.0%) | 0 (0.0%) |
| Food Preparation & Serving | 0 (0.0%) | 14 (100.0%) |
| Cleaning & Maintenance | 53 (59.6%) | 36 (40.5%) |
| Personal Care & Service | 15 (23.1%) | 50 (76.9%) |
| Total (Category) | 72 (41.9%) | 100 (58.1%) |
| Total (Overall) | 421 (65.3%) | 224 (34.7%) |
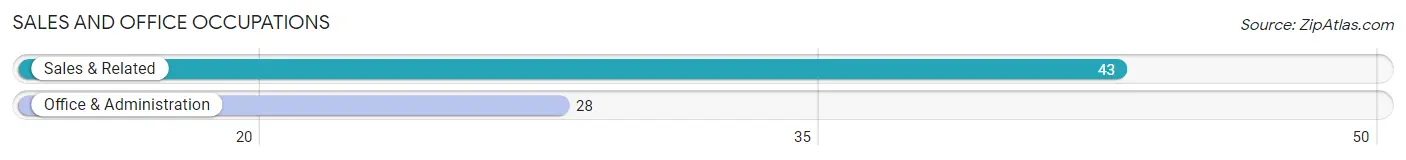
Sales and Office Occupations
The most common Sales and Office occupations in Roscoe are Sales & Related (43 | 6.7%), and Office & Administration (28 | 4.3%).
Sales and Office Occupations by Sex
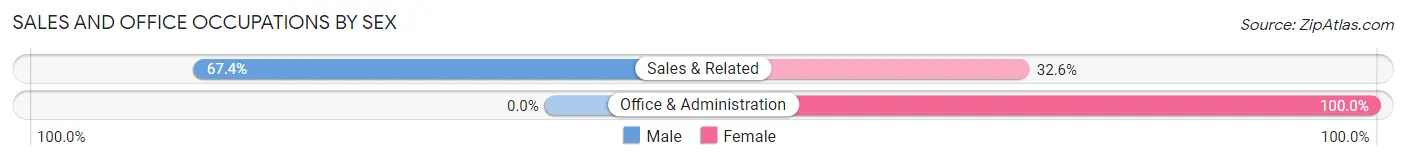
| Occupation | Male | Female |
| Sales & Related | 29 (67.4%) | 14 (32.6%) |
| Office & Administration | 0 (0.0%) | 28 (100.0%) |
| Total (Category) | 29 (40.8%) | 42 (59.2%) |
| Total (Overall) | 421 (65.3%) | 224 (34.7%) |
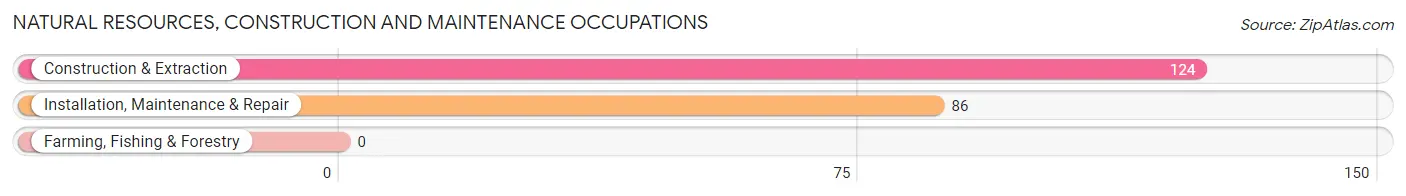
Natural Resources, Construction and Maintenance Occupations
The most common Natural Resources, Construction and Maintenance occupations in Roscoe are Construction & Extraction (124 | 19.2%), and Installation, Maintenance & Repair (86 | 13.3%).
Natural Resources, Construction and Maintenance Occupations by Sex
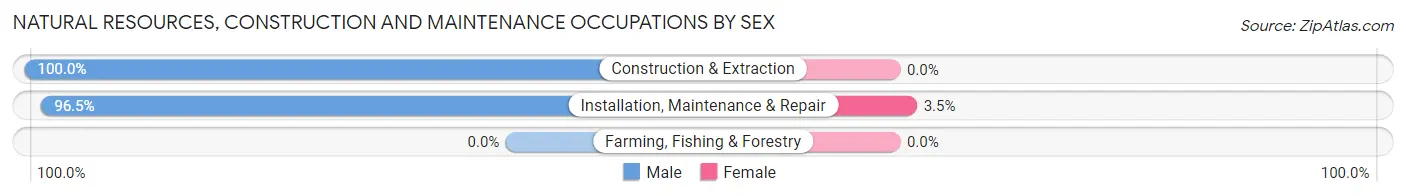
| Occupation | Male | Female |
| Farming, Fishing & Forestry | 0 (0.0%) | 0 (0.0%) |
| Construction & Extraction | 124 (100.0%) | 0 (0.0%) |
| Installation, Maintenance & Repair | 83 (96.5%) | 3 (3.5%) |
| Total (Category) | 207 (98.6%) | 3 (1.4%) |
| Total (Overall) | 421 (65.3%) | 224 (34.7%) |
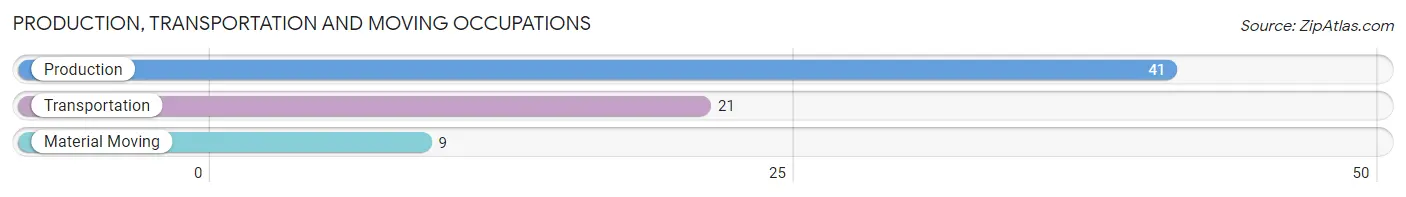
Production, Transportation and Moving Occupations
The most common Production, Transportation and Moving occupations in Roscoe are Production (41 | 6.4%), Transportation (21 | 3.3%), and Material Moving (9 | 1.4%).
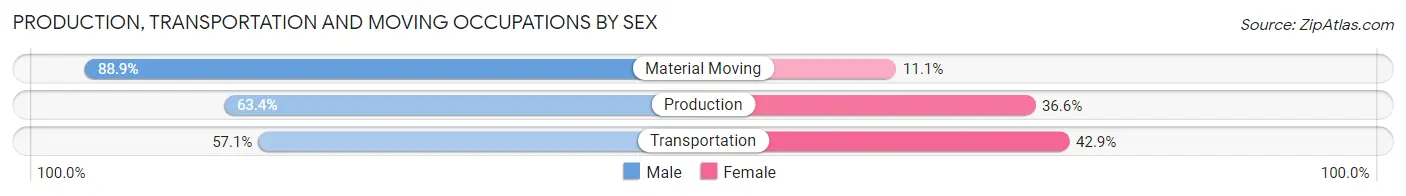
Production, Transportation and Moving Occupations by Sex
| Occupation | Male | Female |
| Production | 26 (63.4%) | 15 (36.6%) |
| Transportation | 12 (57.1%) | 9 (42.9%) |
| Material Moving | 8 (88.9%) | 1 (11.1%) |
| Total (Category) | 46 (64.8%) | 25 (35.2%) |
| Total (Overall) | 421 (65.3%) | 224 (34.7%) |
Employment Industries by Sex in Roscoe
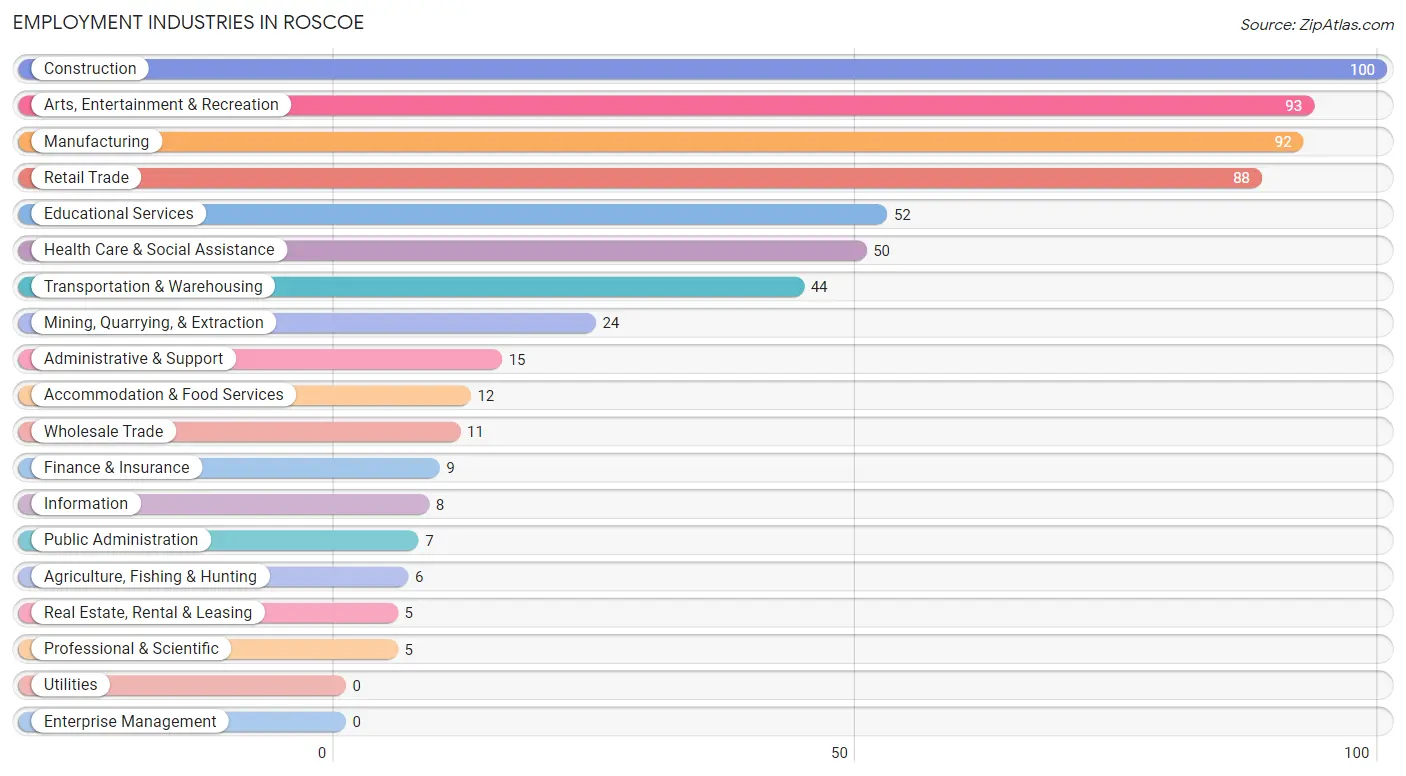
Employment Industries in Roscoe
The major employment industries in Roscoe include Construction (100 | 15.5%), Arts, Entertainment & Recreation (93 | 14.4%), Manufacturing (92 | 14.3%), Retail Trade (88 | 13.6%), and Educational Services (52 | 8.1%).
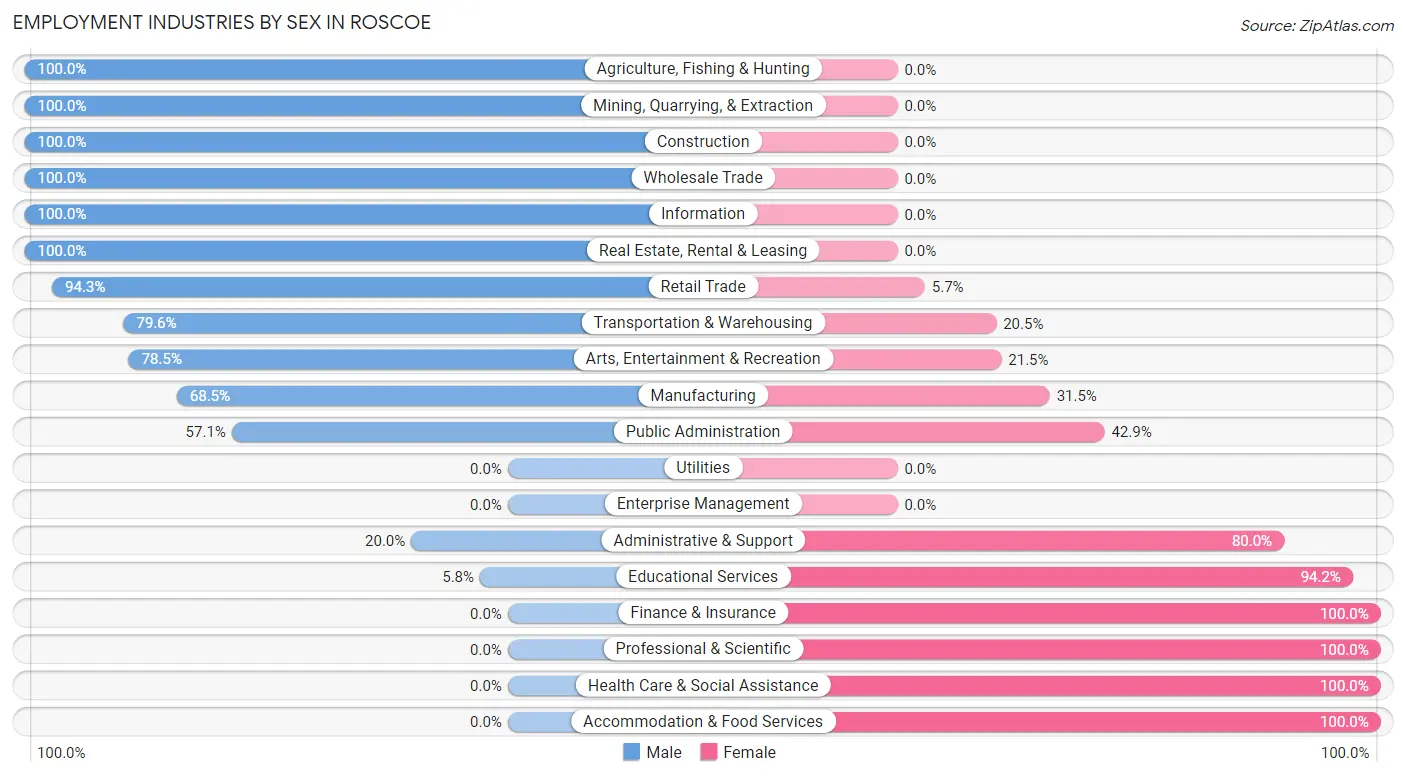
Employment Industries by Sex in Roscoe
The Roscoe industries that see more men than women are Agriculture, Fishing & Hunting (100.0%), Mining, Quarrying, & Extraction (100.0%), and Construction (100.0%), whereas the industries that tend to have a higher number of women are Finance & Insurance (100.0%), Professional & Scientific (100.0%), and Health Care & Social Assistance (100.0%).
| Industry | Male | Female |
| Agriculture, Fishing & Hunting | 6 (100.0%) | 0 (0.0%) |
| Mining, Quarrying, & Extraction | 24 (100.0%) | 0 (0.0%) |
| Construction | 100 (100.0%) | 0 (0.0%) |
| Manufacturing | 63 (68.5%) | 29 (31.5%) |
| Wholesale Trade | 11 (100.0%) | 0 (0.0%) |
| Retail Trade | 83 (94.3%) | 5 (5.7%) |
| Transportation & Warehousing | 35 (79.5%) | 9 (20.4%) |
| Utilities | 0 (0.0%) | 0 (0.0%) |
| Information | 8 (100.0%) | 0 (0.0%) |
| Finance & Insurance | 0 (0.0%) | 9 (100.0%) |
| Real Estate, Rental & Leasing | 5 (100.0%) | 0 (0.0%) |
| Professional & Scientific | 0 (0.0%) | 5 (100.0%) |
| Enterprise Management | 0 (0.0%) | 0 (0.0%) |
| Administrative & Support | 3 (20.0%) | 12 (80.0%) |
| Educational Services | 3 (5.8%) | 49 (94.2%) |
| Health Care & Social Assistance | 0 (0.0%) | 50 (100.0%) |
| Arts, Entertainment & Recreation | 73 (78.5%) | 20 (21.5%) |
| Accommodation & Food Services | 0 (0.0%) | 12 (100.0%) |
| Public Administration | 4 (57.1%) | 3 (42.9%) |
| Total | 421 (65.3%) | 224 (34.7%) |
Education in Roscoe
School Enrollment in Roscoe
The most common levels of schooling among the 410 students in Roscoe are elementary school (101 | 24.6%), middle school (84 | 20.5%), and high school (65 | 15.9%).
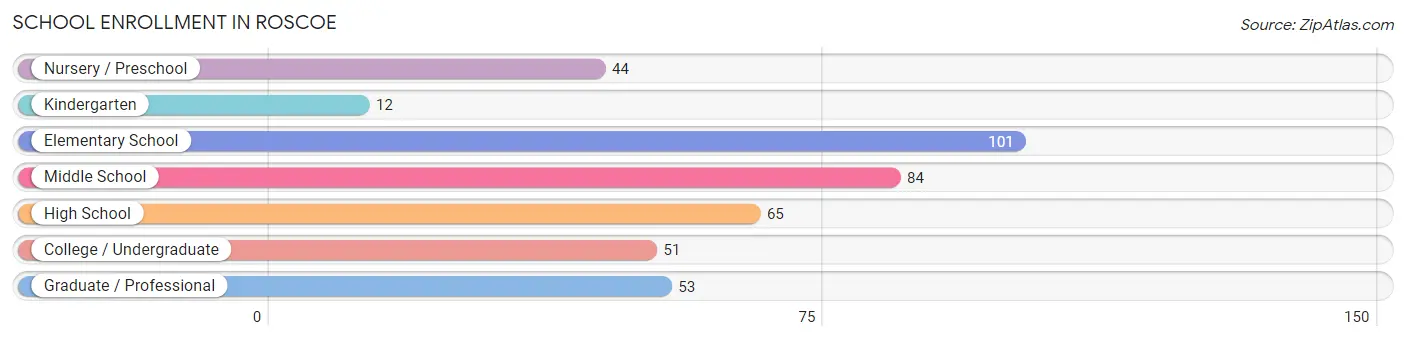
| School Level | # Students | % Students |
| Nursery / Preschool | 44 | 10.7% |
| Kindergarten | 12 | 2.9% |
| Elementary School | 101 | 24.6% |
| Middle School | 84 | 20.5% |
| High School | 65 | 15.9% |
| College / Undergraduate | 51 | 12.4% |
| Graduate / Professional | 53 | 12.9% |
| Total | 410 | 100.0% |
School Enrollment by Age by Funding Source in Roscoe
Out of a total of 410 students who are enrolled in schools in Roscoe, 14 (3.4%) attend a private institution, while the remaining 396 (96.6%) are enrolled in public schools. The age group of 5 to 9 year old has the highest likelihood of being enrolled in private schools, with 12 (9.5% in the age bracket) enrolled. Conversely, the age group of 3 to 4 year olds has the lowest likelihood of being enrolled in a private school, with 4 (100.0% in the age bracket) attending a public institution.
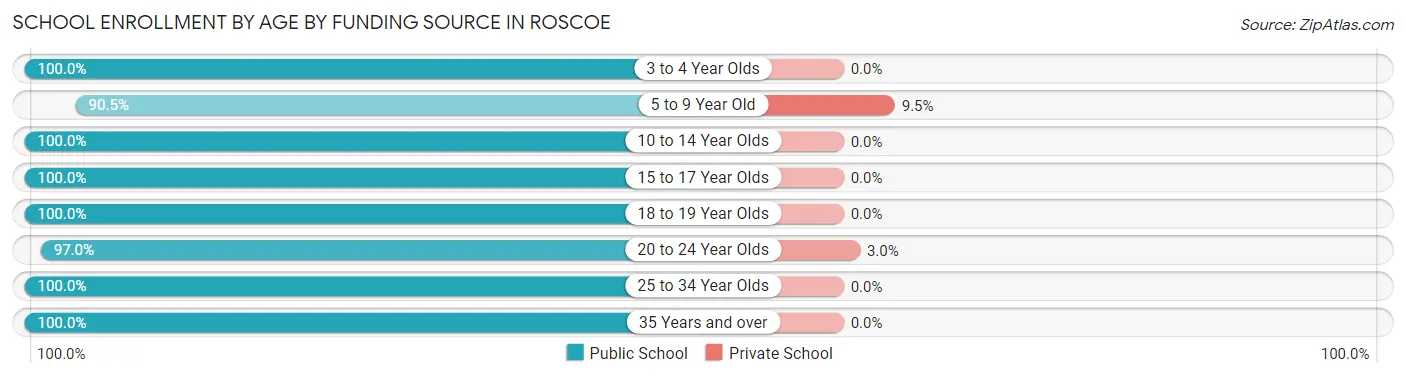
| Age Bracket | Public School | Private School |
| 3 to 4 Year Olds | 4 (100.0%) | 0 (0.0%) |
| 5 to 9 Year Old | 114 (90.5%) | 12 (9.5%) |
| 10 to 14 Year Olds | 116 (100.0%) | 0 (0.0%) |
| 15 to 17 Year Olds | 53 (100.0%) | 0 (0.0%) |
| 18 to 19 Year Olds | 27 (100.0%) | 0 (0.0%) |
| 20 to 24 Year Olds | 64 (97.0%) | 2 (3.0%) |
| 25 to 34 Year Olds | 15 (100.0%) | 0 (0.0%) |
| 35 Years and over | 3 (100.0%) | 0 (0.0%) |
| Total | 396 (96.6%) | 14 (3.4%) |
Educational Attainment by Field of Study in Roscoe
Science & technology (45 | 28.5%), business (33 | 20.9%), education (30 | 19.0%), engineering (24 | 15.2%), and liberal arts & history (11 | 7.0%) are the most common fields of study among 158 individuals in Roscoe who have obtained a bachelor's degree or higher.
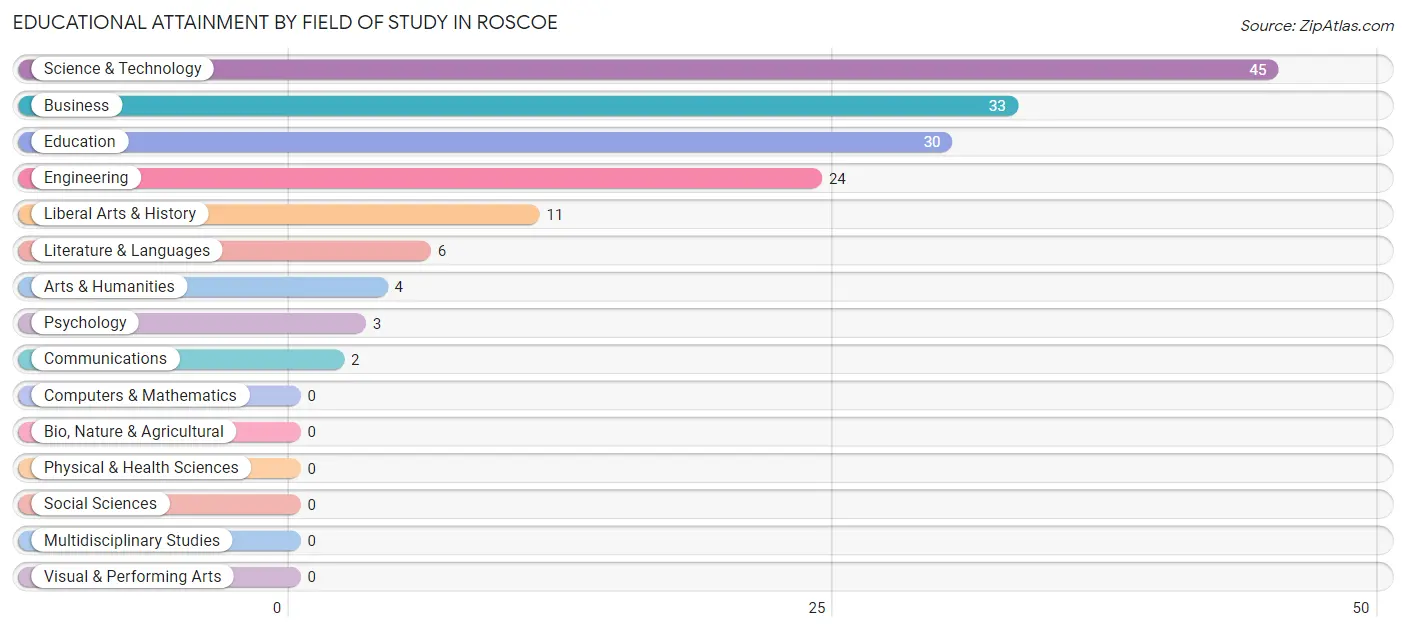
| Field of Study | # Graduates | % Graduates |
| Computers & Mathematics | 0 | 0.0% |
| Bio, Nature & Agricultural | 0 | 0.0% |
| Physical & Health Sciences | 0 | 0.0% |
| Psychology | 3 | 1.9% |
| Social Sciences | 0 | 0.0% |
| Engineering | 24 | 15.2% |
| Multidisciplinary Studies | 0 | 0.0% |
| Science & Technology | 45 | 28.5% |
| Business | 33 | 20.9% |
| Education | 30 | 19.0% |
| Literature & Languages | 6 | 3.8% |
| Liberal Arts & History | 11 | 7.0% |
| Visual & Performing Arts | 0 | 0.0% |
| Communications | 2 | 1.3% |
| Arts & Humanities | 4 | 2.5% |
| Total | 158 | 100.0% |
Transportation & Commute in Roscoe
Vehicle Availability by Sex in Roscoe
The most prevalent vehicle ownership categories in Roscoe are males with 3 vehicles (179, accounting for 42.5%) and females with 3 vehicles (35, making up 79.9%).
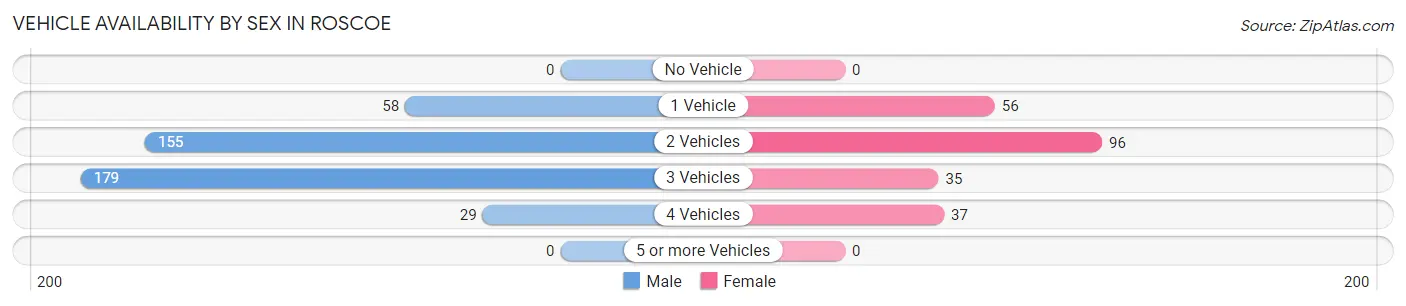
| Vehicles Available | Male | Female |
| No Vehicle | 0 (0.0%) | 0 (0.0%) |
| 1 Vehicle | 58 (13.8%) | 56 (25.0%) |
| 2 Vehicles | 155 (36.8%) | 96 (42.9%) |
| 3 Vehicles | 179 (42.5%) | 35 (15.6%) |
| 4 Vehicles | 29 (6.9%) | 37 (16.5%) |
| 5 or more Vehicles | 0 (0.0%) | 0 (0.0%) |
| Total | 421 (100.0%) | 224 (100.0%) |
Commute Time in Roscoe
The most frequently occuring commute durations in Roscoe are 10 to 14 minutes (215 commuters, 33.5%), 15 to 19 minutes (113 commuters, 17.6%), and less than 5 minutes (74 commuters, 11.5%).
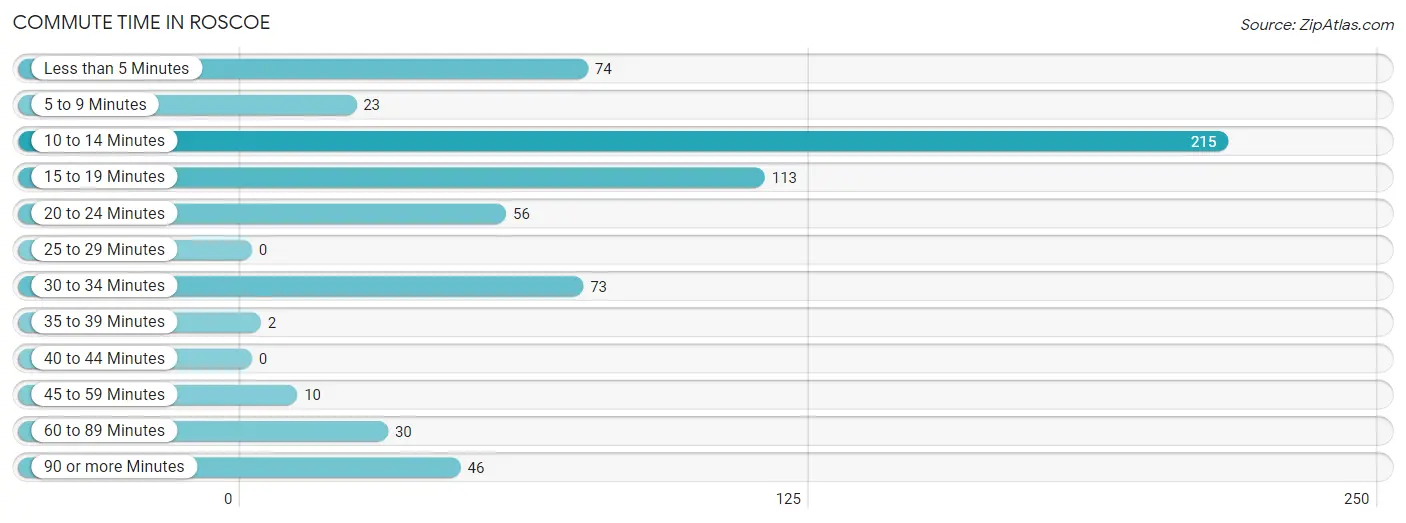
| Commute Time | # Commuters | % Commuters |
| Less than 5 Minutes | 74 | 11.5% |
| 5 to 9 Minutes | 23 | 3.6% |
| 10 to 14 Minutes | 215 | 33.5% |
| 15 to 19 Minutes | 113 | 17.6% |
| 20 to 24 Minutes | 56 | 8.7% |
| 25 to 29 Minutes | 0 | 0.0% |
| 30 to 34 Minutes | 73 | 11.4% |
| 35 to 39 Minutes | 2 | 0.3% |
| 40 to 44 Minutes | 0 | 0.0% |
| 45 to 59 Minutes | 10 | 1.6% |
| 60 to 89 Minutes | 30 | 4.7% |
| 90 or more Minutes | 46 | 7.2% |
Commute Time by Sex in Roscoe
The most common commute times in Roscoe are 10 to 14 minutes (181 commuters, 43.0%) for males and 15 to 19 minutes (60 commuters, 27.2%) for females.
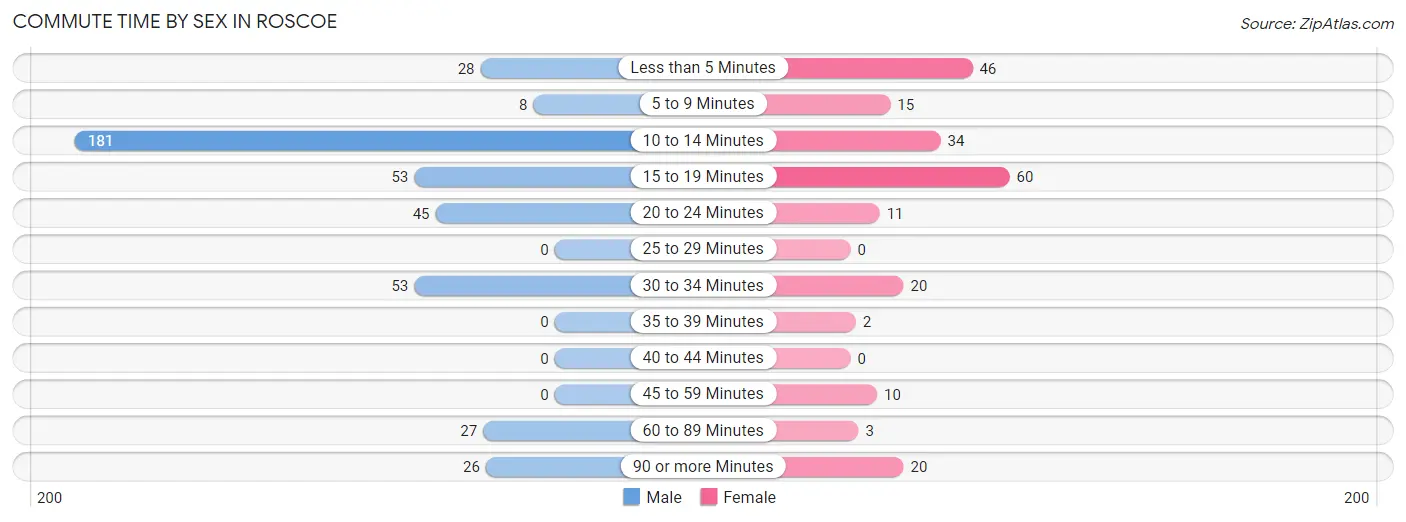
| Commute Time | Male | Female |
| Less than 5 Minutes | 28 (6.7%) | 46 (20.8%) |
| 5 to 9 Minutes | 8 (1.9%) | 15 (6.8%) |
| 10 to 14 Minutes | 181 (43.0%) | 34 (15.4%) |
| 15 to 19 Minutes | 53 (12.6%) | 60 (27.2%) |
| 20 to 24 Minutes | 45 (10.7%) | 11 (5.0%) |
| 25 to 29 Minutes | 0 (0.0%) | 0 (0.0%) |
| 30 to 34 Minutes | 53 (12.6%) | 20 (9.0%) |
| 35 to 39 Minutes | 0 (0.0%) | 2 (0.9%) |
| 40 to 44 Minutes | 0 (0.0%) | 0 (0.0%) |
| 45 to 59 Minutes | 0 (0.0%) | 10 (4.5%) |
| 60 to 89 Minutes | 27 (6.4%) | 3 (1.4%) |
| 90 or more Minutes | 26 (6.2%) | 20 (9.0%) |
Time of Departure to Work by Sex in Roscoe
The most frequent times of departure to work in Roscoe are 7:00 AM to 7:29 AM (130, 30.9%) for males and 7:00 AM to 7:29 AM (63, 28.5%) for females.
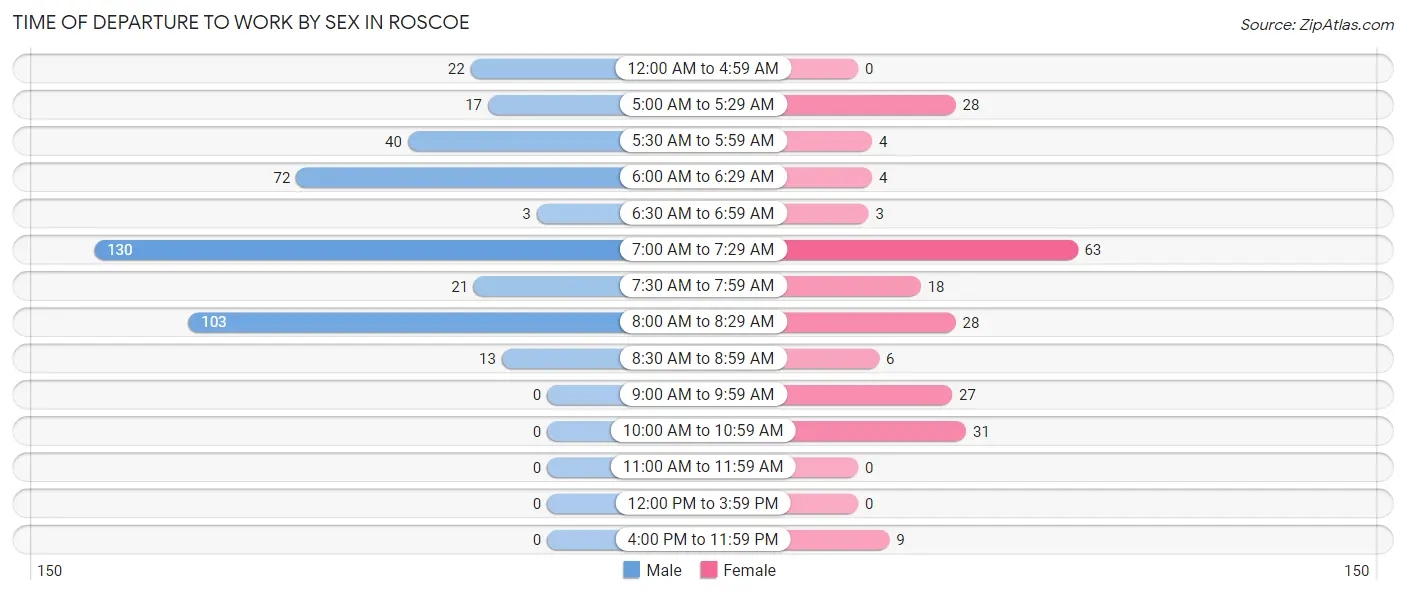
| Time of Departure | Male | Female |
| 12:00 AM to 4:59 AM | 22 (5.2%) | 0 (0.0%) |
| 5:00 AM to 5:29 AM | 17 (4.0%) | 28 (12.7%) |
| 5:30 AM to 5:59 AM | 40 (9.5%) | 4 (1.8%) |
| 6:00 AM to 6:29 AM | 72 (17.1%) | 4 (1.8%) |
| 6:30 AM to 6:59 AM | 3 (0.7%) | 3 (1.4%) |
| 7:00 AM to 7:29 AM | 130 (30.9%) | 63 (28.5%) |
| 7:30 AM to 7:59 AM | 21 (5.0%) | 18 (8.1%) |
| 8:00 AM to 8:29 AM | 103 (24.5%) | 28 (12.7%) |
| 8:30 AM to 8:59 AM | 13 (3.1%) | 6 (2.7%) |
| 9:00 AM to 9:59 AM | 0 (0.0%) | 27 (12.2%) |
| 10:00 AM to 10:59 AM | 0 (0.0%) | 31 (14.0%) |
| 11:00 AM to 11:59 AM | 0 (0.0%) | 0 (0.0%) |
| 12:00 PM to 3:59 PM | 0 (0.0%) | 0 (0.0%) |
| 4:00 PM to 11:59 PM | 0 (0.0%) | 9 (4.1%) |
| Total | 421 (100.0%) | 221 (100.0%) |
Housing Occupancy in Roscoe
Occupancy by Ownership in Roscoe
Of the total 511 dwellings in Roscoe, owner-occupied units account for 430 (84.2%), while renter-occupied units make up 81 (15.9%).
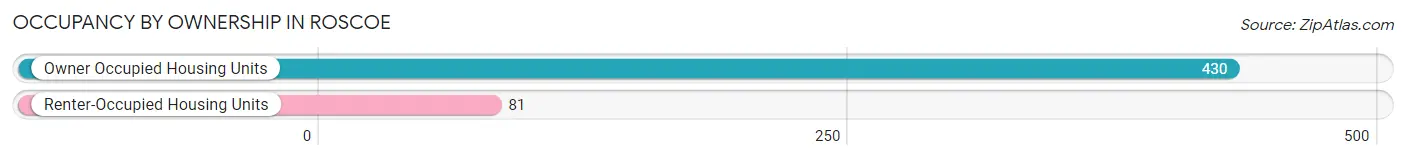
| Occupancy | # Housing Units | % Housing Units |
| Owner Occupied Housing Units | 430 | 84.2% |
| Renter-Occupied Housing Units | 81 | 15.9% |
| Total Occupied Housing Units | 511 | 100.0% |
Occupancy by Household Size in Roscoe
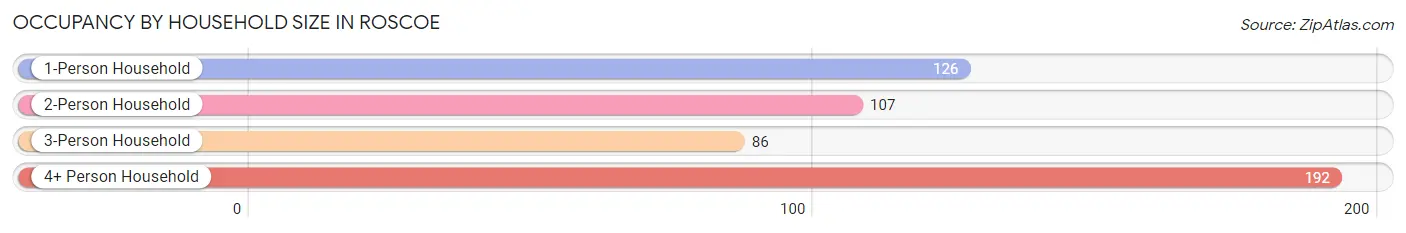
| Household Size | # Housing Units | % Housing Units |
| 1-Person Household | 126 | 24.7% |
| 2-Person Household | 107 | 20.9% |
| 3-Person Household | 86 | 16.8% |
| 4+ Person Household | 192 | 37.6% |
| Total Housing Units | 511 | 100.0% |
Occupancy by Ownership by Household Size in Roscoe
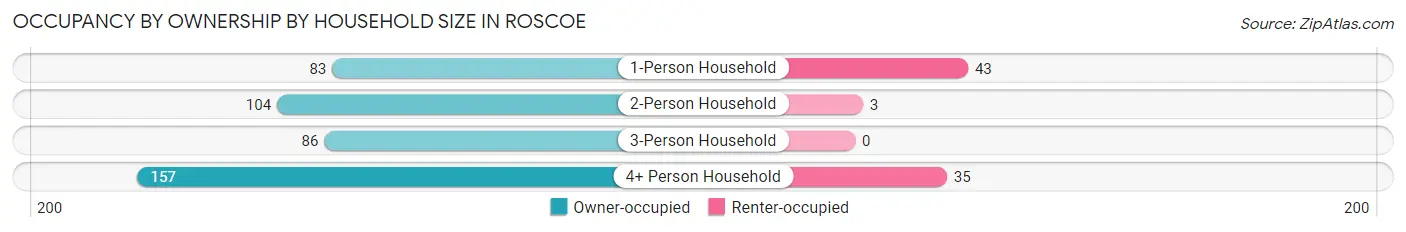
| Household Size | Owner-occupied | Renter-occupied |
| 1-Person Household | 83 (65.9%) | 43 (34.1%) |
| 2-Person Household | 104 (97.2%) | 3 (2.8%) |
| 3-Person Household | 86 (100.0%) | 0 (0.0%) |
| 4+ Person Household | 157 (81.8%) | 35 (18.2%) |
| Total Housing Units | 430 (84.2%) | 81 (15.9%) |
Occupancy by Educational Attainment in Roscoe
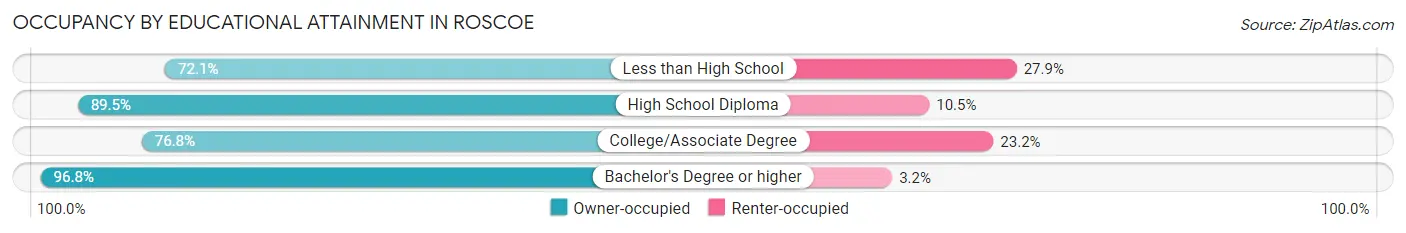
| Household Size | Owner-occupied | Renter-occupied |
| Less than High School | 44 (72.1%) | 17 (27.9%) |
| High School Diploma | 153 (89.5%) | 18 (10.5%) |
| College/Associate Degree | 142 (76.8%) | 43 (23.2%) |
| Bachelor's Degree or higher | 91 (96.8%) | 3 (3.2%) |
Occupancy by Age of Householder in Roscoe
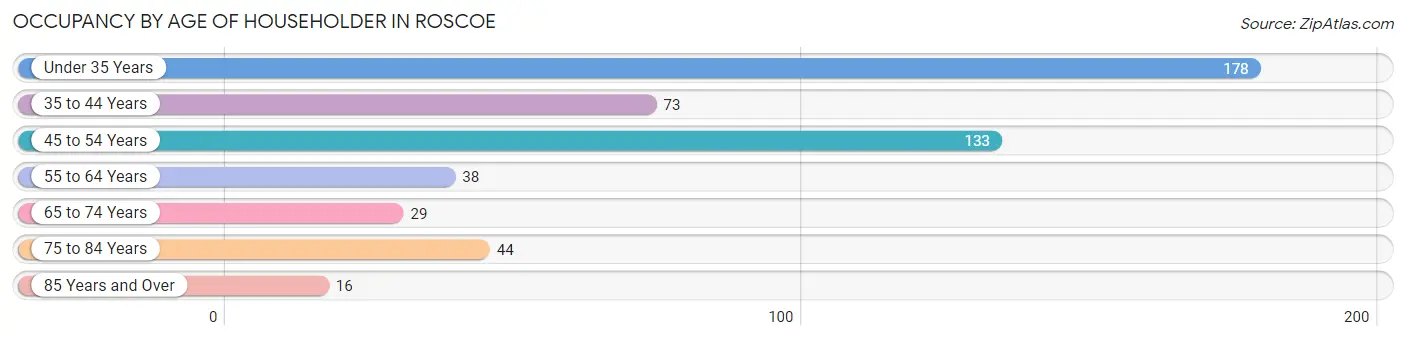
| Age Bracket | # Households | % Households |
| Under 35 Years | 178 | 34.8% |
| 35 to 44 Years | 73 | 14.3% |
| 45 to 54 Years | 133 | 26.0% |
| 55 to 64 Years | 38 | 7.4% |
| 65 to 74 Years | 29 | 5.7% |
| 75 to 84 Years | 44 | 8.6% |
| 85 Years and Over | 16 | 3.1% |
| Total | 511 | 100.0% |
Housing Finances in Roscoe
Median Income by Occupancy in Roscoe
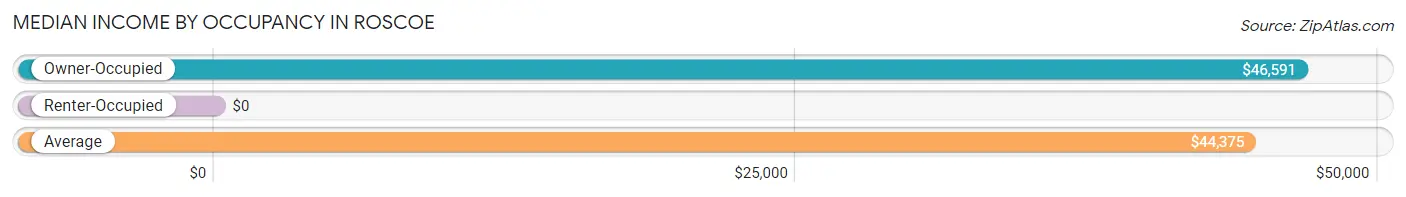
| Occupancy Type | # Households | Median Income |
| Owner-Occupied | 430 (84.2%) | $46,591 |
| Renter-Occupied | 81 (15.9%) | $0 |
| Average | 511 (100.0%) | $44,375 |
Occupancy by Householder Income Bracket in Roscoe
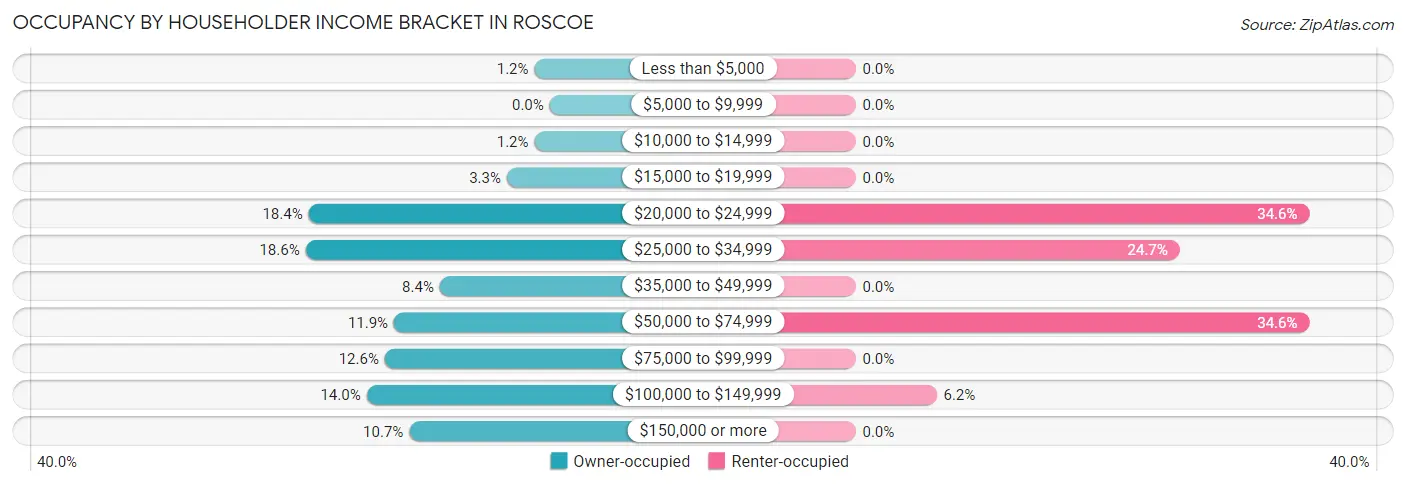
| Income Bracket | Owner-occupied | Renter-occupied |
| Less than $5,000 | 5 (1.2%) | 0 (0.0%) |
| $5,000 to $9,999 | 0 (0.0%) | 0 (0.0%) |
| $10,000 to $14,999 | 5 (1.2%) | 0 (0.0%) |
| $15,000 to $19,999 | 14 (3.3%) | 0 (0.0%) |
| $20,000 to $24,999 | 79 (18.4%) | 28 (34.6%) |
| $25,000 to $34,999 | 80 (18.6%) | 20 (24.7%) |
| $35,000 to $49,999 | 36 (8.4%) | 0 (0.0%) |
| $50,000 to $74,999 | 51 (11.9%) | 28 (34.6%) |
| $75,000 to $99,999 | 54 (12.6%) | 0 (0.0%) |
| $100,000 to $149,999 | 60 (14.0%) | 5 (6.2%) |
| $150,000 or more | 46 (10.7%) | 0 (0.0%) |
| Total | 430 (100.0%) | 81 (100.0%) |
Monthly Housing Cost Tiers in Roscoe
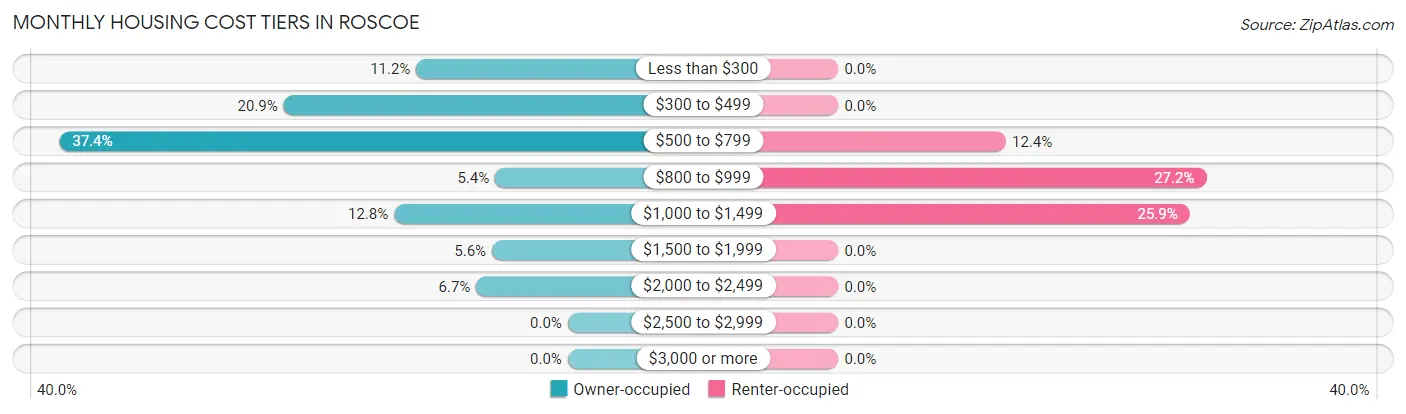
| Monthly Cost | Owner-occupied | Renter-occupied |
| Less than $300 | 48 (11.2%) | 0 (0.0%) |
| $300 to $499 | 90 (20.9%) | 0 (0.0%) |
| $500 to $799 | 161 (37.4%) | 10 (12.3%) |
| $800 to $999 | 23 (5.3%) | 22 (27.2%) |
| $1,000 to $1,499 | 55 (12.8%) | 21 (25.9%) |
| $1,500 to $1,999 | 24 (5.6%) | 0 (0.0%) |
| $2,000 to $2,499 | 29 (6.7%) | 0 (0.0%) |
| $2,500 to $2,999 | 0 (0.0%) | 0 (0.0%) |
| $3,000 or more | 0 (0.0%) | 0 (0.0%) |
| Total | 430 (100.0%) | 81 (100.0%) |
Physical Housing Characteristics in Roscoe
Housing Structures in Roscoe
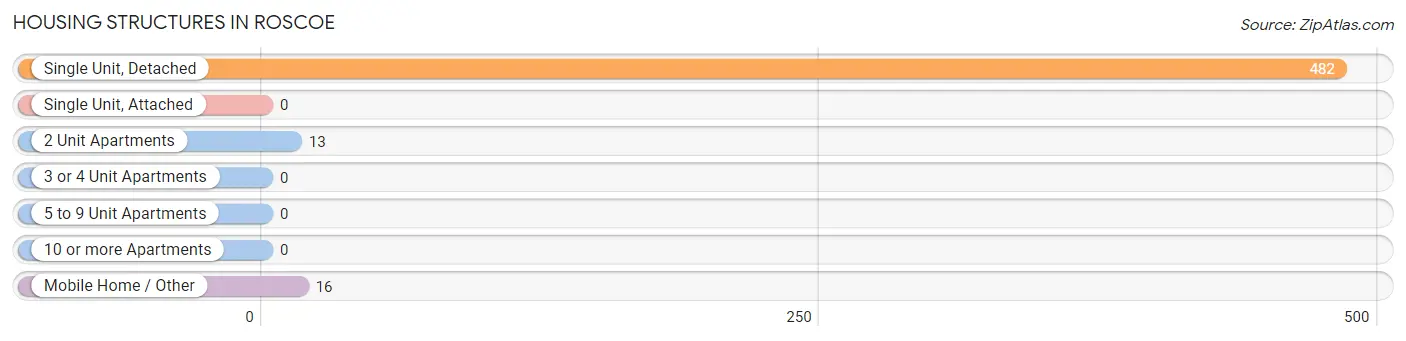
| Structure Type | # Housing Units | % Housing Units |
| Single Unit, Detached | 482 | 94.3% |
| Single Unit, Attached | 0 | 0.0% |
| 2 Unit Apartments | 13 | 2.5% |
| 3 or 4 Unit Apartments | 0 | 0.0% |
| 5 to 9 Unit Apartments | 0 | 0.0% |
| 10 or more Apartments | 0 | 0.0% |
| Mobile Home / Other | 16 | 3.1% |
| Total | 511 | 100.0% |
Housing Structures by Occupancy in Roscoe
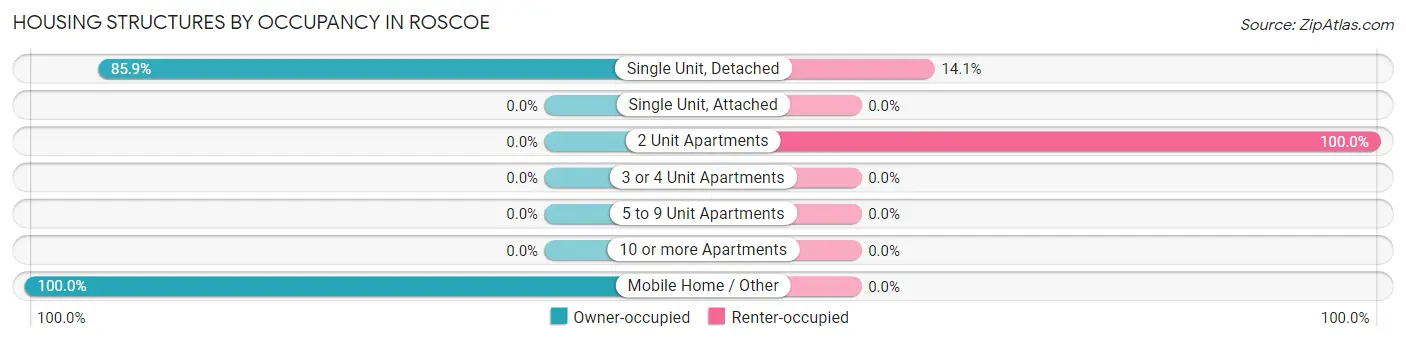
| Structure Type | Owner-occupied | Renter-occupied |
| Single Unit, Detached | 414 (85.9%) | 68 (14.1%) |
| Single Unit, Attached | 0 (0.0%) | 0 (0.0%) |
| 2 Unit Apartments | 0 (0.0%) | 13 (100.0%) |
| 3 or 4 Unit Apartments | 0 (0.0%) | 0 (0.0%) |
| 5 to 9 Unit Apartments | 0 (0.0%) | 0 (0.0%) |
| 10 or more Apartments | 0 (0.0%) | 0 (0.0%) |
| Mobile Home / Other | 16 (100.0%) | 0 (0.0%) |
| Total | 430 (84.2%) | 81 (15.9%) |
Housing Structures by Number of Rooms in Roscoe
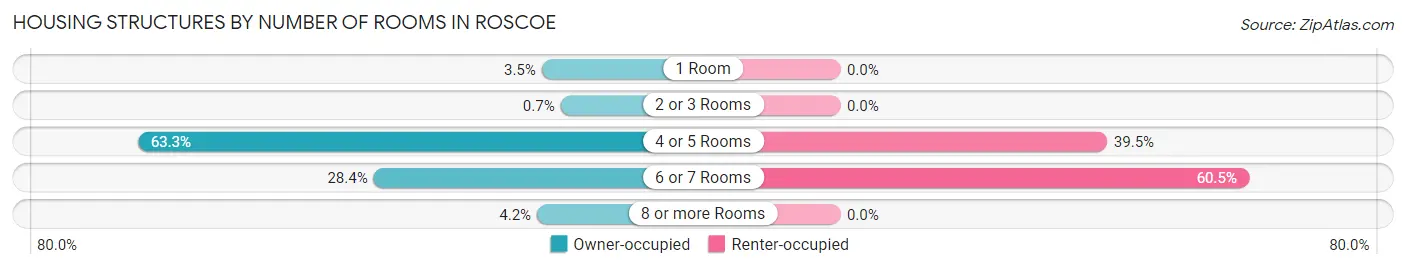
| Number of Rooms | Owner-occupied | Renter-occupied |
| 1 Room | 15 (3.5%) | 0 (0.0%) |
| 2 or 3 Rooms | 3 (0.7%) | 0 (0.0%) |
| 4 or 5 Rooms | 272 (63.3%) | 32 (39.5%) |
| 6 or 7 Rooms | 122 (28.4%) | 49 (60.5%) |
| 8 or more Rooms | 18 (4.2%) | 0 (0.0%) |
| Total | 430 (100.0%) | 81 (100.0%) |
Housing Structure by Heating Type in Roscoe
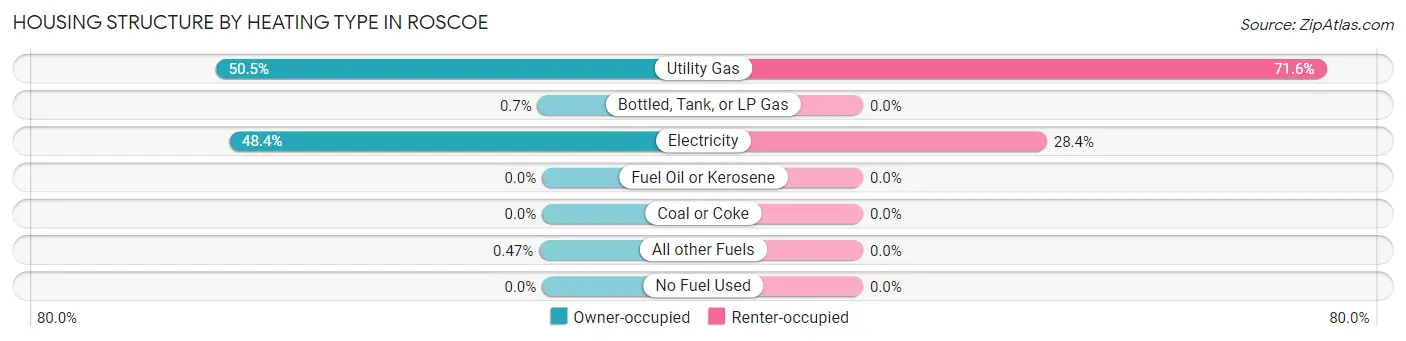
| Heating Type | Owner-occupied | Renter-occupied |
| Utility Gas | 217 (50.5%) | 58 (71.6%) |
| Bottled, Tank, or LP Gas | 3 (0.7%) | 0 (0.0%) |
| Electricity | 208 (48.4%) | 23 (28.4%) |
| Fuel Oil or Kerosene | 0 (0.0%) | 0 (0.0%) |
| Coal or Coke | 0 (0.0%) | 0 (0.0%) |
| All other Fuels | 2 (0.5%) | 0 (0.0%) |
| No Fuel Used | 0 (0.0%) | 0 (0.0%) |
| Total | 430 (100.0%) | 81 (100.0%) |
Household Vehicle Usage in Roscoe
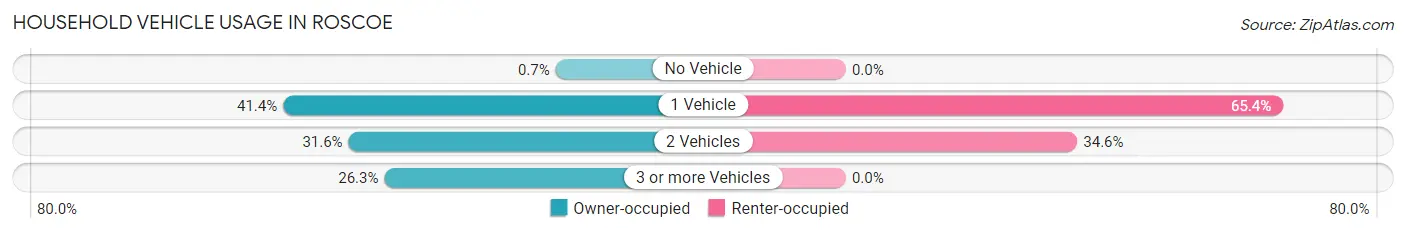
| Vehicles per Household | Owner-occupied | Renter-occupied |
| No Vehicle | 3 (0.7%) | 0 (0.0%) |
| 1 Vehicle | 178 (41.4%) | 53 (65.4%) |
| 2 Vehicles | 136 (31.6%) | 28 (34.6%) |
| 3 or more Vehicles | 113 (26.3%) | 0 (0.0%) |
| Total | 430 (100.0%) | 81 (100.0%) |
Real Estate & Mortgages in Roscoe
Real Estate and Mortgage Overview in Roscoe
| Characteristic | Without Mortgage | With Mortgage |
| Housing Units | 326 | 104 |
| Median Property Value | $48,500 | $145,400 |
| Median Household Income | $33,696 | $39 |
| Monthly Housing Costs | $518 | $0 |
| Real Estate Taxes | $780 | $0 |
Property Value by Mortgage Status in Roscoe
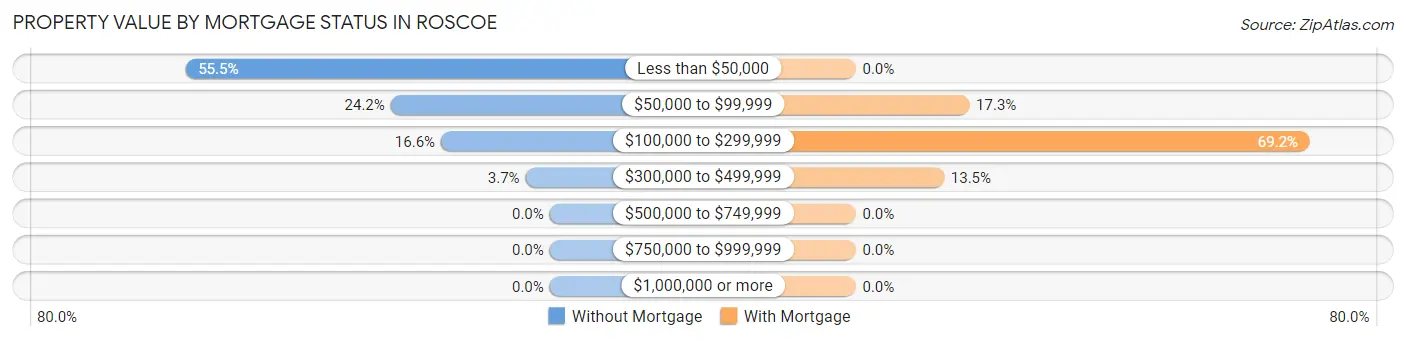
| Property Value | Without Mortgage | With Mortgage |
| Less than $50,000 | 181 (55.5%) | 0 (0.0%) |
| $50,000 to $99,999 | 79 (24.2%) | 18 (17.3%) |
| $100,000 to $299,999 | 54 (16.6%) | 72 (69.2%) |
| $300,000 to $499,999 | 12 (3.7%) | 14 (13.5%) |
| $500,000 to $749,999 | 0 (0.0%) | 0 (0.0%) |
| $750,000 to $999,999 | 0 (0.0%) | 0 (0.0%) |
| $1,000,000 or more | 0 (0.0%) | 0 (0.0%) |
| Total | 326 (100.0%) | 104 (100.0%) |
Household Income by Mortgage Status in Roscoe
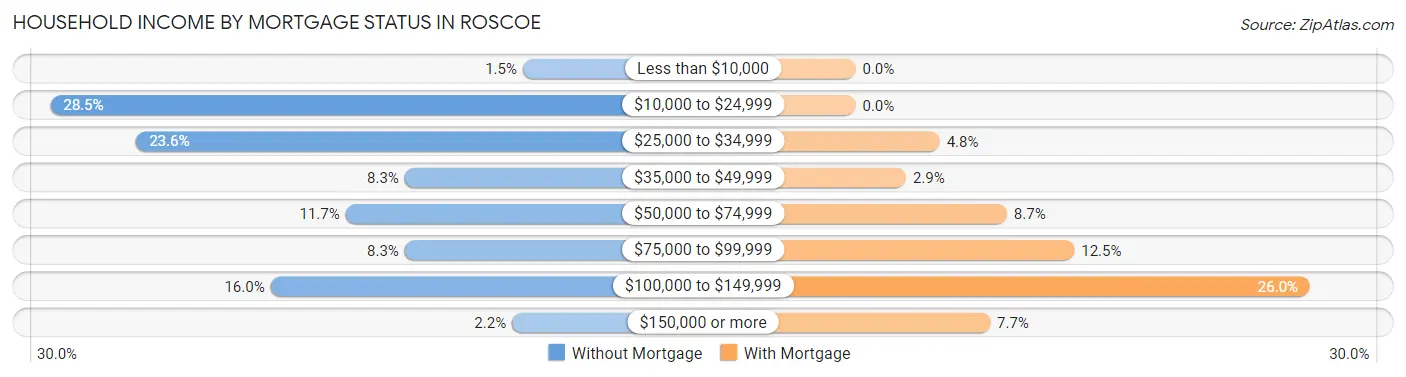
| Household Income | Without Mortgage | With Mortgage |
| Less than $10,000 | 5 (1.5%) | 0 (0.0%) |
| $10,000 to $24,999 | 93 (28.5%) | 0 (0.0%) |
| $25,000 to $34,999 | 77 (23.6%) | 5 (4.8%) |
| $35,000 to $49,999 | 27 (8.3%) | 3 (2.9%) |
| $50,000 to $74,999 | 38 (11.7%) | 9 (8.6%) |
| $75,000 to $99,999 | 27 (8.3%) | 13 (12.5%) |
| $100,000 to $149,999 | 52 (16.0%) | 27 (26.0%) |
| $150,000 or more | 7 (2.1%) | 8 (7.7%) |
| Total | 326 (100.0%) | 104 (100.0%) |
Property Value to Household Income Ratio in Roscoe
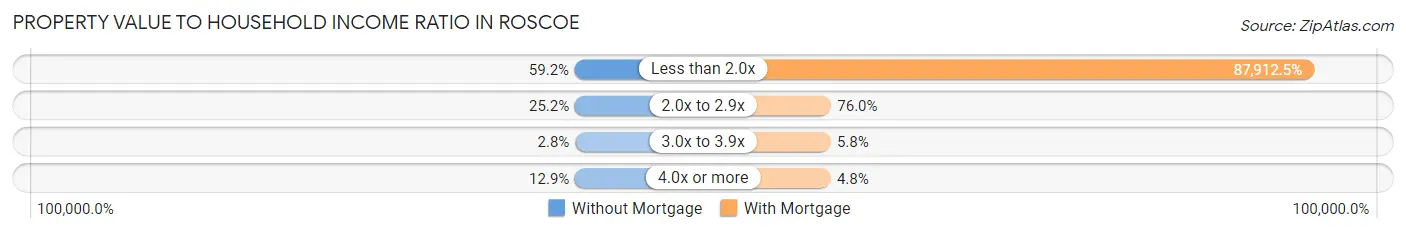
| Value-to-Income Ratio | Without Mortgage | With Mortgage |
| Less than 2.0x | 193 (59.2%) | 91,429 (87,912.5%) |
| 2.0x to 2.9x | 82 (25.2%) | 79 (76.0%) |
| 3.0x to 3.9x | 9 (2.8%) | 6 (5.8%) |
| 4.0x or more | 42 (12.9%) | 5 (4.8%) |
| Total | 326 (100.0%) | 104 (100.0%) |
Real Estate Taxes by Mortgage Status in Roscoe
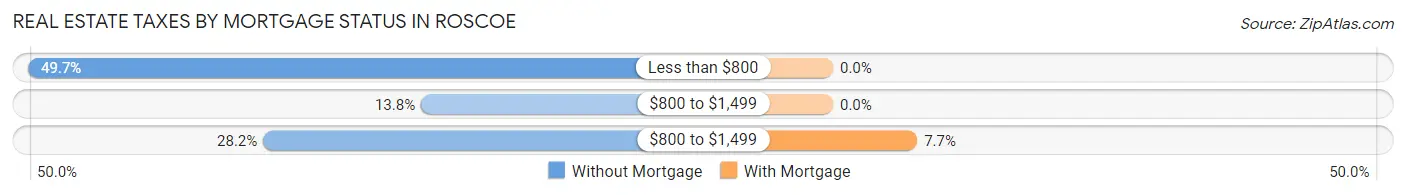
| Property Taxes | Without Mortgage | With Mortgage |
| Less than $800 | 162 (49.7%) | 0 (0.0%) |
| $800 to $1,499 | 45 (13.8%) | 0 (0.0%) |
| $800 to $1,499 | 92 (28.2%) | 8 (7.7%) |
| Total | 326 (100.0%) | 104 (100.0%) |
Health & Disability in Roscoe
Health Insurance Coverage by Age in Roscoe
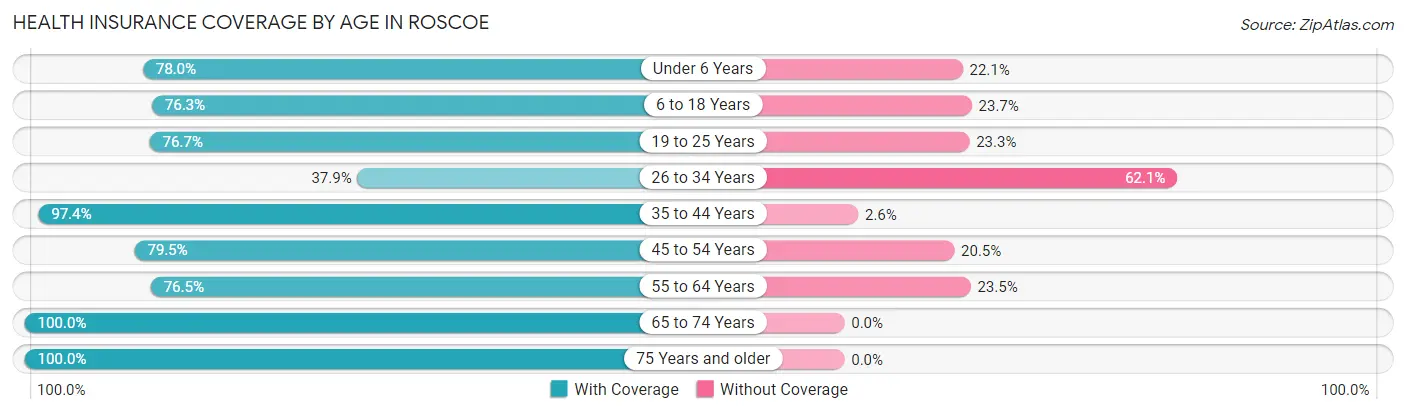
| Age Bracket | With Coverage | Without Coverage |
| Under 6 Years | 99 (77.9%) | 28 (22.1%) |
| 6 to 18 Years | 212 (76.3%) | 66 (23.7%) |
| 19 to 25 Years | 135 (76.7%) | 41 (23.3%) |
| 26 to 34 Years | 113 (37.9%) | 185 (62.1%) |
| 35 to 44 Years | 114 (97.4%) | 3 (2.6%) |
| 45 to 54 Years | 167 (79.5%) | 43 (20.5%) |
| 55 to 64 Years | 52 (76.5%) | 16 (23.5%) |
| 65 to 74 Years | 51 (100.0%) | 0 (0.0%) |
| 75 Years and older | 140 (100.0%) | 0 (0.0%) |
| Total | 1,083 (73.9%) | 382 (26.1%) |
Health Insurance Coverage by Citizenship Status in Roscoe
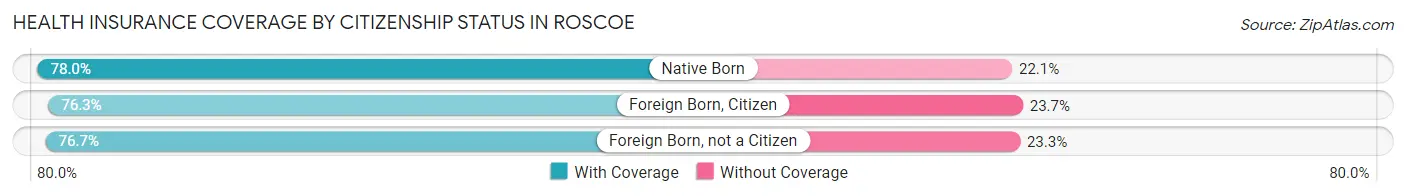
| Citizenship Status | With Coverage | Without Coverage |
| Native Born | 99 (77.9%) | 28 (22.1%) |
| Foreign Born, Citizen | 212 (76.3%) | 66 (23.7%) |
| Foreign Born, not a Citizen | 135 (76.7%) | 41 (23.3%) |
Health Insurance Coverage by Household Income in Roscoe
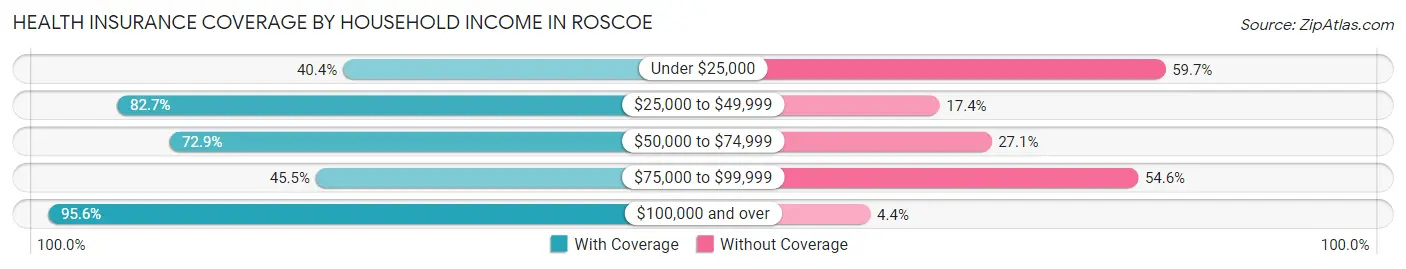
| Household Income | With Coverage | Without Coverage |
| Under $25,000 | 69 (40.4%) | 102 (59.7%) |
| $25,000 to $49,999 | 281 (82.7%) | 59 (17.3%) |
| $50,000 to $74,999 | 186 (72.9%) | 69 (27.1%) |
| $75,000 to $99,999 | 110 (45.5%) | 132 (54.5%) |
| $100,000 and over | 437 (95.6%) | 20 (4.4%) |
Public vs Private Health Insurance Coverage by Age in Roscoe
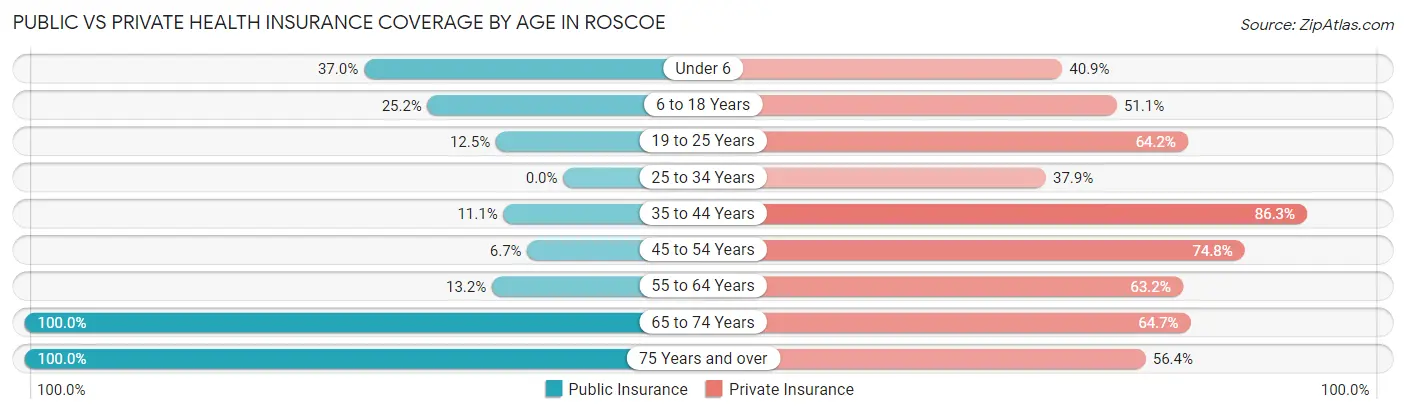
| Age Bracket | Public Insurance | Private Insurance |
| Under 6 | 47 (37.0%) | 52 (40.9%) |
| 6 to 18 Years | 70 (25.2%) | 142 (51.1%) |
| 19 to 25 Years | 22 (12.5%) | 113 (64.2%) |
| 25 to 34 Years | 0 (0.0%) | 113 (37.9%) |
| 35 to 44 Years | 13 (11.1%) | 101 (86.3%) |
| 45 to 54 Years | 14 (6.7%) | 157 (74.8%) |
| 55 to 64 Years | 9 (13.2%) | 43 (63.2%) |
| 65 to 74 Years | 51 (100.0%) | 33 (64.7%) |
| 75 Years and over | 140 (100.0%) | 79 (56.4%) |
| Total | 366 (25.0%) | 833 (56.9%) |
Disability Status by Sex by Age in Roscoe
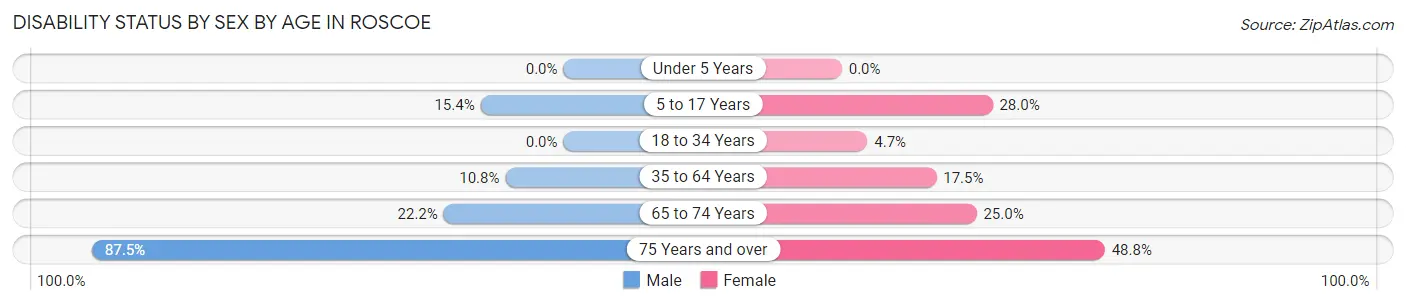
| Age Bracket | Male | Female |
| Under 5 Years | 0 (0.0%) | 0 (0.0%) |
| 5 to 17 Years | 26 (15.4%) | 40 (28.0%) |
| 18 to 34 Years | 0 (0.0%) | 9 (4.7%) |
| 35 to 64 Years | 18 (10.8%) | 40 (17.5%) |
| 65 to 74 Years | 6 (22.2%) | 6 (25.0%) |
| 75 Years and over | 49 (87.5%) | 41 (48.8%) |
Disability Class by Sex by Age in Roscoe
Disability Class: Hearing Difficulty
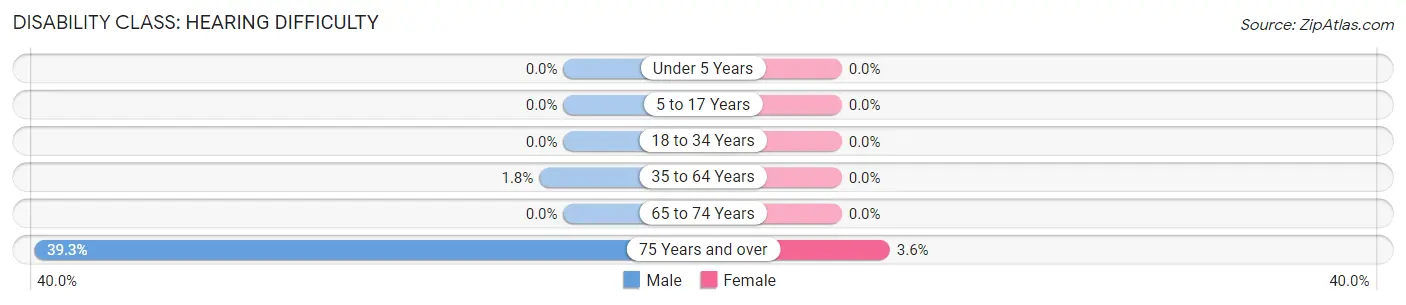
| Age Bracket | Male | Female |
| Under 5 Years | 0 (0.0%) | 0 (0.0%) |
| 5 to 17 Years | 0 (0.0%) | 0 (0.0%) |
| 18 to 34 Years | 0 (0.0%) | 0 (0.0%) |
| 35 to 64 Years | 3 (1.8%) | 0 (0.0%) |
| 65 to 74 Years | 0 (0.0%) | 0 (0.0%) |
| 75 Years and over | 22 (39.3%) | 3 (3.6%) |
Disability Class: Vision Difficulty
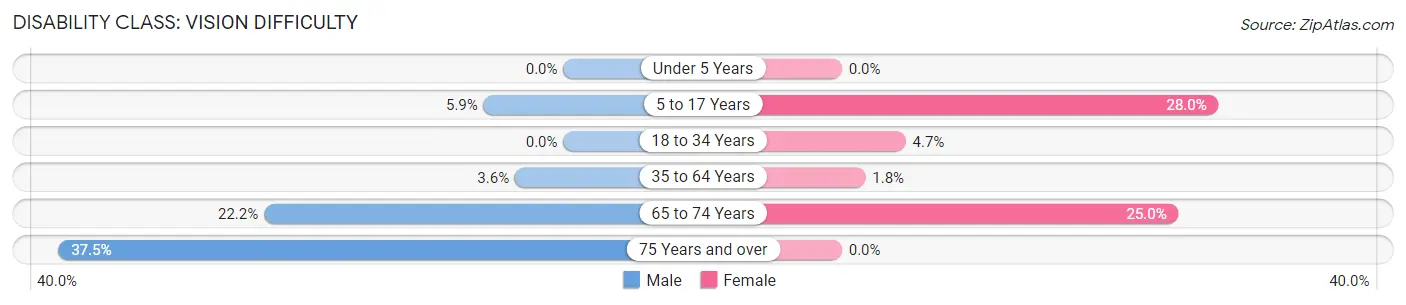
| Age Bracket | Male | Female |
| Under 5 Years | 0 (0.0%) | 0 (0.0%) |
| 5 to 17 Years | 10 (5.9%) | 40 (28.0%) |
| 18 to 34 Years | 0 (0.0%) | 9 (4.7%) |
| 35 to 64 Years | 6 (3.6%) | 4 (1.8%) |
| 65 to 74 Years | 6 (22.2%) | 6 (25.0%) |
| 75 Years and over | 21 (37.5%) | 0 (0.0%) |
Disability Class: Cognitive Difficulty
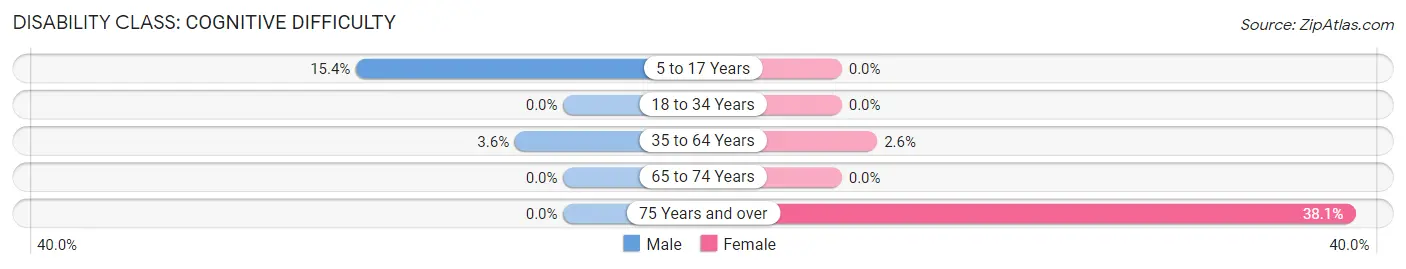
| Age Bracket | Male | Female |
| 5 to 17 Years | 26 (15.4%) | 0 (0.0%) |
| 18 to 34 Years | 0 (0.0%) | 0 (0.0%) |
| 35 to 64 Years | 6 (3.6%) | 6 (2.6%) |
| 65 to 74 Years | 0 (0.0%) | 0 (0.0%) |
| 75 Years and over | 0 (0.0%) | 32 (38.1%) |
Disability Class: Ambulatory Difficulty
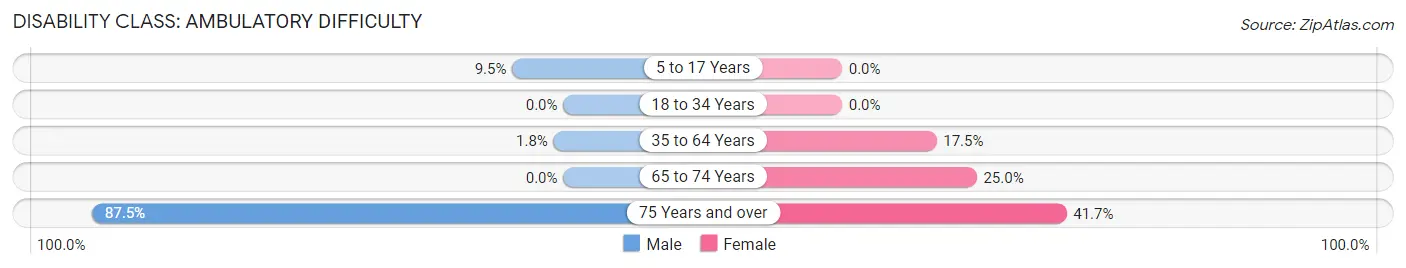
| Age Bracket | Male | Female |
| 5 to 17 Years | 16 (9.5%) | 0 (0.0%) |
| 18 to 34 Years | 0 (0.0%) | 0 (0.0%) |
| 35 to 64 Years | 3 (1.8%) | 40 (17.5%) |
| 65 to 74 Years | 0 (0.0%) | 6 (25.0%) |
| 75 Years and over | 49 (87.5%) | 35 (41.7%) |
Disability Class: Self-Care Difficulty
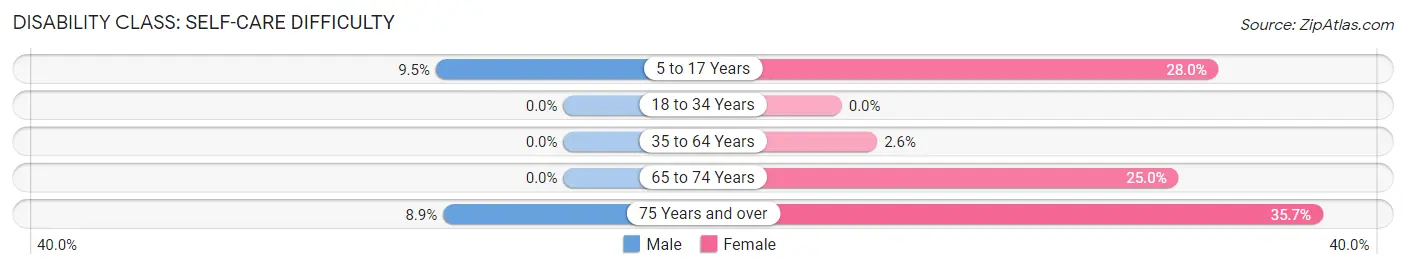
| Age Bracket | Male | Female |
| 5 to 17 Years | 16 (9.5%) | 40 (28.0%) |
| 18 to 34 Years | 0 (0.0%) | 0 (0.0%) |
| 35 to 64 Years | 0 (0.0%) | 6 (2.6%) |
| 65 to 74 Years | 0 (0.0%) | 6 (25.0%) |
| 75 Years and over | 5 (8.9%) | 30 (35.7%) |
Technology Access in Roscoe
Computing Device Access in Roscoe
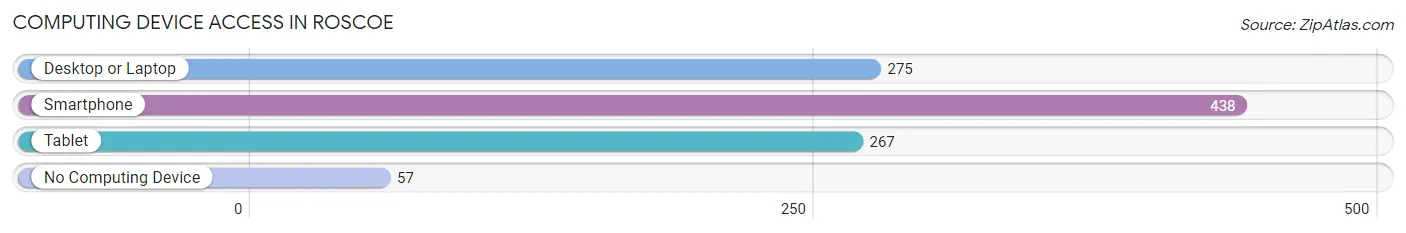
| Device Type | # Households | % Households |
| Desktop or Laptop | 275 | 53.8% |
| Smartphone | 438 | 85.7% |
| Tablet | 267 | 52.2% |
| No Computing Device | 57 | 11.2% |
| Total | 511 | 100.0% |
Internet Access in Roscoe
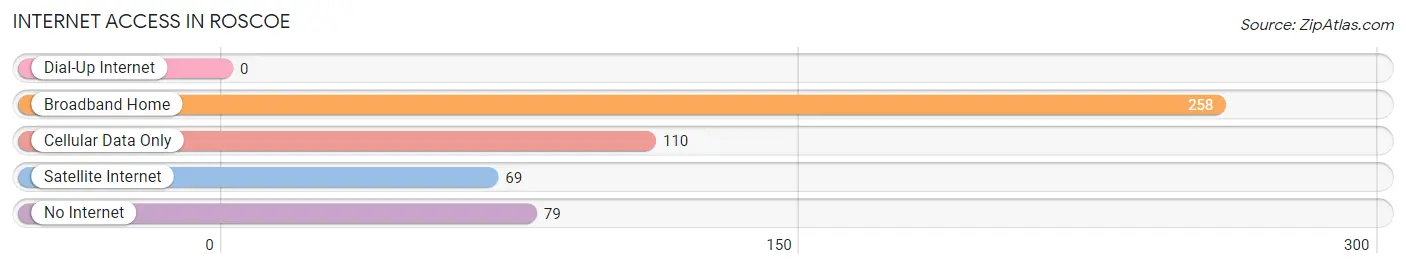
| Internet Type | # Households | % Households |
| Dial-Up Internet | 0 | 0.0% |
| Broadband Home | 258 | 50.5% |
| Cellular Data Only | 110 | 21.5% |
| Satellite Internet | 69 | 13.5% |
| No Internet | 79 | 15.5% |
| Total | 511 | 100.0% |
Roscoe Summary
Roscoe, Texas is a small town located in the heart of Nolan County, Texas. It is situated in the rolling hills of the Texas Hill Country, about 70 miles west of Abilene. The town was founded in 1881 and has a population of 1,741 as of the 2010 census.
History
The town of Roscoe was founded in 1881 by a group of settlers from the nearby town of Sweetwater. The settlers were looking for a place to settle and start a new life. The town was named after Roscoe Conkling, a prominent politician from New York. The town was officially incorporated in 1883.
The town grew slowly but steadily over the years, and by the early 1900s, it had become a thriving community. The town was home to several businesses, including a bank, a hotel, a general store, and a post office. The town also had a school, a church, and a newspaper.
In the early 1900s, the town was a major stop on the Texas and Pacific Railway. This allowed the town to become a major shipping center for the surrounding area. The town also had a thriving agricultural industry, with cotton, corn, and wheat being the main crops.
Geography
Roscoe is located in the rolling hills of the Texas Hill Country, about 70 miles west of Abilene. The town is situated on the banks of the Colorado River, which provides a natural border between the town and the surrounding area. The town is surrounded by several small towns and communities, including Sweetwater, Blackwell, and Loraine.
The town has a total area of 1.2 square miles, all of which is land. The town has a humid subtropical climate, with hot summers and mild winters. The average temperature in the summer is around 90 degrees Fahrenheit, and the average temperature in the winter is around 50 degrees Fahrenheit.
Economy
The economy of Roscoe is largely based on agriculture and tourism. The town is home to several farms, which produce cotton, corn, wheat, and other crops. The town is also home to several small businesses, including restaurants, shops, and other services.
The town is also a popular tourist destination, with many visitors coming to the area to enjoy the natural beauty of the Texas Hill Country. The town is home to several parks, including the Roscoe State Park, which offers camping, fishing, and other outdoor activities.
Demographics
As of the 2010 census, the town of Roscoe had a population of 1,741. The racial makeup of the town was 94.3% White, 0.2% African American, 0.2% Native American, 0.2% Asian, 0.1% Pacific Islander, 3.3% from other races, and 1.9% from two or more races. Hispanic or Latino of any race were 6.2% of the population.
The median income for a household in the town was $31,250, and the median income for a family was $37,500. The per capita income for the town was $17,845. About 15.2% of families and 18.2% of the population were below the poverty line, including 25.3% of those under age 18 and 11.2% of those age 65 or over.
Overall, Roscoe is a small town with a rich history and a vibrant economy. The town is home to a diverse population and offers a variety of activities and attractions for visitors and residents alike. The town is a great place to live, work, and play, and is sure to remain a popular destination for years to come.
Common Questions
What is Per Capita Income in Roscoe?
Per Capita income in Roscoe is $23,337.
What is the Median Family Income in Roscoe?
Median Family Income in Roscoe is $51,905.
What is the Median Household income in Roscoe?
Median Household Income in Roscoe is $44,375.
What is Income or Wage Gap in Roscoe?
Income or Wage Gap in Roscoe is 24.7%.
Women in Roscoe earn 75.3 cents for every dollar earned by a man.
What is Inequality or Gini Index in Roscoe?
Inequality or Gini Index in Roscoe is 0.41.
What is the Total Population of Roscoe?
Total Population of Roscoe is 1,465.
What is the Total Male Population of Roscoe?
Total Male Population of Roscoe is 748.
What is the Total Female Population of Roscoe?
Total Female Population of Roscoe is 717.
What is the Ratio of Males per 100 Females in Roscoe?
There are 104.32 Males per 100 Females in Roscoe.
What is the Ratio of Females per 100 Males in Roscoe?
There are 95.86 Females per 100 Males in Roscoe.
What is the Median Population Age in Roscoe?
Median Population Age in Roscoe is 30.2 Years.
What is the Average Family Size in Roscoe
Average Family Size in Roscoe is 3.4 People.
What is the Average Household Size in Roscoe
Average Household Size in Roscoe is 2.9 People.
How Large is the Labor Force in Roscoe?
There are 695 People in the Labor Forcein in Roscoe.
What is the Percentage of People in the Labor Force in Roscoe?
61.6% of People are in the Labor Force in Roscoe.
What is the Unemployment Rate in Roscoe?
Unemployment Rate in Roscoe is 7.2%.