Friendswood, TX Map & Demographics
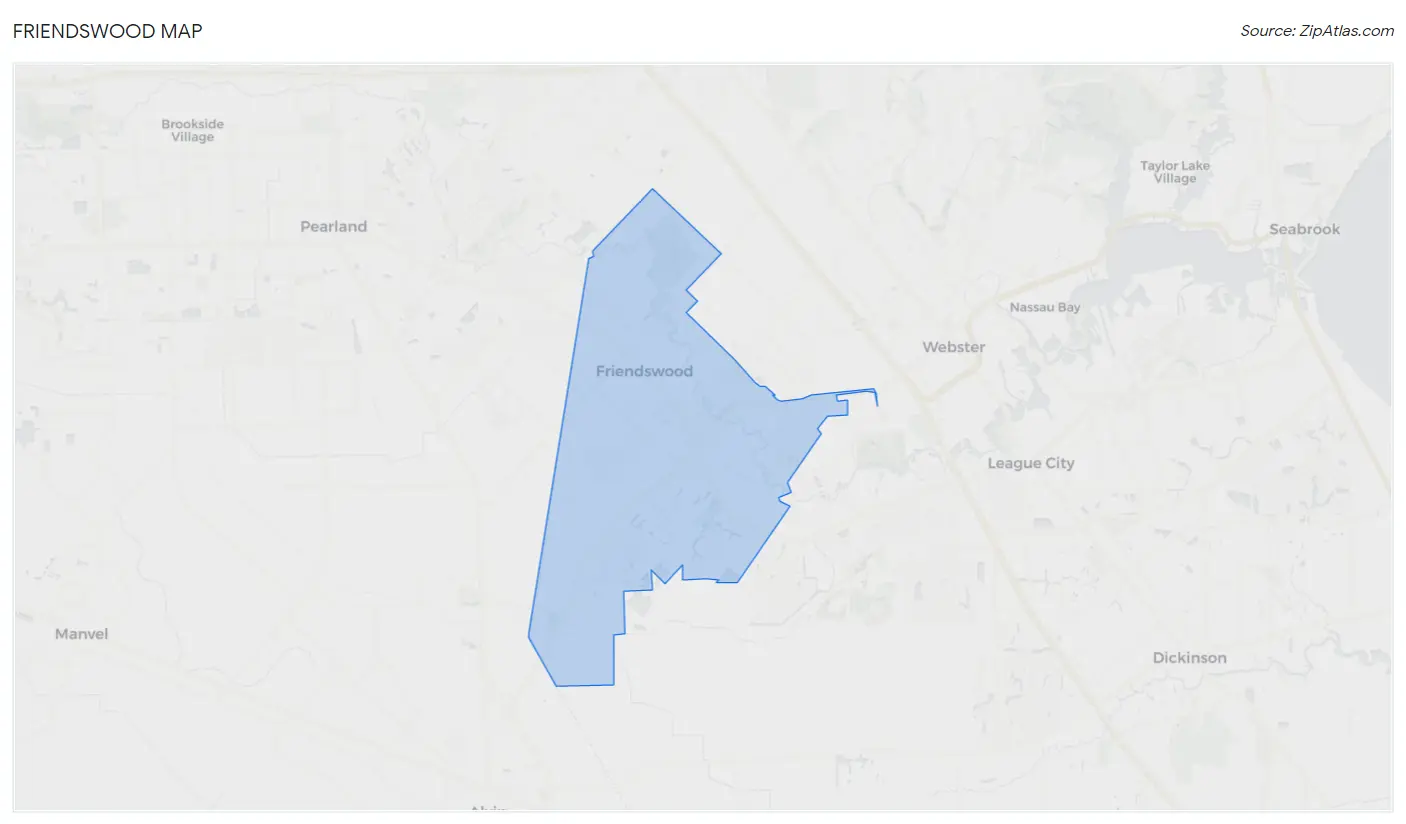
Friendswood Map
Friendswood Overview
$53,766
PER CAPITA INCOME
$144,408
AVG FAMILY INCOME
$121,301
AVG HOUSEHOLD INCOME
34.9%
WAGE / INCOME GAP [ % ]
65.1¢/ $1
WAGE / INCOME GAP [ $ ]
0.42
INEQUALITY / GINI INDEX
40,888
TOTAL POPULATION
19,682
MALE POPULATION
21,206
FEMALE POPULATION
92.81
MALES / 100 FEMALES
107.74
FEMALES / 100 MALES
38.7
MEDIAN AGE
3.3
AVG FAMILY SIZE
2.9
AVG HOUSEHOLD SIZE
20,504
LABOR FORCE [ PEOPLE ]
65.7%
PERCENT IN LABOR FORCE
4.6%
UNEMPLOYMENT RATE
Friendswood Zip Codes
Income in Friendswood
Income Overview in Friendswood
Per Capita Income in Friendswood is $53,766, while median incomes of families and households are $144,408 and $121,301 respectively.
| Characteristic | Number | Measure |
| Per Capita Income | 40,888 | $53,766 |
| Median Family Income | 11,069 | $144,408 |
| Mean Family Income | 11,069 | $177,780 |
| Median Household Income | 14,201 | $121,301 |
| Mean Household Income | 14,201 | $154,833 |
| Income Deficit | 11,069 | $0 |
| Wage / Income Gap (%) | 40,888 | 34.88% |
| Wage / Income Gap ($) | 40,888 | 65.12¢ per $1 |
| Gini / Inequality Index | 40,888 | 0.42 |
Earnings by Sex in Friendswood
Average Earnings in Friendswood are $62,628, $78,733 for men and $51,274 for women, a difference of 34.9%.
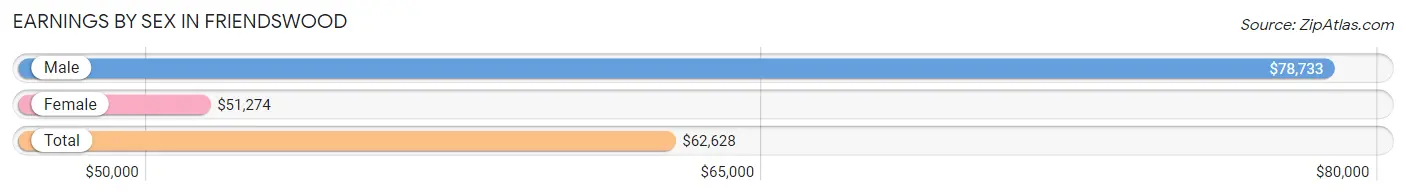
| Sex | Number | Average Earnings |
| Male | 11,404 (53.8%) | $78,733 |
| Female | 9,787 (46.2%) | $51,274 |
| Total | 21,191 (100.0%) | $62,628 |
Earnings by Sex by Income Bracket in Friendswood
The most common earnings brackets in Friendswood are $100,000+ for men (4,382 | 38.4%) and $100,000+ for women (1,788 | 18.3%).
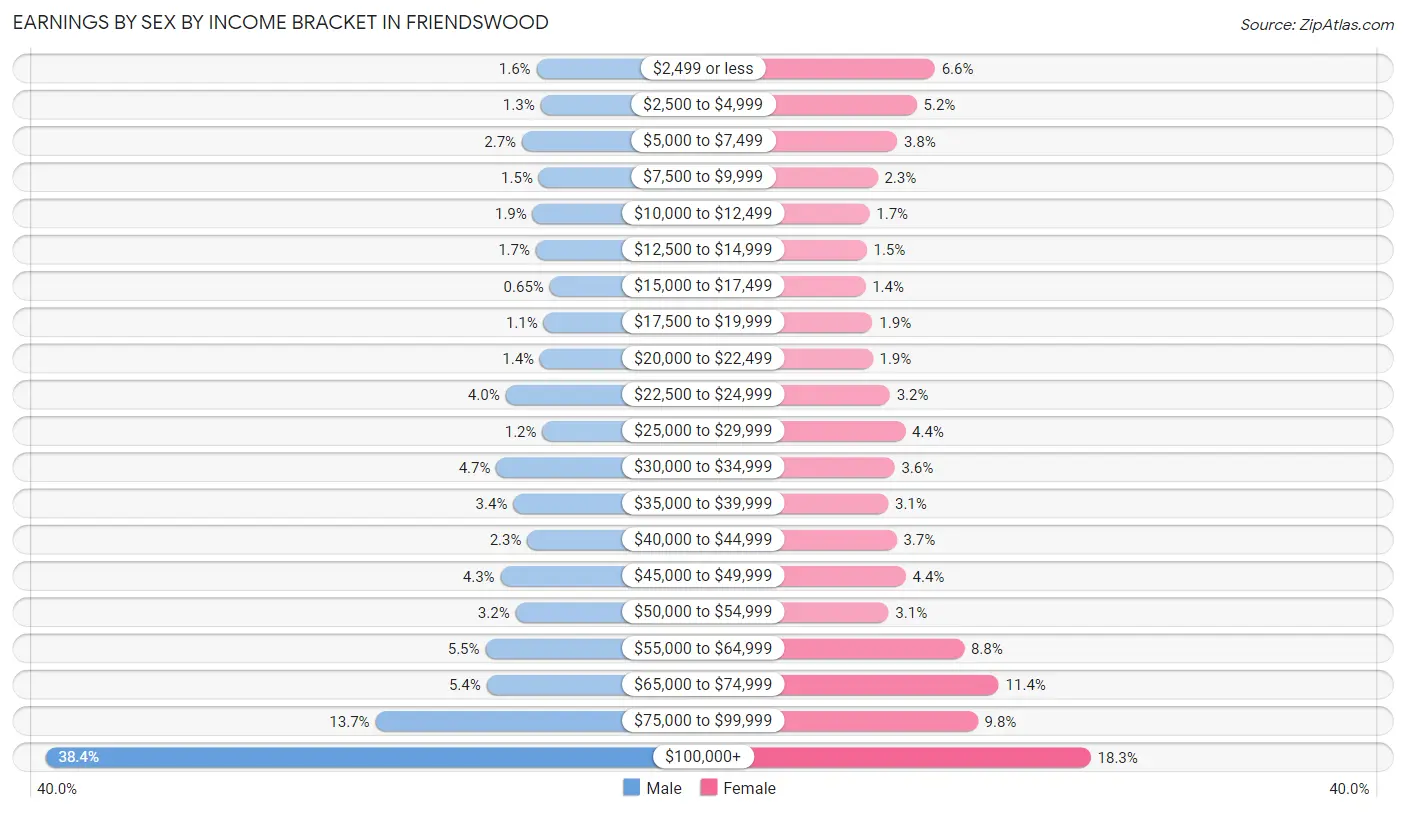
| Income | Male | Female |
| $2,499 or less | 187 (1.6%) | 645 (6.6%) |
| $2,500 to $4,999 | 153 (1.3%) | 512 (5.2%) |
| $5,000 to $7,499 | 311 (2.7%) | 368 (3.8%) |
| $7,500 to $9,999 | 168 (1.5%) | 225 (2.3%) |
| $10,000 to $12,499 | 220 (1.9%) | 165 (1.7%) |
| $12,500 to $14,999 | 193 (1.7%) | 145 (1.5%) |
| $15,000 to $17,499 | 74 (0.6%) | 135 (1.4%) |
| $17,500 to $19,999 | 127 (1.1%) | 188 (1.9%) |
| $20,000 to $22,499 | 157 (1.4%) | 189 (1.9%) |
| $22,500 to $24,999 | 452 (4.0%) | 315 (3.2%) |
| $25,000 to $29,999 | 137 (1.2%) | 428 (4.4%) |
| $30,000 to $34,999 | 530 (4.6%) | 349 (3.6%) |
| $35,000 to $39,999 | 386 (3.4%) | 302 (3.1%) |
| $40,000 to $44,999 | 266 (2.3%) | 364 (3.7%) |
| $45,000 to $49,999 | 495 (4.3%) | 432 (4.4%) |
| $50,000 to $54,999 | 366 (3.2%) | 305 (3.1%) |
| $55,000 to $64,999 | 624 (5.5%) | 859 (8.8%) |
| $65,000 to $74,999 | 613 (5.4%) | 1,114 (11.4%) |
| $75,000 to $99,999 | 1,563 (13.7%) | 959 (9.8%) |
| $100,000+ | 4,382 (38.4%) | 1,788 (18.3%) |
| Total | 11,404 (100.0%) | 9,787 (100.0%) |
Earnings by Sex by Educational Attainment in Friendswood
Average earnings in Friendswood are $90,179 for men and $60,192 for women, a difference of 33.3%. Men with an educational attainment of graduate degree enjoy the highest average annual earnings of $140,579, while those with high school diploma education earn the least with $53,506. Women with an educational attainment of graduate degree earn the most with the average annual earnings of $71,392, while those with high school diploma education have the smallest earnings of $33,235.
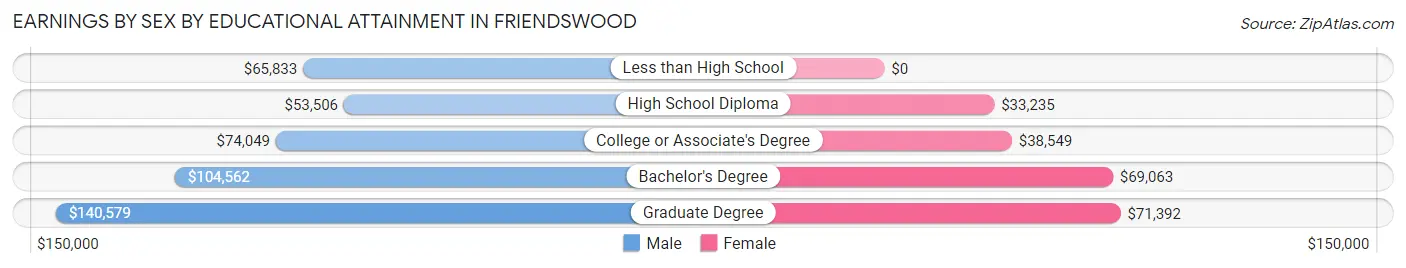
| Educational Attainment | Male Income | Female Income |
| Less than High School | $65,833 | $0 |
| High School Diploma | $53,506 | $33,235 |
| College or Associate's Degree | $74,049 | $38,549 |
| Bachelor's Degree | $104,562 | $69,063 |
| Graduate Degree | $140,579 | $71,392 |
| Total | $90,179 | $60,192 |
Family Income in Friendswood
Family Income Brackets in Friendswood
According to the Friendswood family income data, there are 3,442 families falling into the $200,000+ income range, which is the most common income bracket and makes up 31.1% of all families. Conversely, the $15,000 to $24,999 income bracket is the least frequent group with only 55 families (0.5%) belonging to this category.
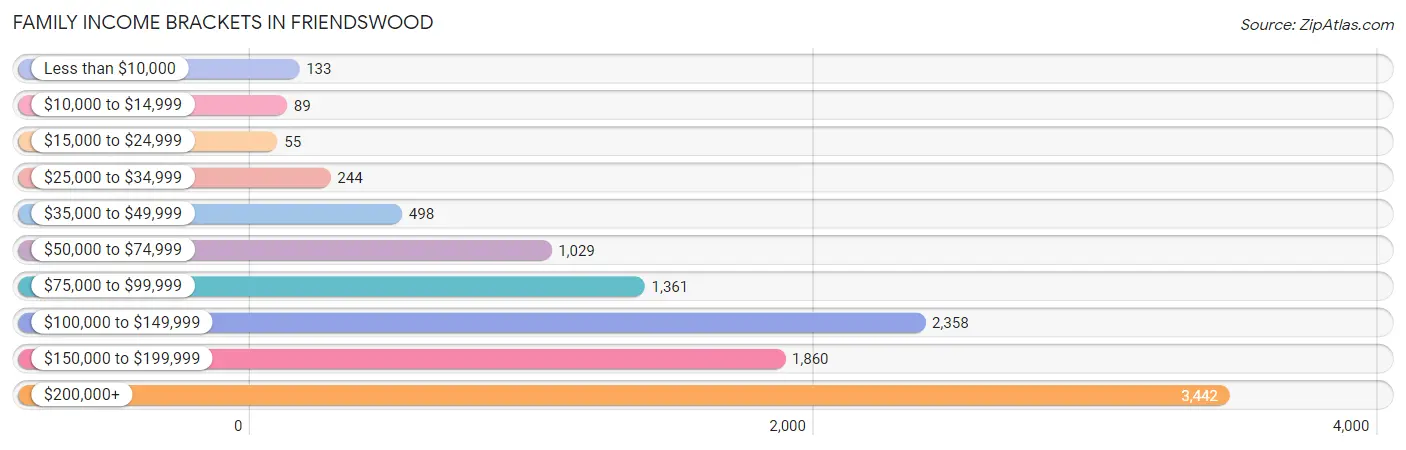
| Income Bracket | # Families | % Families |
| Less than $10,000 | 133 | 1.2% |
| $10,000 to $14,999 | 89 | 0.8% |
| $15,000 to $24,999 | 55 | 0.5% |
| $25,000 to $34,999 | 244 | 2.2% |
| $35,000 to $49,999 | 498 | 4.5% |
| $50,000 to $74,999 | 1,029 | 9.3% |
| $75,000 to $99,999 | 1,361 | 12.3% |
| $100,000 to $149,999 | 2,358 | 21.3% |
| $150,000 to $199,999 | 1,860 | 16.8% |
| $200,000+ | 3,442 | 31.1% |
Family Income by Famaliy Size in Friendswood
6-person families (282 | 2.5%) account for the highest median family income in Friendswood with $200,625 per family, while 2-person families (4,294 | 38.8%) have the highest median income of $57,842 per family member.
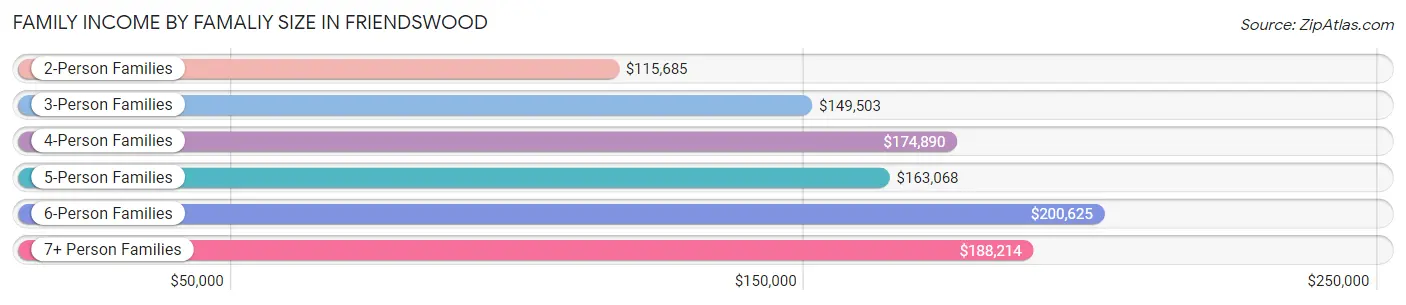
| Income Bracket | # Families | Median Income |
| 2-Person Families | 4,294 (38.8%) | $115,685 |
| 3-Person Families | 2,357 (21.3%) | $149,503 |
| 4-Person Families | 2,789 (25.2%) | $174,890 |
| 5-Person Families | 1,171 (10.6%) | $163,068 |
| 6-Person Families | 282 (2.5%) | $200,625 |
| 7+ Person Families | 176 (1.6%) | $188,214 |
| Total | 11,069 (100.0%) | $144,408 |
Family Income by Number of Earners in Friendswood
The median family income in Friendswood is $144,408, with families comprising 2 earners (4,885) having the highest median family income of $177,367, while families with no earners (1,106) have the lowest median family income of $77,128, accounting for 44.1% and 10.0% of families, respectively.
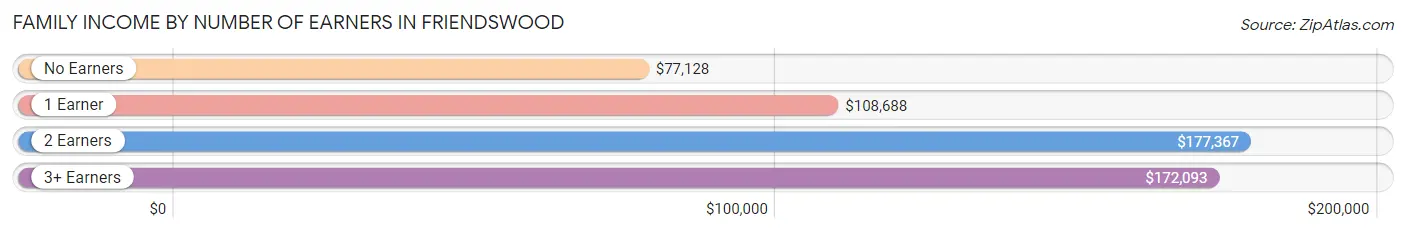
| Number of Earners | # Families | Median Income |
| No Earners | 1,106 (10.0%) | $77,128 |
| 1 Earner | 3,466 (31.3%) | $108,688 |
| 2 Earners | 4,885 (44.1%) | $177,367 |
| 3+ Earners | 1,612 (14.6%) | $172,093 |
| Total | 11,069 (100.0%) | $144,408 |
Household Income in Friendswood
Household Income Brackets in Friendswood
With 3,621 households falling in the category, the $200,000+ income range is the most frequent in Friendswood, accounting for 25.5% of all households. In contrast, only 185 households (1.3%) fall into the $10,000 to $14,999 income bracket, making it the least populous group.
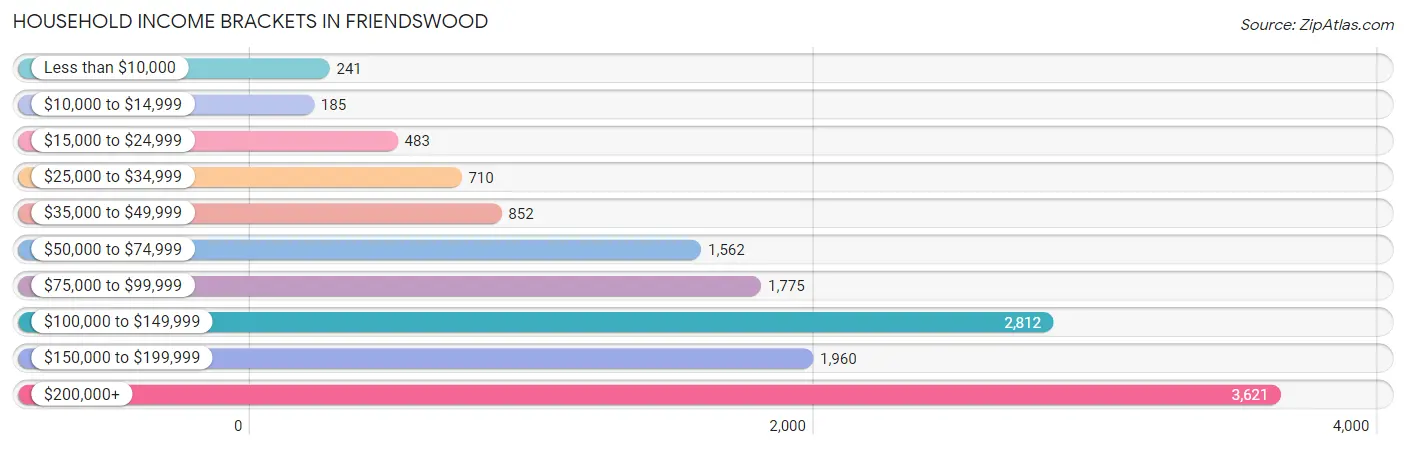
| Income Bracket | # Households | % Households |
| Less than $10,000 | 241 | 1.7% |
| $10,000 to $14,999 | 185 | 1.3% |
| $15,000 to $24,999 | 483 | 3.4% |
| $25,000 to $34,999 | 710 | 5.0% |
| $35,000 to $49,999 | 852 | 6.0% |
| $50,000 to $74,999 | 1,562 | 11.0% |
| $75,000 to $99,999 | 1,775 | 12.5% |
| $100,000 to $149,999 | 2,812 | 19.8% |
| $150,000 to $199,999 | 1,960 | 13.8% |
| $200,000+ | 3,621 | 25.5% |
Household Income by Householder Age in Friendswood
The median household income in Friendswood is $121,301, with the highest median household income of $162,451 found in the 45 to 64 years age bracket for the primary householder. A total of 5,959 households (42.0%) fall into this category. Meanwhile, the 65+ years age bracket for the primary householder has the lowest median household income of $66,722, with 3,634 households (25.6%) in this group.
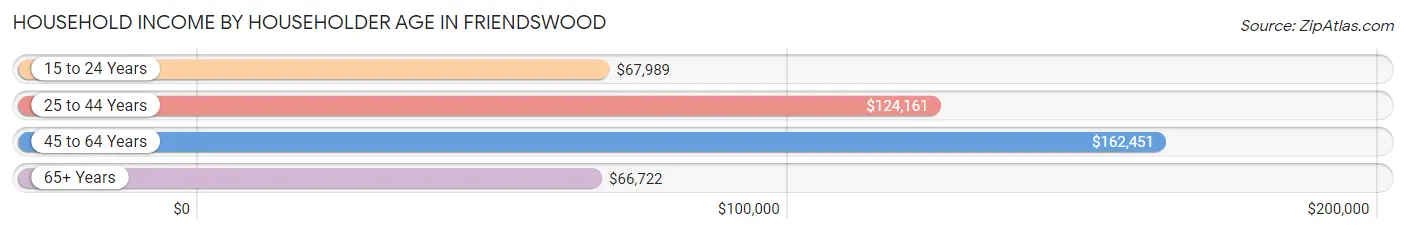
| Income Bracket | # Households | Median Income |
| 15 to 24 Years | 331 (2.3%) | $67,989 |
| 25 to 44 Years | 4,277 (30.1%) | $124,161 |
| 45 to 64 Years | 5,959 (42.0%) | $162,451 |
| 65+ Years | 3,634 (25.6%) | $66,722 |
| Total | 14,201 (100.0%) | $121,301 |
Poverty in Friendswood
Income Below Poverty by Sex and Age in Friendswood
With 2.5% poverty level for males and 3.3% for females among the residents of Friendswood, 6 to 11 year old males and 5 year old females are the most vulnerable to poverty, with 105 males (5.3%) and 27 females (12.7%) in their respective age groups living below the poverty level.
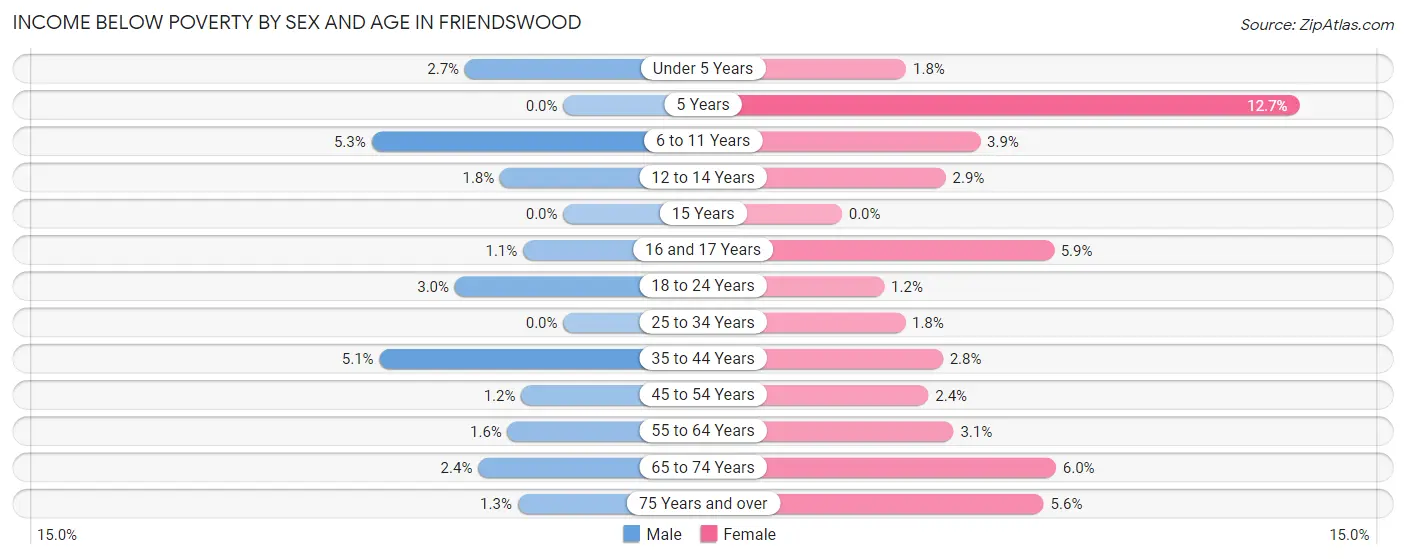
| Age Bracket | Male | Female |
| Under 5 Years | 41 (2.7%) | 20 (1.8%) |
| 5 Years | 0 (0.0%) | 27 (12.7%) |
| 6 to 11 Years | 105 (5.3%) | 70 (3.8%) |
| 12 to 14 Years | 17 (1.8%) | 36 (2.9%) |
| 15 Years | 0 (0.0%) | 0 (0.0%) |
| 16 and 17 Years | 6 (1.1%) | 47 (5.9%) |
| 18 to 24 Years | 59 (3.0%) | 20 (1.2%) |
| 25 to 34 Years | 0 (0.0%) | 38 (1.8%) |
| 35 to 44 Years | 137 (5.1%) | 70 (2.8%) |
| 45 to 54 Years | 32 (1.2%) | 80 (2.4%) |
| 55 to 64 Years | 41 (1.5%) | 76 (3.1%) |
| 65 to 74 Years | 36 (2.4%) | 108 (6.0%) |
| 75 Years and over | 11 (1.3%) | 94 (5.6%) |
| Total | 485 (2.5%) | 686 (3.3%) |
Income Above Poverty by Sex and Age in Friendswood
According to the poverty statistics in Friendswood, males aged 5 years and females aged 15 years are the age groups that are most secure financially, with 100.0% of males and 100.0% of females in these age groups living above the poverty line.
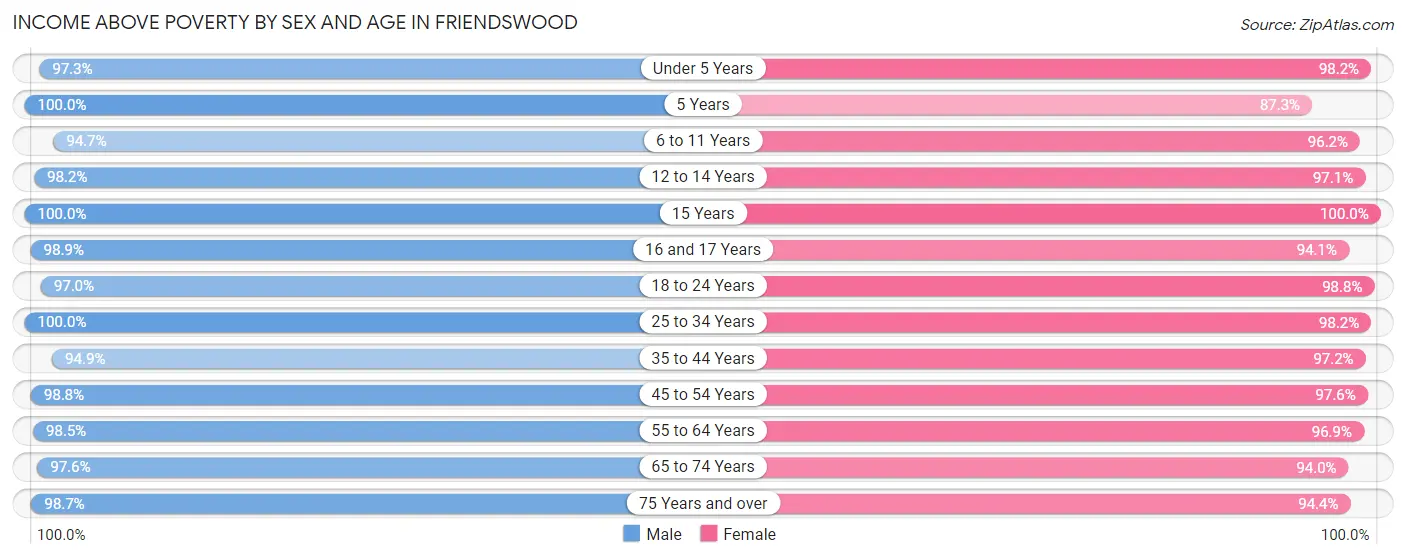
| Age Bracket | Male | Female |
| Under 5 Years | 1,453 (97.3%) | 1,099 (98.2%) |
| 5 Years | 214 (100.0%) | 185 (87.3%) |
| 6 to 11 Years | 1,863 (94.7%) | 1,748 (96.2%) |
| 12 to 14 Years | 949 (98.2%) | 1,211 (97.1%) |
| 15 Years | 280 (100.0%) | 293 (100.0%) |
| 16 and 17 Years | 528 (98.9%) | 750 (94.1%) |
| 18 to 24 Years | 1,893 (97.0%) | 1,674 (98.8%) |
| 25 to 34 Years | 1,690 (100.0%) | 2,116 (98.2%) |
| 35 to 44 Years | 2,537 (94.9%) | 2,422 (97.2%) |
| 45 to 54 Years | 2,709 (98.8%) | 3,237 (97.6%) |
| 55 to 64 Years | 2,608 (98.5%) | 2,366 (96.9%) |
| 65 to 74 Years | 1,482 (97.6%) | 1,704 (94.0%) |
| 75 Years and over | 854 (98.7%) | 1,578 (94.4%) |
| Total | 19,060 (97.5%) | 20,383 (96.7%) |
Income Below Poverty Among Married-Couple Families in Friendswood
The poverty statistics for married-couple families in Friendswood show that 0.7% or 70 of the total 9,295 families live below the poverty line. Families with 1 or 2 children have the highest poverty rate of 1.3%, comprising of 42 families. On the other hand, families with 3 or 4 children have the lowest poverty rate of 0.0%, which includes 0 families.
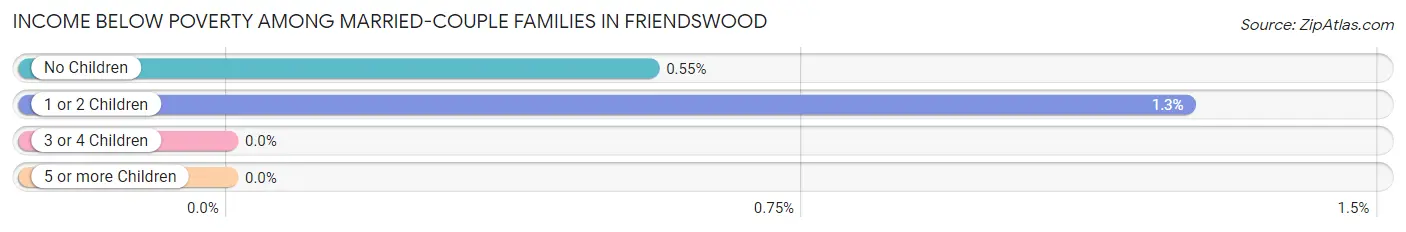
| Children | Above Poverty | Below Poverty |
| No Children | 5,097 (99.5%) | 28 (0.5%) |
| 1 or 2 Children | 3,328 (98.8%) | 42 (1.3%) |
| 3 or 4 Children | 737 (100.0%) | 0 (0.0%) |
| 5 or more Children | 63 (100.0%) | 0 (0.0%) |
| Total | 9,225 (99.3%) | 70 (0.7%) |
Income Below Poverty Among Single-Parent Households in Friendswood
According to the poverty data in Friendswood, 9.6% or 47 single-father households and 10.0% or 128 single-mother households are living below the poverty line. Among single-father households, those with 1 or 2 children have the highest poverty rate, with 33 households (17.6%) experiencing poverty. Likewise, among single-mother households, those with 5 or more children have the highest poverty rate, with 13 households (100.0%) falling below the poverty line.
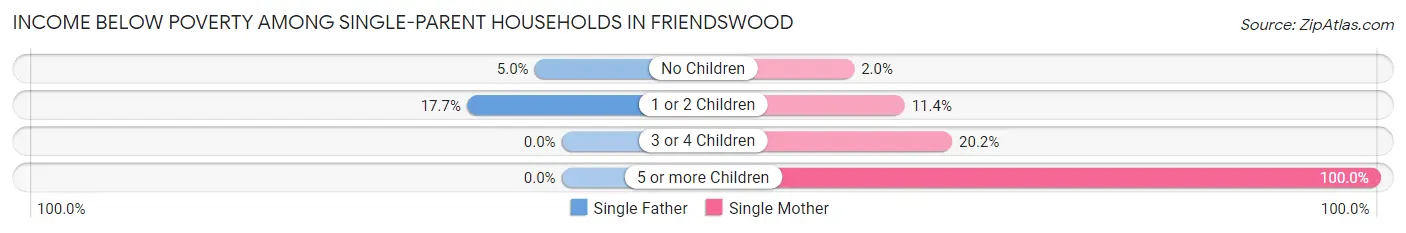
| Children | Single Father | Single Mother |
| No Children | 14 (5.0%) | 8 (2.0%) |
| 1 or 2 Children | 33 (17.6%) | 87 (11.4%) |
| 3 or 4 Children | 0 (0.0%) | 20 (20.2%) |
| 5 or more Children | 0 (0.0%) | 13 (100.0%) |
| Total | 47 (9.6%) | 128 (10.0%) |
Income Below Poverty Among Married-Couple vs Single-Parent Households in Friendswood
The poverty data for Friendswood shows that 70 of the married-couple family households (0.7%) and 175 of the single-parent households (9.9%) are living below the poverty level. Within the married-couple family households, those with 1 or 2 children have the highest poverty rate, with 42 households (1.3%) falling below the poverty line. Among the single-parent households, those with 5 or more children have the highest poverty rate, with 13 household (100.0%) living below poverty.
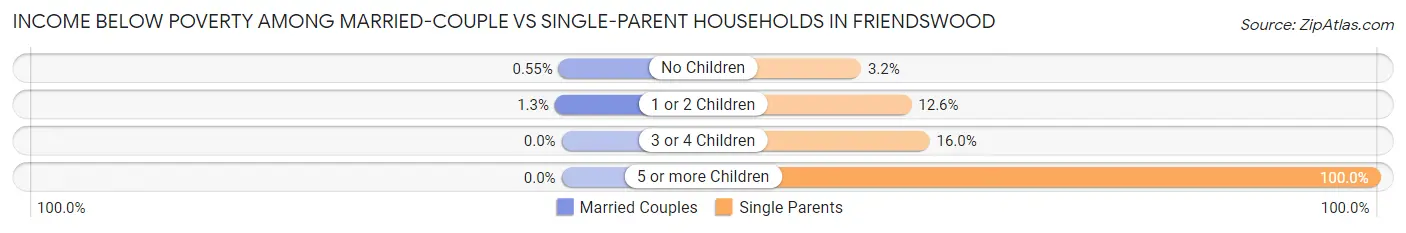
| Children | Married-Couple Families | Single-Parent Households |
| No Children | 28 (0.5%) | 22 (3.2%) |
| 1 or 2 Children | 42 (1.3%) | 120 (12.6%) |
| 3 or 4 Children | 0 (0.0%) | 20 (16.0%) |
| 5 or more Children | 0 (0.0%) | 13 (100.0%) |
| Total | 70 (0.7%) | 175 (9.9%) |
Race in Friendswood
The most populous races in Friendswood are White / Caucasian (32,959 | 80.6%), Hispanic or Latino (6,858 | 16.8%), and Two or more Races (3,132 | 7.7%).
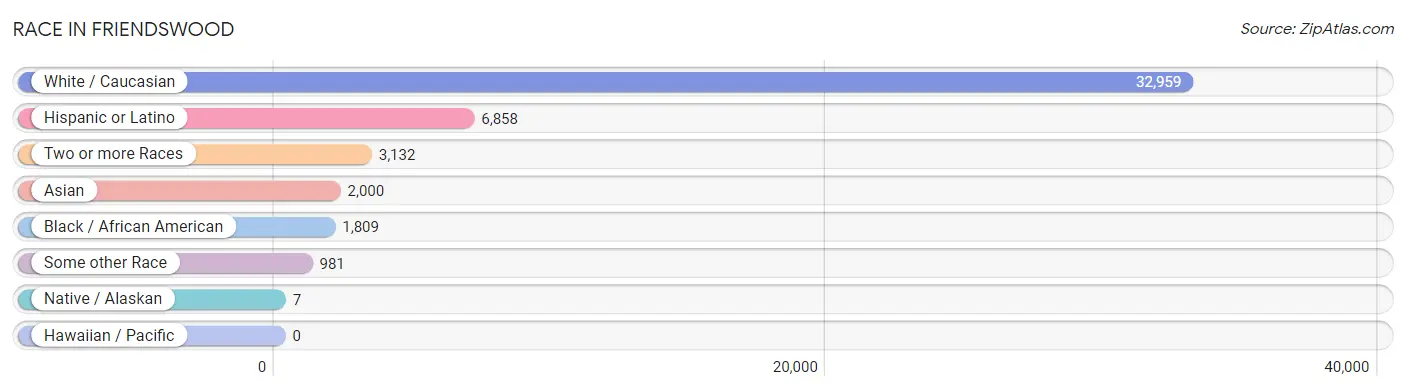
| Race | # Population | % Population |
| Asian | 2,000 | 4.9% |
| Black / African American | 1,809 | 4.4% |
| Hawaiian / Pacific | 0 | 0.0% |
| Hispanic or Latino | 6,858 | 16.8% |
| Native / Alaskan | 7 | 0.0% |
| White / Caucasian | 32,959 | 80.6% |
| Two or more Races | 3,132 | 7.7% |
| Some other Race | 981 | 2.4% |
| Total | 40,888 | 100.0% |
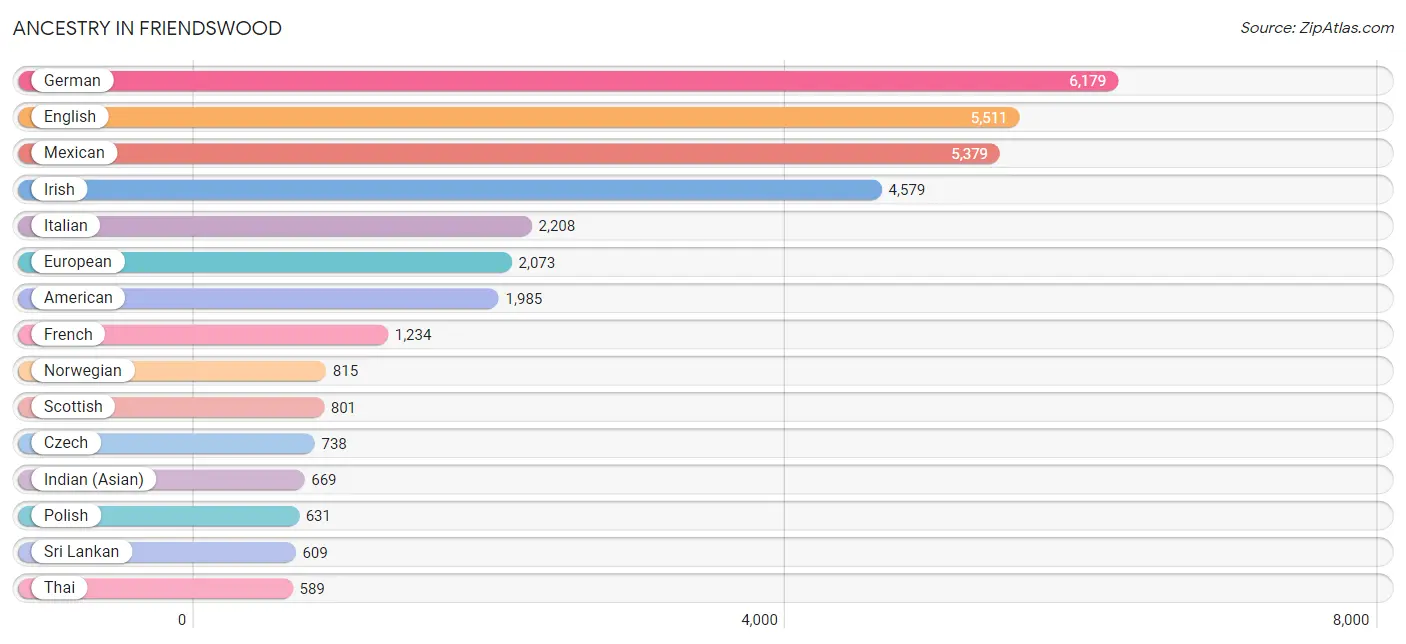
Ancestry in Friendswood
The most populous ancestries reported in Friendswood are German (6,179 | 15.1%), English (5,511 | 13.5%), Mexican (5,379 | 13.2%), Irish (4,579 | 11.2%), and Italian (2,208 | 5.4%), together accounting for 58.4% of all Friendswood residents.
| Ancestry | # Population | % Population |
| African | 132 | 0.3% |
| American | 1,985 | 4.9% |
| Arab | 568 | 1.4% |
| Armenian | 15 | 0.0% |
| Austrian | 82 | 0.2% |
| Belgian | 69 | 0.2% |
| Bhutanese | 99 | 0.2% |
| Blackfeet | 13 | 0.0% |
| Brazilian | 34 | 0.1% |
| British | 285 | 0.7% |
| Burmese | 175 | 0.4% |
| Cajun | 18 | 0.0% |
| Canadian | 87 | 0.2% |
| Central American | 487 | 1.2% |
| Central American Indian | 209 | 0.5% |
| Cherokee | 175 | 0.4% |
| Chickasaw | 1 | 0.0% |
| Choctaw | 19 | 0.1% |
| Colombian | 165 | 0.4% |
| Comanche | 3 | 0.0% |
| Costa Rican | 4 | 0.0% |
| Croatian | 44 | 0.1% |
| Cuban | 41 | 0.1% |
| Cypriot | 2 | 0.0% |
| Czech | 738 | 1.8% |
| Czechoslovakian | 61 | 0.2% |
| Danish | 214 | 0.5% |
| Delaware | 47 | 0.1% |
| Dominican | 71 | 0.2% |
| Dutch | 388 | 0.9% |
| Eastern European | 61 | 0.2% |
| Ecuadorian | 41 | 0.1% |
| Egyptian | 128 | 0.3% |
| English | 5,511 | 13.5% |
| Estonian | 17 | 0.0% |
| European | 2,073 | 5.1% |
| Finnish | 29 | 0.1% |
| French | 1,234 | 3.0% |
| French Canadian | 123 | 0.3% |
| German | 6,179 | 15.1% |
| Greek | 311 | 0.8% |
| Guatemalan | 29 | 0.1% |
| Hungarian | 71 | 0.2% |
| Indian (Asian) | 669 | 1.6% |
| Iranian | 510 | 1.3% |
| Irish | 4,579 | 11.2% |
| Italian | 2,208 | 5.4% |
| Jamaican | 59 | 0.1% |
| Japanese | 12 | 0.0% |
| Kiowa | 10 | 0.0% |
| Korean | 162 | 0.4% |
| Laotian | 37 | 0.1% |
| Lebanese | 120 | 0.3% |
| Lithuanian | 174 | 0.4% |
| Luxembourger | 13 | 0.0% |
| Mexican | 5,379 | 13.2% |
| Moroccan | 19 | 0.1% |
| Native Hawaiian | 85 | 0.2% |
| Nigerian | 45 | 0.1% |
| Northern European | 40 | 0.1% |
| Norwegian | 815 | 2.0% |
| Palestinian | 87 | 0.2% |
| Panamanian | 74 | 0.2% |
| Peruvian | 17 | 0.0% |
| Polish | 631 | 1.5% |
| Portuguese | 45 | 0.1% |
| Puerto Rican | 165 | 0.4% |
| Romanian | 38 | 0.1% |
| Russian | 177 | 0.4% |
| Salvadoran | 380 | 0.9% |
| Samoan | 50 | 0.1% |
| Scandinavian | 153 | 0.4% |
| Scotch-Irish | 346 | 0.9% |
| Scottish | 801 | 2.0% |
| Slovak | 73 | 0.2% |
| Slovene | 44 | 0.1% |
| South American | 333 | 0.8% |
| Spaniard | 62 | 0.2% |
| Spanish | 58 | 0.1% |
| Sri Lankan | 609 | 1.5% |
| Subsaharan African | 177 | 0.4% |
| Swedish | 421 | 1.0% |
| Swiss | 46 | 0.1% |
| Thai | 589 | 1.4% |
| Trinidadian and Tobagonian | 15 | 0.0% |
| Venezuelan | 110 | 0.3% |
| Welsh | 250 | 0.6% |
| West Indian | 6 | 0.0% |
| Yugoslavian | 29 | 0.1% | View All 89 Rows |
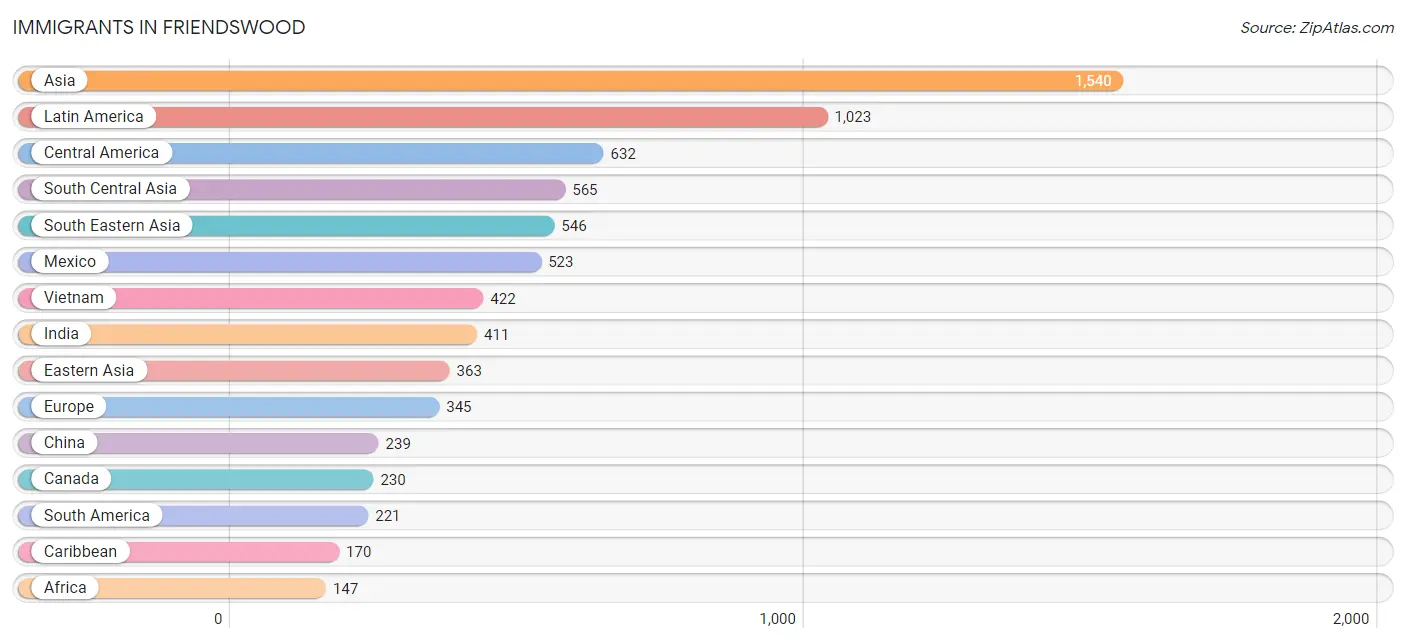
Immigrants in Friendswood
The most numerous immigrant groups reported in Friendswood came from Asia (1,540 | 3.8%), Latin America (1,023 | 2.5%), Central America (632 | 1.5%), South Central Asia (565 | 1.4%), and South Eastern Asia (546 | 1.3%), together accounting for 10.5% of all Friendswood residents.
| Immigration Origin | # Population | % Population |
| Africa | 147 | 0.4% |
| Asia | 1,540 | 3.8% |
| Belgium | 15 | 0.0% |
| Brazil | 16 | 0.0% |
| Cambodia | 26 | 0.1% |
| Canada | 230 | 0.6% |
| Caribbean | 170 | 0.4% |
| Central America | 632 | 1.5% |
| China | 239 | 0.6% |
| Colombia | 113 | 0.3% |
| Costa Rica | 4 | 0.0% |
| Cuba | 25 | 0.1% |
| Dominican Republic | 71 | 0.2% |
| Eastern Africa | 24 | 0.1% |
| Eastern Asia | 363 | 0.9% |
| Eastern Europe | 80 | 0.2% |
| Ecuador | 41 | 0.1% |
| Egypt | 78 | 0.2% |
| El Salvador | 77 | 0.2% |
| Europe | 345 | 0.8% |
| France | 59 | 0.1% |
| Germany | 9 | 0.0% |
| Greece | 42 | 0.1% |
| Hungary | 18 | 0.0% |
| India | 411 | 1.0% |
| Indonesia | 14 | 0.0% |
| Iran | 146 | 0.4% |
| Ireland | 13 | 0.0% |
| Italy | 30 | 0.1% |
| Jamaica | 59 | 0.1% |
| Japan | 44 | 0.1% |
| Korea | 80 | 0.2% |
| Latin America | 1,023 | 2.5% |
| Malaysia | 8 | 0.0% |
| Mexico | 523 | 1.3% |
| Netherlands | 8 | 0.0% |
| Nigeria | 45 | 0.1% |
| Northern Africa | 78 | 0.2% |
| Northern Europe | 102 | 0.3% |
| Pakistan | 8 | 0.0% |
| Panama | 28 | 0.1% |
| Philippines | 76 | 0.2% |
| Russia | 62 | 0.2% |
| Scotland | 14 | 0.0% |
| South America | 221 | 0.5% |
| South Central Asia | 565 | 1.4% |
| South Eastern Asia | 546 | 1.3% |
| Southern Europe | 72 | 0.2% |
| Syria | 28 | 0.1% |
| Taiwan | 13 | 0.0% |
| Trinidad and Tobago | 15 | 0.0% |
| Venezuela | 51 | 0.1% |
| Vietnam | 422 | 1.0% |
| Western Africa | 45 | 0.1% |
| Western Asia | 28 | 0.1% |
| Western Europe | 91 | 0.2% |
| Zimbabwe | 24 | 0.1% | View All 57 Rows |
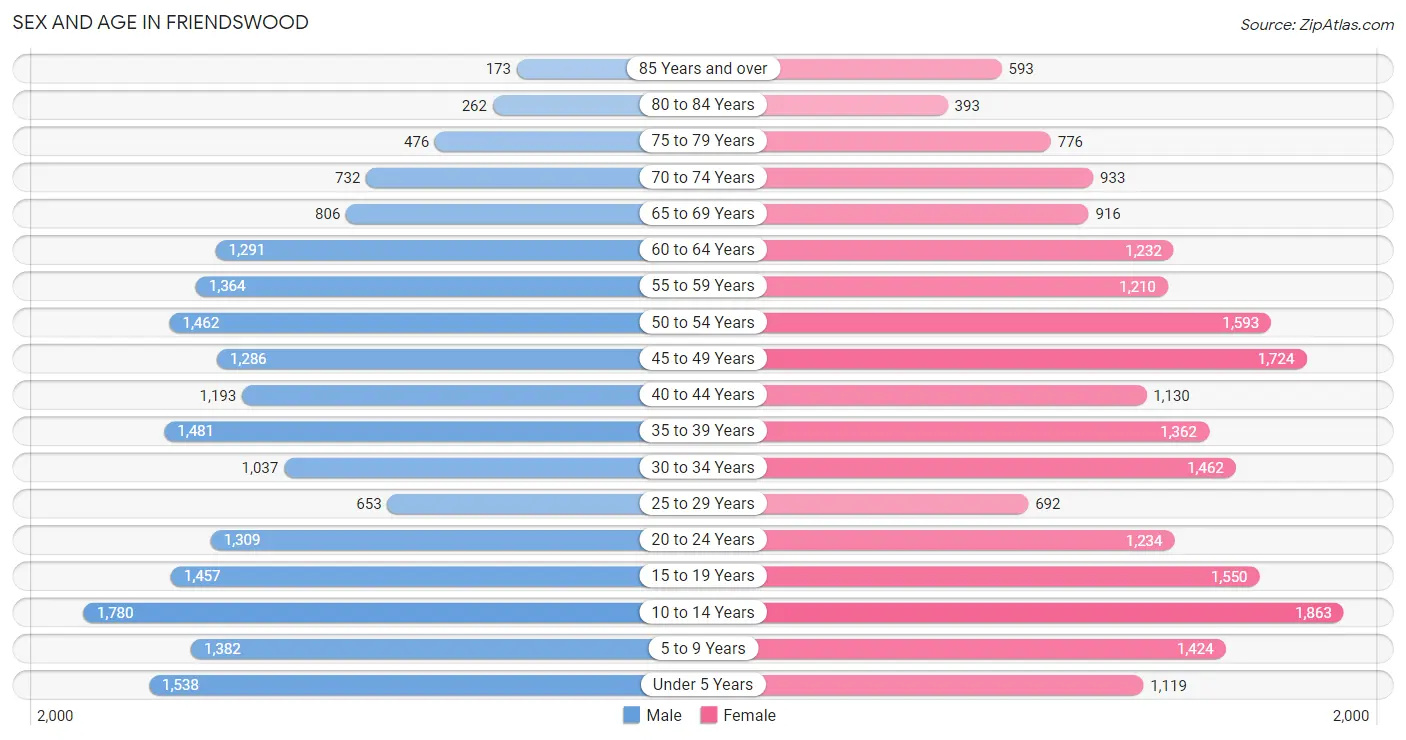
Sex and Age in Friendswood
Sex and Age in Friendswood
The most populous age groups in Friendswood are 10 to 14 Years (1,780 | 9.0%) for men and 10 to 14 Years (1,863 | 8.8%) for women.
| Age Bracket | Male | Female |
| Under 5 Years | 1,538 (7.8%) | 1,119 (5.3%) |
| 5 to 9 Years | 1,382 (7.0%) | 1,424 (6.7%) |
| 10 to 14 Years | 1,780 (9.0%) | 1,863 (8.8%) |
| 15 to 19 Years | 1,457 (7.4%) | 1,550 (7.3%) |
| 20 to 24 Years | 1,309 (6.7%) | 1,234 (5.8%) |
| 25 to 29 Years | 653 (3.3%) | 692 (3.3%) |
| 30 to 34 Years | 1,037 (5.3%) | 1,462 (6.9%) |
| 35 to 39 Years | 1,481 (7.5%) | 1,362 (6.4%) |
| 40 to 44 Years | 1,193 (6.1%) | 1,130 (5.3%) |
| 45 to 49 Years | 1,286 (6.5%) | 1,724 (8.1%) |
| 50 to 54 Years | 1,462 (7.4%) | 1,593 (7.5%) |
| 55 to 59 Years | 1,364 (6.9%) | 1,210 (5.7%) |
| 60 to 64 Years | 1,291 (6.6%) | 1,232 (5.8%) |
| 65 to 69 Years | 806 (4.1%) | 916 (4.3%) |
| 70 to 74 Years | 732 (3.7%) | 933 (4.4%) |
| 75 to 79 Years | 476 (2.4%) | 776 (3.7%) |
| 80 to 84 Years | 262 (1.3%) | 393 (1.8%) |
| 85 Years and over | 173 (0.9%) | 593 (2.8%) |
| Total | 19,682 (100.0%) | 21,206 (100.0%) |
Families and Households in Friendswood
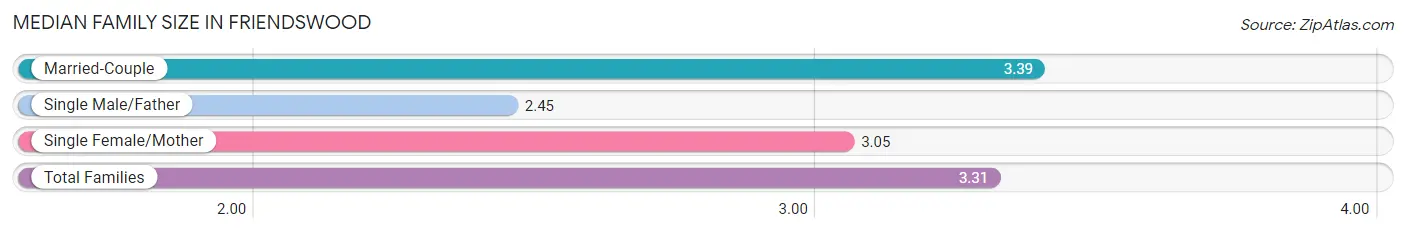
Median Family Size in Friendswood
The median family size in Friendswood is 3.31 persons per family, with married-couple families (9,295 | 84.0%) accounting for the largest median family size of 3.39 persons per family. On the other hand, single male/father families (491 | 4.4%) represent the smallest median family size with 2.45 persons per family.
| Family Type | # Families | Family Size |
| Married-Couple | 9,295 (84.0%) | 3.39 |
| Single Male/Father | 491 (4.4%) | 2.45 |
| Single Female/Mother | 1,283 (11.6%) | 3.05 |
| Total Families | 11,069 (100.0%) | 3.31 |
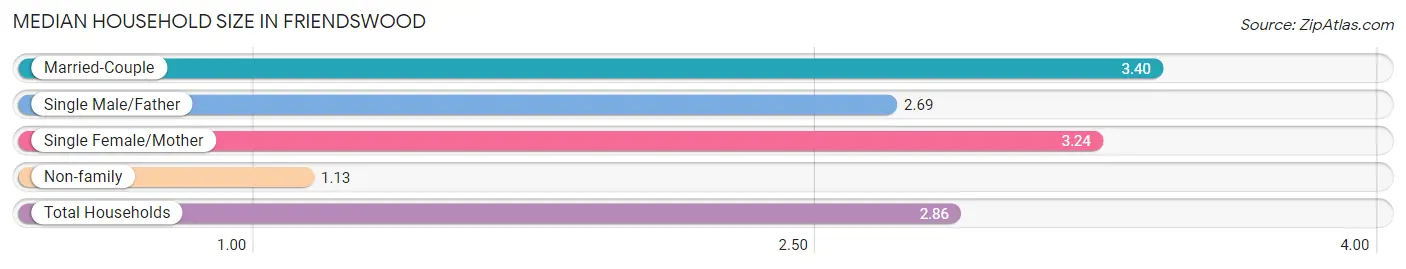
Median Household Size in Friendswood
The median household size in Friendswood is 2.86 persons per household, with married-couple households (9,295 | 65.4%) accounting for the largest median household size of 3.4 persons per household. non-family households (3,132 | 22.1%) represent the smallest median household size with 1.13 persons per household.
| Household Type | # Households | Household Size |
| Married-Couple | 9,295 (65.4%) | 3.40 |
| Single Male/Father | 491 (3.5%) | 2.69 |
| Single Female/Mother | 1,283 (9.0%) | 3.24 |
| Non-family | 3,132 (22.1%) | 1.13 |
| Total Households | 14,201 (100.0%) | 2.86 |
Household Size by Marriage Status in Friendswood
Out of a total of 14,201 households in Friendswood, 11,069 (77.9%) are family households, while 3,132 (22.1%) are nonfamily households. The most numerous type of family households are 2-person households, comprising 4,104, and the most common type of nonfamily households are 1-person households, comprising 2,814.
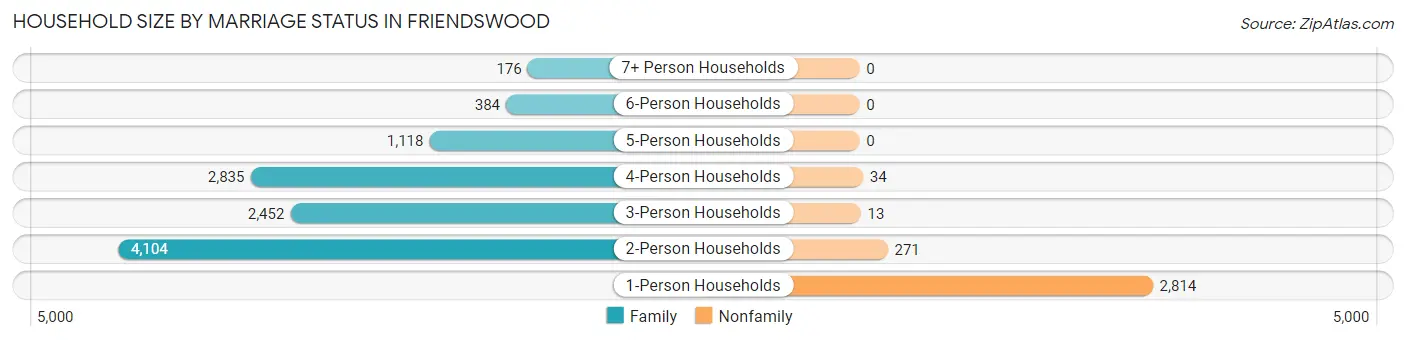
| Household Size | Family Households | Nonfamily Households |
| 1-Person Households | - | 2,814 (19.8%) |
| 2-Person Households | 4,104 (28.9%) | 271 (1.9%) |
| 3-Person Households | 2,452 (17.3%) | 13 (0.1%) |
| 4-Person Households | 2,835 (20.0%) | 34 (0.2%) |
| 5-Person Households | 1,118 (7.9%) | 0 (0.0%) |
| 6-Person Households | 384 (2.7%) | 0 (0.0%) |
| 7+ Person Households | 176 (1.2%) | 0 (0.0%) |
| Total | 11,069 (77.9%) | 3,132 (22.1%) |
Female Fertility in Friendswood
Fertility by Age in Friendswood
Average fertility rate in Friendswood is 32.0 births per 1,000 women. Women in the age bracket of 20 to 34 years have the highest fertility rate with 51.0 births per 1,000 women. Women in the age bracket of 20 to 34 years acount for 58.5% of all women with births.
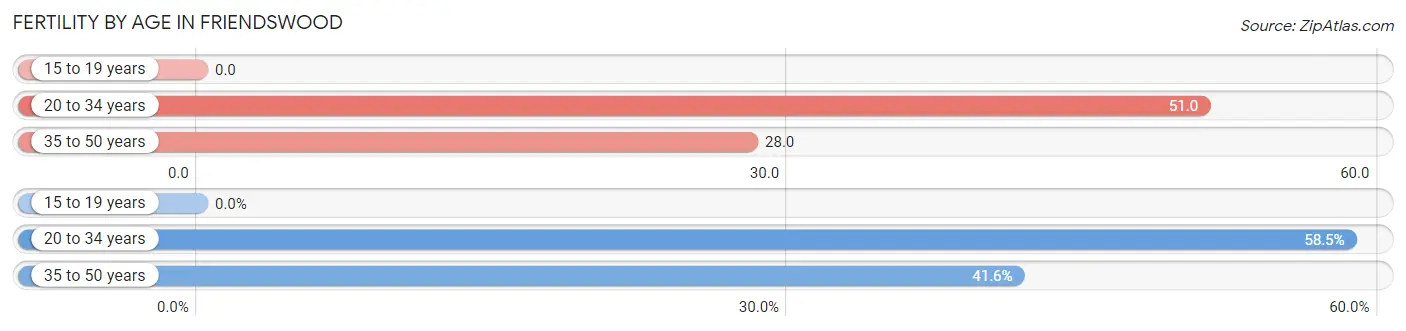
| Age Bracket | Women with Births | Births / 1,000 Women |
| 15 to 19 years | 0 (0.0%) | 0.0 |
| 20 to 34 years | 173 (58.5%) | 51.0 |
| 35 to 50 years | 123 (41.5%) | 28.0 |
| Total | 296 (100.0%) | 32.0 |
Fertility by Age by Marriage Status in Friendswood
90.9% of women with births (296) in Friendswood are married. The highest percentage of unmarried women with births falls into 20 to 34 years age bracket with 15.6% of them unmarried at the time of birth, while the lowest percentage of unmarried women with births belong to 35 to 50 years age bracket with 0.0% of them unmarried.
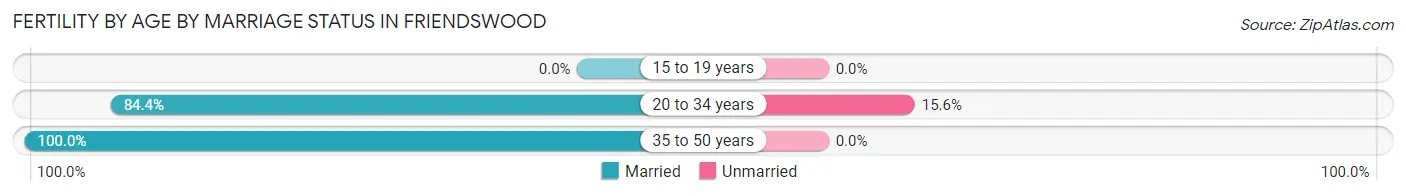
| Age Bracket | Married | Unmarried |
| 15 to 19 years | 0 (0.0%) | 0 (0.0%) |
| 20 to 34 years | 146 (84.4%) | 27 (15.6%) |
| 35 to 50 years | 123 (100.0%) | 0 (0.0%) |
| Total | 269 (90.9%) | 27 (9.1%) |
Fertility by Education in Friendswood
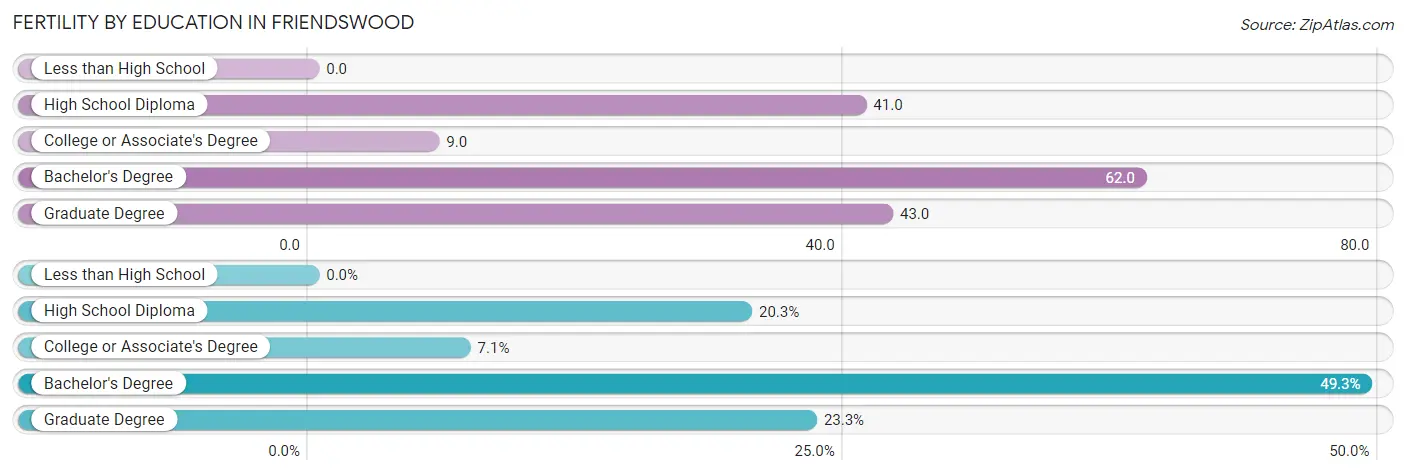
| Educational Attainment | Women with Births | Births / 1,000 Women |
| Less than High School | 0 (0.0%) | 0.0 |
| High School Diploma | 60 (20.3%) | 41.0 |
| College or Associate's Degree | 21 (7.1%) | 9.0 |
| Bachelor's Degree | 146 (49.3%) | 62.0 |
| Graduate Degree | 69 (23.3%) | 43.0 |
| Total | 296 (100.0%) | 32.0 |
Fertility by Education by Marriage Status in Friendswood
9.1% of women with births in Friendswood are unmarried. Women with the educational attainment of college or associate's degree are most likely to be married with 100.0% of them married at childbirth, while women with the educational attainment of high school diploma are least likely to be married with 45.0% of them unmarried at childbirth.
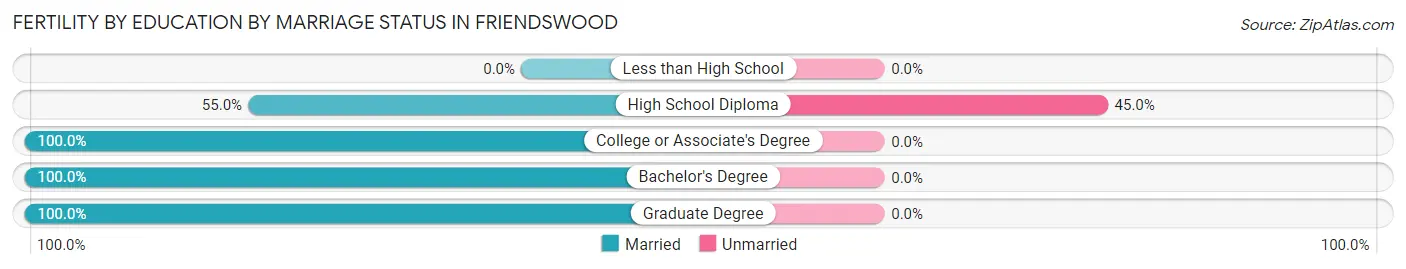
| Educational Attainment | Married | Unmarried |
| Less than High School | 0 (0.0%) | 0 (0.0%) |
| High School Diploma | 33 (55.0%) | 27 (45.0%) |
| College or Associate's Degree | 21 (100.0%) | 0 (0.0%) |
| Bachelor's Degree | 146 (100.0%) | 0 (0.0%) |
| Graduate Degree | 69 (100.0%) | 0 (0.0%) |
| Total | 269 (90.9%) | 27 (9.1%) |
Employment Characteristics in Friendswood
Employment by Class of Employer in Friendswood
Among the 19,437 employed individuals in Friendswood, private company employees (12,622 | 64.9%), local government employees (2,091 | 10.8%), and not-for-profit organizations (1,373 | 7.1%) make up the most common classes of employment.
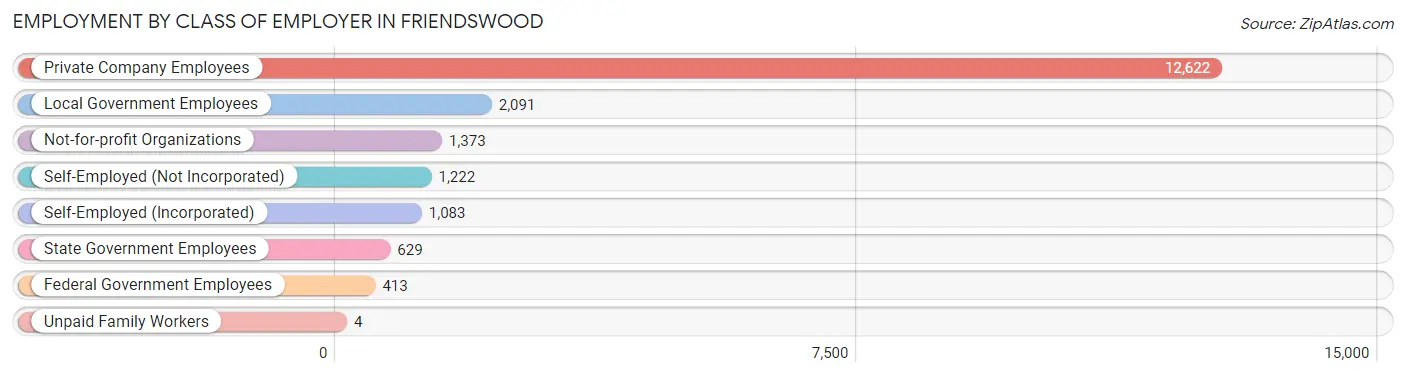
| Employer Class | # Employees | % Employees |
| Private Company Employees | 12,622 | 64.9% |
| Self-Employed (Incorporated) | 1,083 | 5.6% |
| Self-Employed (Not Incorporated) | 1,222 | 6.3% |
| Not-for-profit Organizations | 1,373 | 7.1% |
| Local Government Employees | 2,091 | 10.8% |
| State Government Employees | 629 | 3.2% |
| Federal Government Employees | 413 | 2.1% |
| Unpaid Family Workers | 4 | 0.0% |
| Total | 19,437 | 100.0% |
Employment Status by Age in Friendswood
According to the labor force statistics for Friendswood, out of the total population over 16 years of age (31,209), 65.7% or 20,504 individuals are in the labor force, with 4.6% or 943 of them unemployed. The age group with the highest labor force participation rate is 45 to 54 years, with 86.3% or 5,234 individuals in the labor force. Within the labor force, the 16 to 19 years age range has the highest percentage of unemployed individuals, with 15.1% or 135 of them being unemployed.
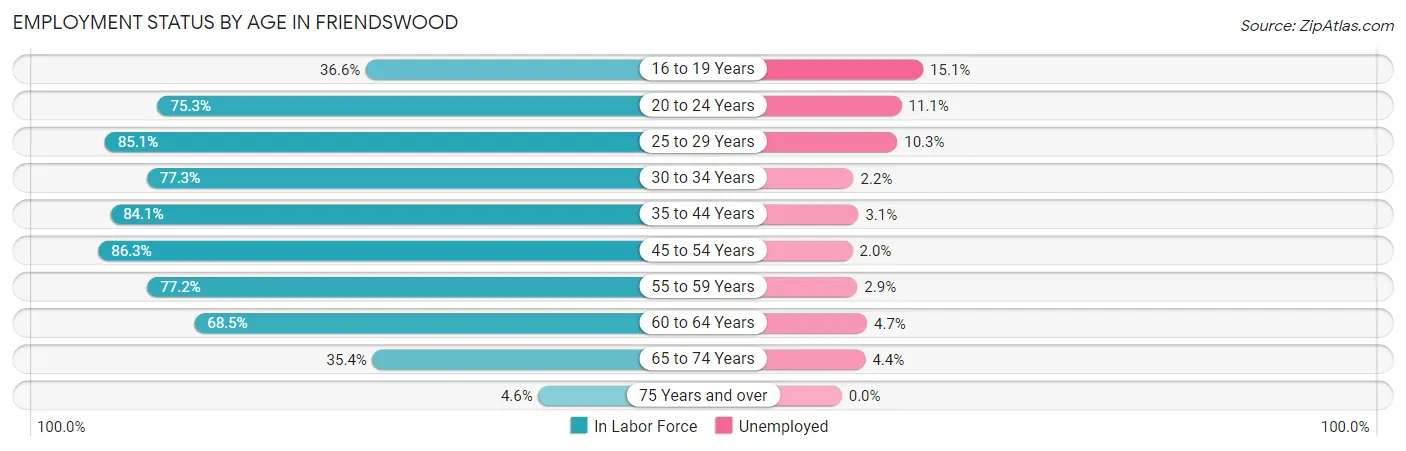
| Age Bracket | In Labor Force | Unemployed |
| 16 to 19 Years | 891 (36.6%) | 135 (15.1%) |
| 20 to 24 Years | 1,915 (75.3%) | 213 (11.1%) |
| 25 to 29 Years | 1,145 (85.1%) | 118 (10.3%) |
| 30 to 34 Years | 1,932 (77.3%) | 43 (2.2%) |
| 35 to 44 Years | 4,345 (84.1%) | 135 (3.1%) |
| 45 to 54 Years | 5,234 (86.3%) | 105 (2.0%) |
| 55 to 59 Years | 1,987 (77.2%) | 58 (2.9%) |
| 60 to 64 Years | 1,728 (68.5%) | 81 (4.7%) |
| 65 to 74 Years | 1,199 (35.4%) | 53 (4.4%) |
| 75 Years and over | 123 (4.6%) | 0 (0.0%) |
| Total | 20,504 (65.7%) | 943 (4.6%) |
Employment Status by Educational Attainment in Friendswood
According to labor force statistics for Friendswood, 81.1% of individuals (16,359) out of the total population between 25 and 64 years of age (20,172) are in the labor force, with 3.3% or 540 of them being unemployed. The group with the highest labor force participation rate are those with the educational attainment of bachelor's degree or higher, with 86.2% or 8,836 individuals in the labor force. Within the labor force, individuals with high school diploma education have the highest percentage of unemployment, with 8.5% or 179 of them being unemployed.
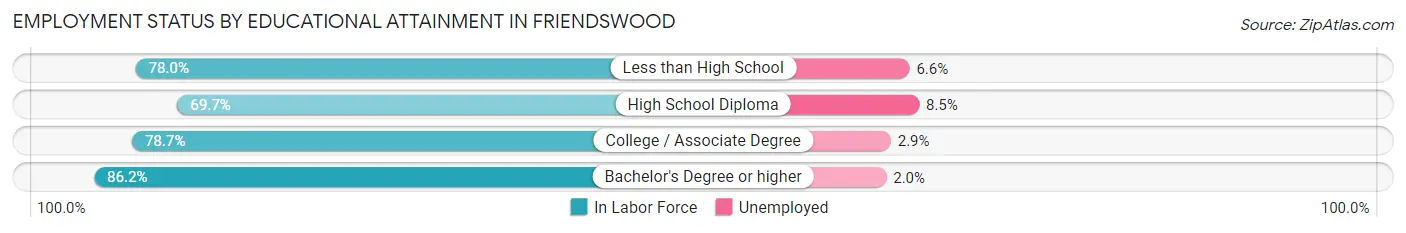
| Educational Attainment | In Labor Force | Unemployed |
| Less than High School | 573 (78.0%) | 49 (6.6%) |
| High School Diploma | 2,105 (69.7%) | 257 (8.5%) |
| College / Associate Degree | 4,853 (78.7%) | 179 (2.9%) |
| Bachelor's Degree or higher | 8,836 (86.2%) | 205 (2.0%) |
| Total | 16,359 (81.1%) | 666 (3.3%) |
Employment Occupations by Sex in Friendswood
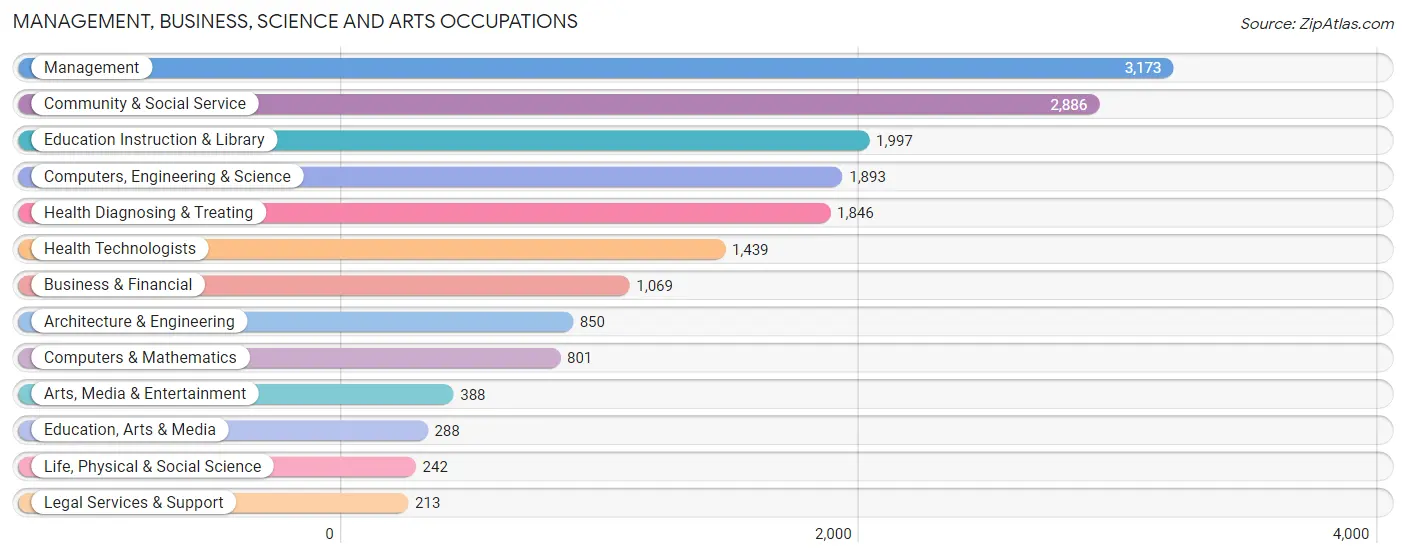
Management, Business, Science and Arts Occupations
The most common Management, Business, Science and Arts occupations in Friendswood are Management (3,173 | 16.3%), Community & Social Service (2,886 | 14.8%), Education Instruction & Library (1,997 | 10.2%), Computers, Engineering & Science (1,893 | 9.7%), and Health Diagnosing & Treating (1,846 | 9.5%).
Management, Business, Science and Arts Occupations by Sex
Within the Management, Business, Science and Arts occupations in Friendswood, the most male-oriented occupations are Architecture & Engineering (81.5%), Life, Physical & Social Science (79.3%), and Computers, Engineering & Science (77.6%), while the most female-oriented occupations are Health Technologists (70.0%), Health Diagnosing & Treating (68.3%), and Education Instruction & Library (64.3%).
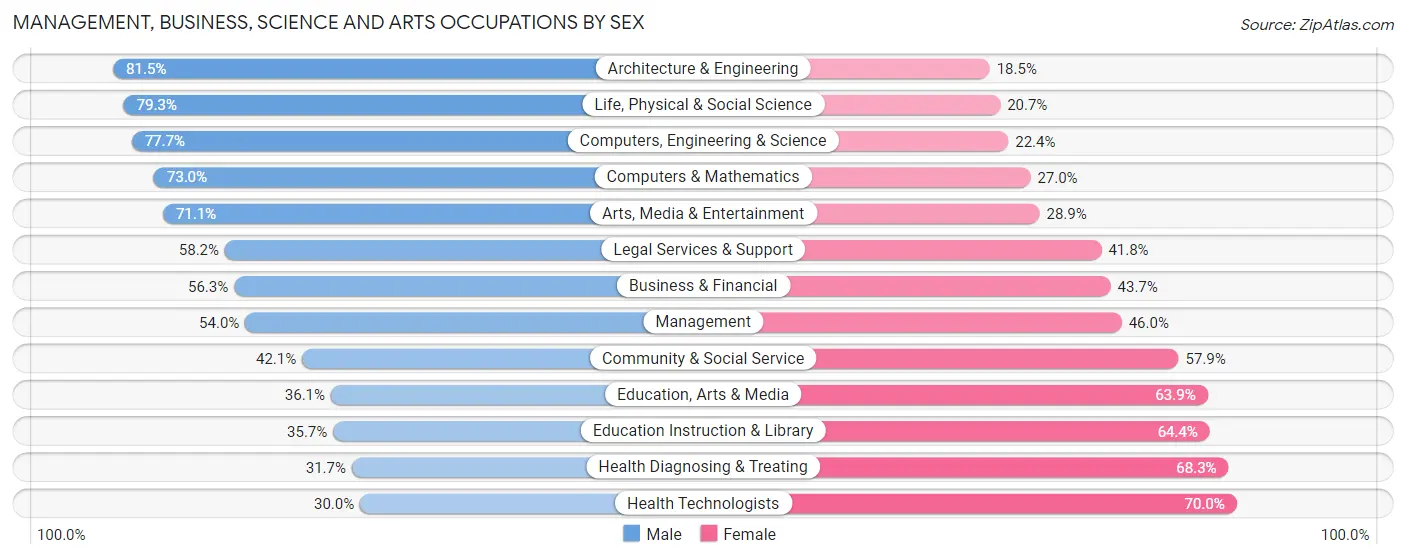
| Occupation | Male | Female |
| Management | 1,713 (54.0%) | 1,460 (46.0%) |
| Business & Financial | 602 (56.3%) | 467 (43.7%) |
| Computers, Engineering & Science | 1,470 (77.6%) | 423 (22.4%) |
| Computers & Mathematics | 585 (73.0%) | 216 (27.0%) |
| Architecture & Engineering | 693 (81.5%) | 157 (18.5%) |
| Life, Physical & Social Science | 192 (79.3%) | 50 (20.7%) |
| Community & Social Service | 1,216 (42.1%) | 1,670 (57.9%) |
| Education, Arts & Media | 104 (36.1%) | 184 (63.9%) |
| Legal Services & Support | 124 (58.2%) | 89 (41.8%) |
| Education Instruction & Library | 712 (35.6%) | 1,285 (64.3%) |
| Arts, Media & Entertainment | 276 (71.1%) | 112 (28.9%) |
| Health Diagnosing & Treating | 586 (31.7%) | 1,260 (68.3%) |
| Health Technologists | 432 (30.0%) | 1,007 (70.0%) |
| Total (Category) | 5,587 (51.4%) | 5,280 (48.6%) |
| Total (Overall) | 10,697 (54.8%) | 8,830 (45.2%) |
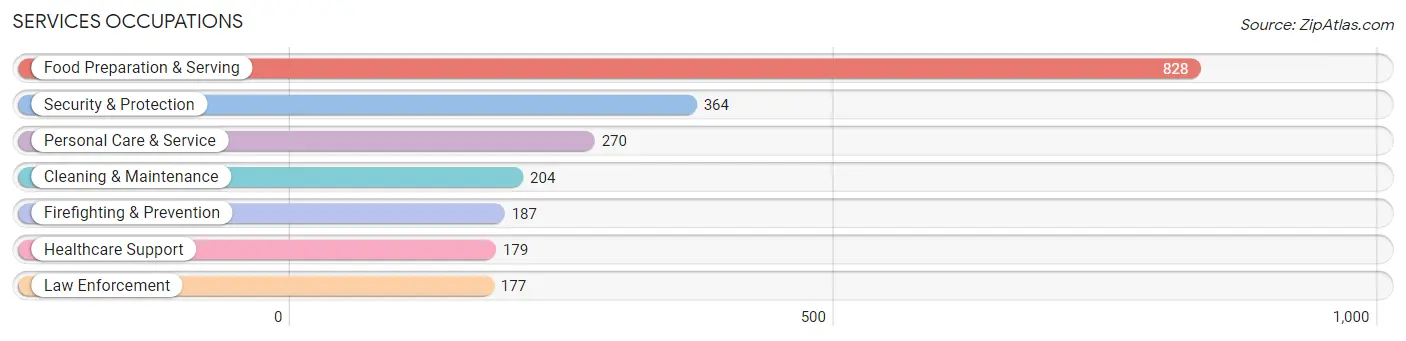
Services Occupations
The most common Services occupations in Friendswood are Food Preparation & Serving (828 | 4.2%), Security & Protection (364 | 1.9%), Personal Care & Service (270 | 1.4%), Cleaning & Maintenance (204 | 1.0%), and Firefighting & Prevention (187 | 1.0%).
Services Occupations by Sex
Within the Services occupations in Friendswood, the most male-oriented occupations are Law Enforcement (100.0%), Security & Protection (83.2%), and Firefighting & Prevention (67.4%), while the most female-oriented occupations are Healthcare Support (85.5%), Personal Care & Service (83.7%), and Food Preparation & Serving (54.0%).
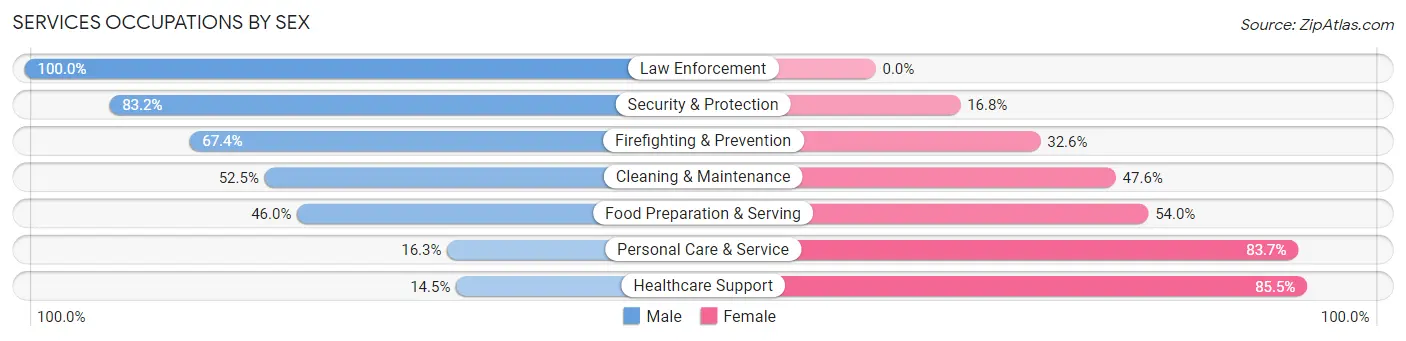
| Occupation | Male | Female |
| Healthcare Support | 26 (14.5%) | 153 (85.5%) |
| Security & Protection | 303 (83.2%) | 61 (16.8%) |
| Firefighting & Prevention | 126 (67.4%) | 61 (32.6%) |
| Law Enforcement | 177 (100.0%) | 0 (0.0%) |
| Food Preparation & Serving | 381 (46.0%) | 447 (54.0%) |
| Cleaning & Maintenance | 107 (52.4%) | 97 (47.5%) |
| Personal Care & Service | 44 (16.3%) | 226 (83.7%) |
| Total (Category) | 861 (46.7%) | 984 (53.3%) |
| Total (Overall) | 10,697 (54.8%) | 8,830 (45.2%) |
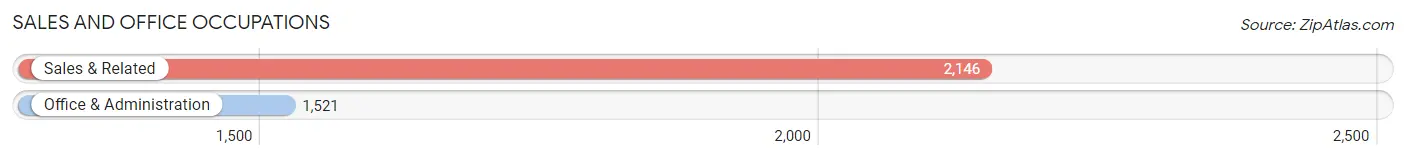
Sales and Office Occupations
The most common Sales and Office occupations in Friendswood are Sales & Related (2,146 | 11.0%), and Office & Administration (1,521 | 7.8%).
Sales and Office Occupations by Sex
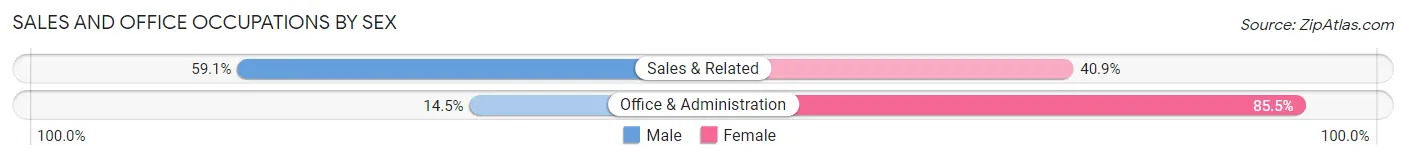
| Occupation | Male | Female |
| Sales & Related | 1,268 (59.1%) | 878 (40.9%) |
| Office & Administration | 220 (14.5%) | 1,301 (85.5%) |
| Total (Category) | 1,488 (40.6%) | 2,179 (59.4%) |
| Total (Overall) | 10,697 (54.8%) | 8,830 (45.2%) |
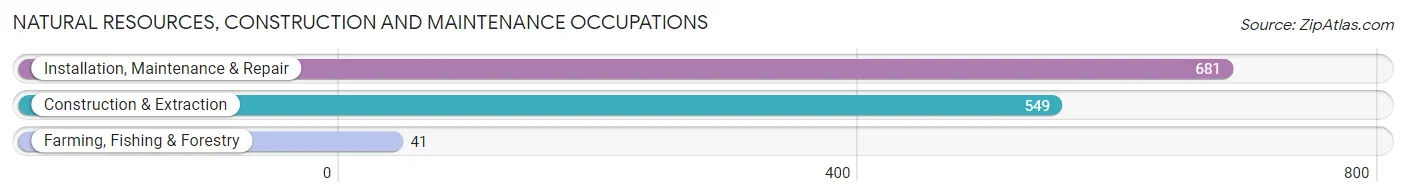
Natural Resources, Construction and Maintenance Occupations
The most common Natural Resources, Construction and Maintenance occupations in Friendswood are Installation, Maintenance & Repair (681 | 3.5%), Construction & Extraction (549 | 2.8%), and Farming, Fishing & Forestry (41 | 0.2%).
Natural Resources, Construction and Maintenance Occupations by Sex
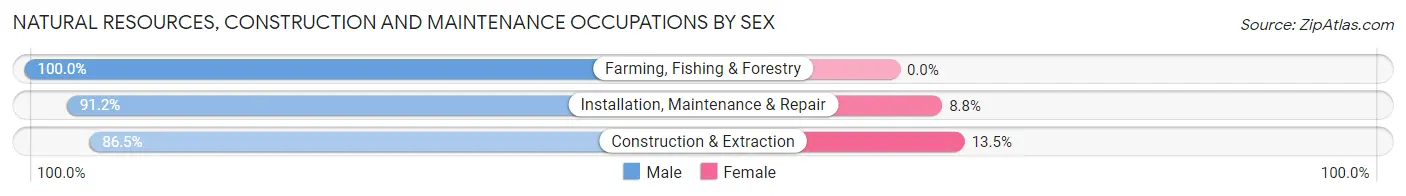
| Occupation | Male | Female |
| Farming, Fishing & Forestry | 41 (100.0%) | 0 (0.0%) |
| Construction & Extraction | 475 (86.5%) | 74 (13.5%) |
| Installation, Maintenance & Repair | 621 (91.2%) | 60 (8.8%) |
| Total (Category) | 1,137 (89.5%) | 134 (10.5%) |
| Total (Overall) | 10,697 (54.8%) | 8,830 (45.2%) |
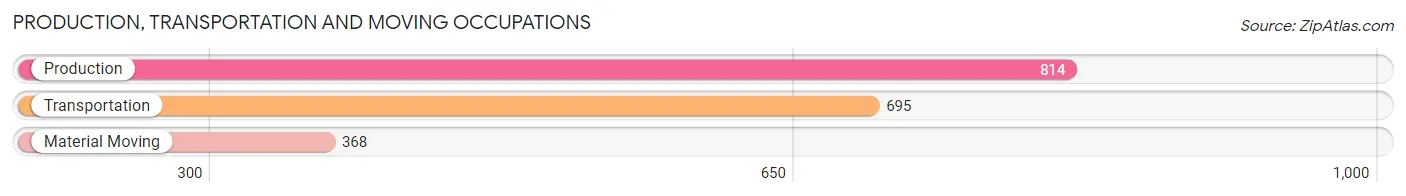
Production, Transportation and Moving Occupations
The most common Production, Transportation and Moving occupations in Friendswood are Production (814 | 4.2%), Transportation (695 | 3.6%), and Material Moving (368 | 1.9%).
Production, Transportation and Moving Occupations by Sex
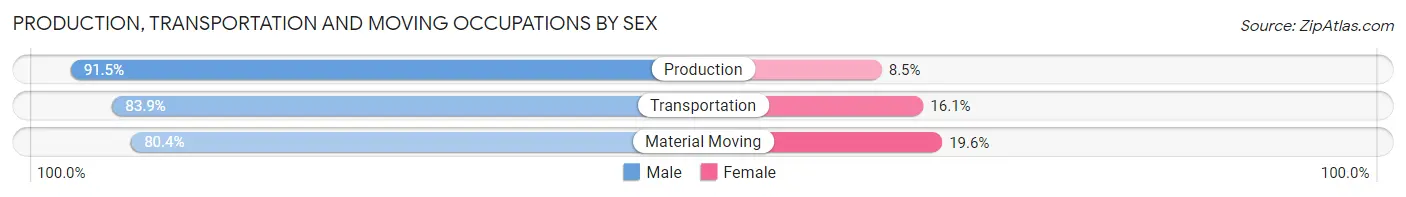
| Occupation | Male | Female |
| Production | 745 (91.5%) | 69 (8.5%) |
| Transportation | 583 (83.9%) | 112 (16.1%) |
| Material Moving | 296 (80.4%) | 72 (19.6%) |
| Total (Category) | 1,624 (86.5%) | 253 (13.5%) |
| Total (Overall) | 10,697 (54.8%) | 8,830 (45.2%) |
Employment Industries by Sex in Friendswood
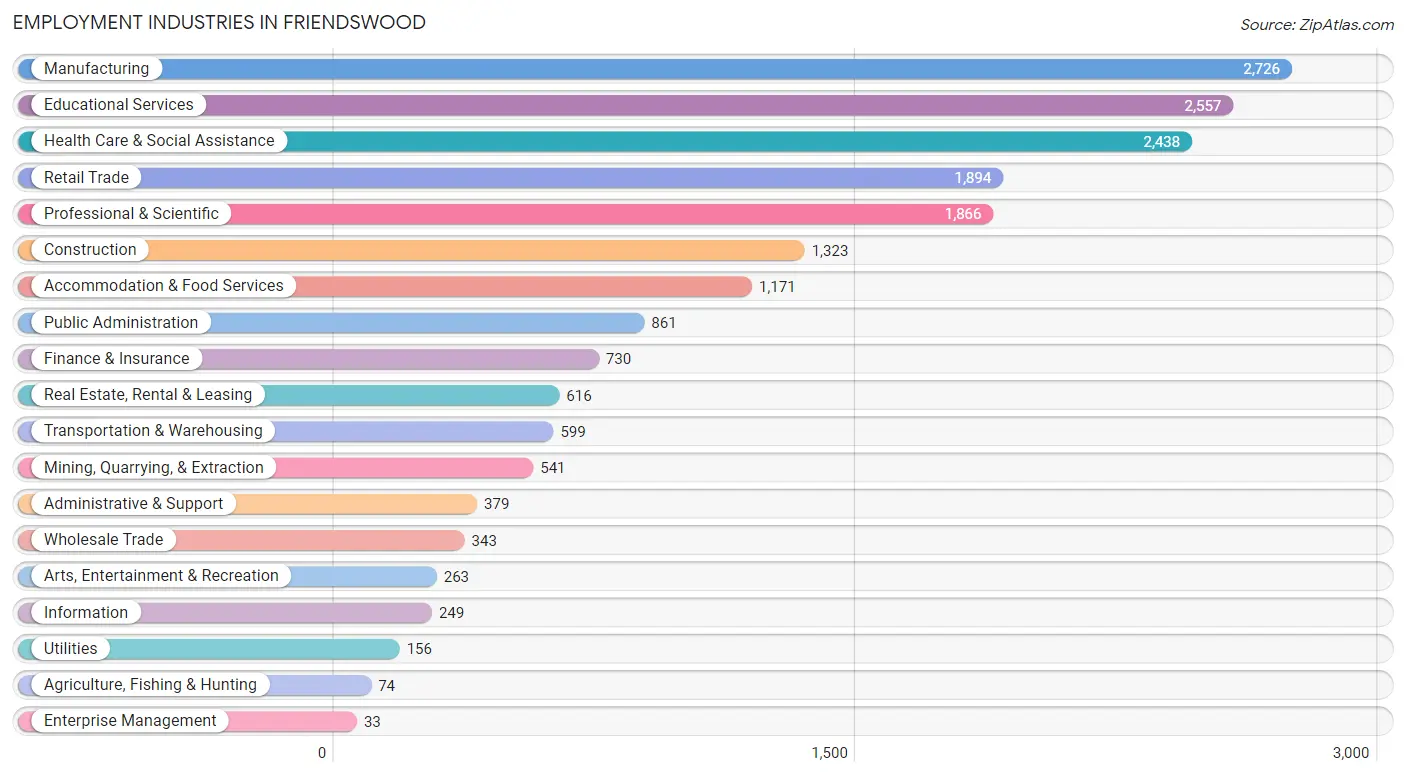
Employment Industries in Friendswood
The major employment industries in Friendswood include Manufacturing (2,726 | 14.0%), Educational Services (2,557 | 13.1%), Health Care & Social Assistance (2,438 | 12.5%), Retail Trade (1,894 | 9.7%), and Professional & Scientific (1,866 | 9.6%).
Employment Industries by Sex in Friendswood
The Friendswood industries that see more men than women are Manufacturing (79.3%), Enterprise Management (78.8%), and Mining, Quarrying, & Extraction (67.3%), whereas the industries that tend to have a higher number of women are Health Care & Social Assistance (69.0%), Educational Services (62.8%), and Administrative & Support (59.6%).
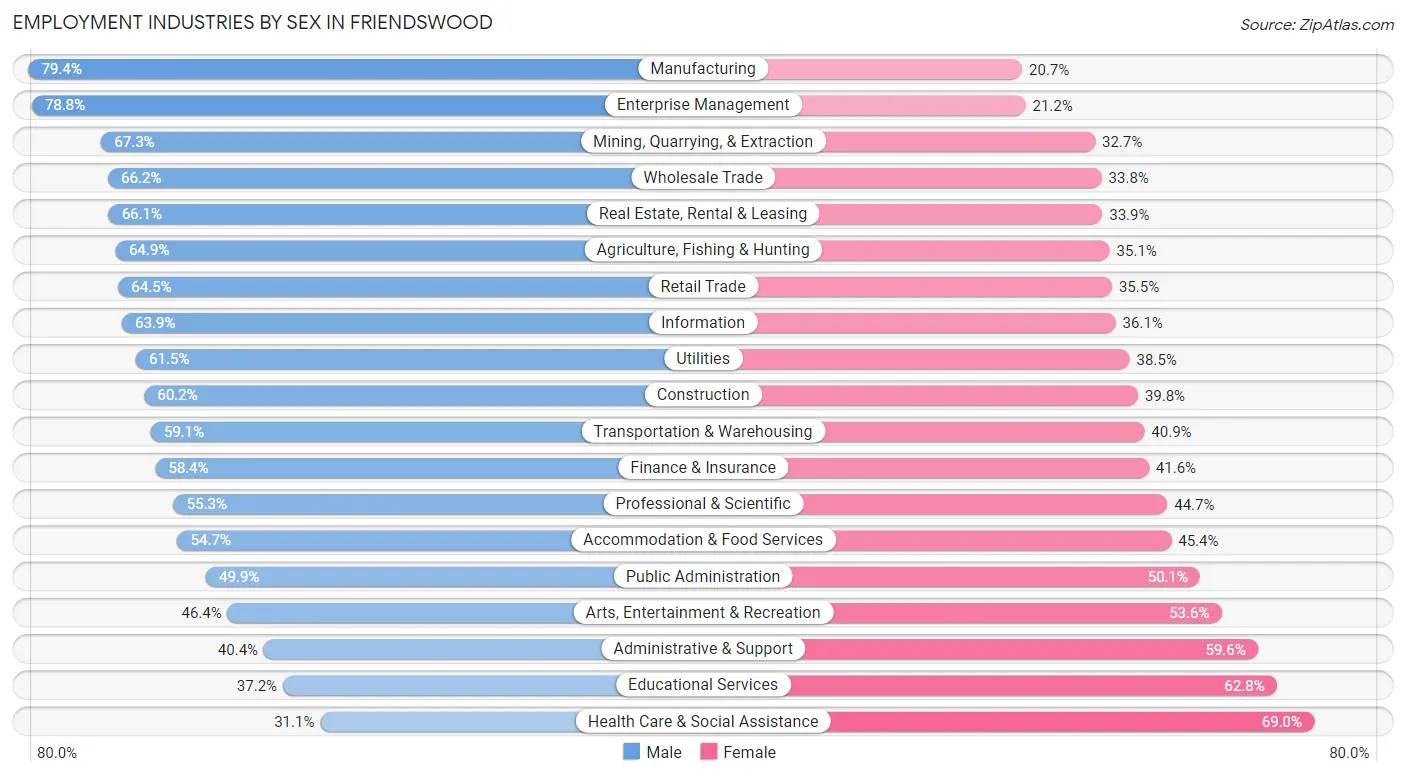
| Industry | Male | Female |
| Agriculture, Fishing & Hunting | 48 (64.9%) | 26 (35.1%) |
| Mining, Quarrying, & Extraction | 364 (67.3%) | 177 (32.7%) |
| Construction | 796 (60.2%) | 527 (39.8%) |
| Manufacturing | 2,163 (79.3%) | 563 (20.6%) |
| Wholesale Trade | 227 (66.2%) | 116 (33.8%) |
| Retail Trade | 1,221 (64.5%) | 673 (35.5%) |
| Transportation & Warehousing | 354 (59.1%) | 245 (40.9%) |
| Utilities | 96 (61.5%) | 60 (38.5%) |
| Information | 159 (63.9%) | 90 (36.1%) |
| Finance & Insurance | 426 (58.4%) | 304 (41.6%) |
| Real Estate, Rental & Leasing | 407 (66.1%) | 209 (33.9%) |
| Professional & Scientific | 1,032 (55.3%) | 834 (44.7%) |
| Enterprise Management | 26 (78.8%) | 7 (21.2%) |
| Administrative & Support | 153 (40.4%) | 226 (59.6%) |
| Educational Services | 952 (37.2%) | 1,605 (62.8%) |
| Health Care & Social Assistance | 757 (31.0%) | 1,681 (69.0%) |
| Arts, Entertainment & Recreation | 122 (46.4%) | 141 (53.6%) |
| Accommodation & Food Services | 640 (54.6%) | 531 (45.4%) |
| Public Administration | 430 (49.9%) | 431 (50.1%) |
| Total | 10,697 (54.8%) | 8,830 (45.2%) |
Education in Friendswood
School Enrollment in Friendswood
The most common levels of schooling among the 12,047 students in Friendswood are high school (3,048 | 25.3%), middle school (2,952 | 24.5%), and elementary school (2,271 | 18.9%).
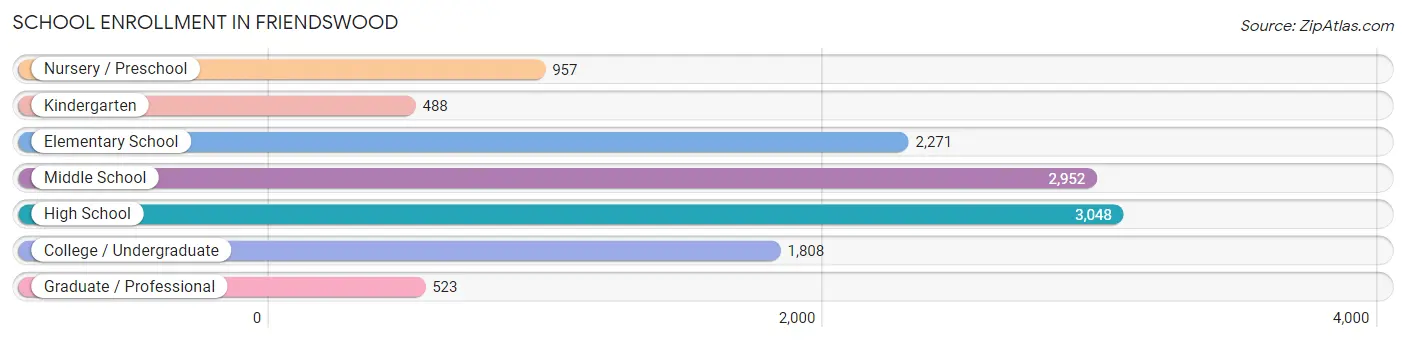
| School Level | # Students | % Students |
| Nursery / Preschool | 957 | 7.9% |
| Kindergarten | 488 | 4.1% |
| Elementary School | 2,271 | 18.9% |
| Middle School | 2,952 | 24.5% |
| High School | 3,048 | 25.3% |
| College / Undergraduate | 1,808 | 15.0% |
| Graduate / Professional | 523 | 4.3% |
| Total | 12,047 | 100.0% |
School Enrollment by Age by Funding Source in Friendswood
Out of a total of 12,047 students who are enrolled in schools in Friendswood, 1,928 (16.0%) attend a private institution, while the remaining 10,119 (84.0%) are enrolled in public schools. The age group of 3 to 4 year olds has the highest likelihood of being enrolled in private schools, with 500 (66.5% in the age bracket) enrolled. Conversely, the age group of 35 years and over has the lowest likelihood of being enrolled in a private school, with 459 (98.5% in the age bracket) attending a public institution.
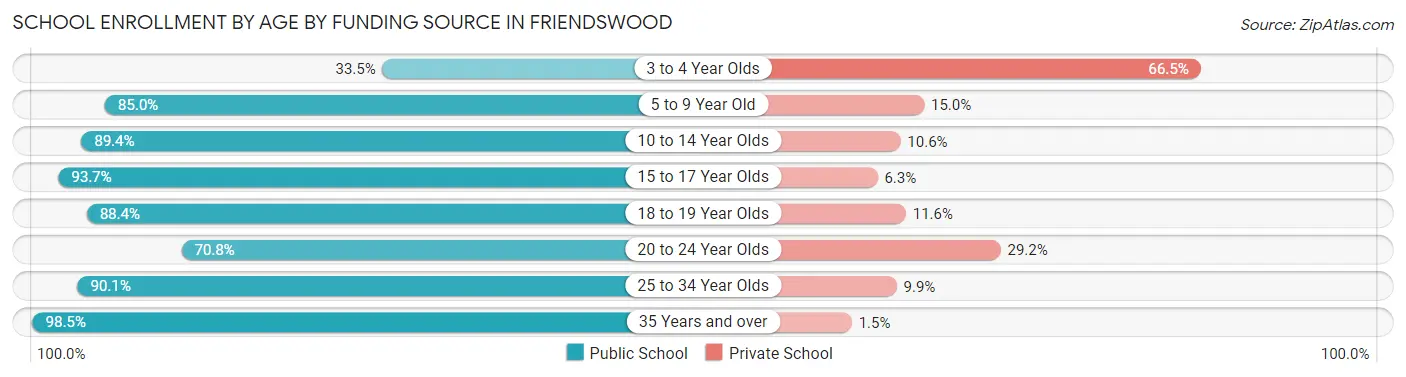
| Age Bracket | Public School | Private School |
| 3 to 4 Year Olds | 252 (33.5%) | 500 (66.5%) |
| 5 to 9 Year Old | 2,312 (85.0%) | 407 (15.0%) |
| 10 to 14 Year Olds | 3,258 (89.4%) | 385 (10.6%) |
| 15 to 17 Year Olds | 1,739 (93.7%) | 117 (6.3%) |
| 18 to 19 Year Olds | 795 (88.4%) | 104 (11.6%) |
| 20 to 24 Year Olds | 867 (70.8%) | 358 (29.2%) |
| 25 to 34 Year Olds | 439 (90.1%) | 48 (9.9%) |
| 35 Years and over | 459 (98.5%) | 7 (1.5%) |
| Total | 10,119 (84.0%) | 1,928 (16.0%) |
Educational Attainment by Field of Study in Friendswood
Business (2,704 | 20.0%), engineering (1,731 | 12.8%), science & technology (1,636 | 12.1%), education (1,532 | 11.3%), and arts & humanities (984 | 7.3%) are the most common fields of study among 13,508 individuals in Friendswood who have obtained a bachelor's degree or higher.
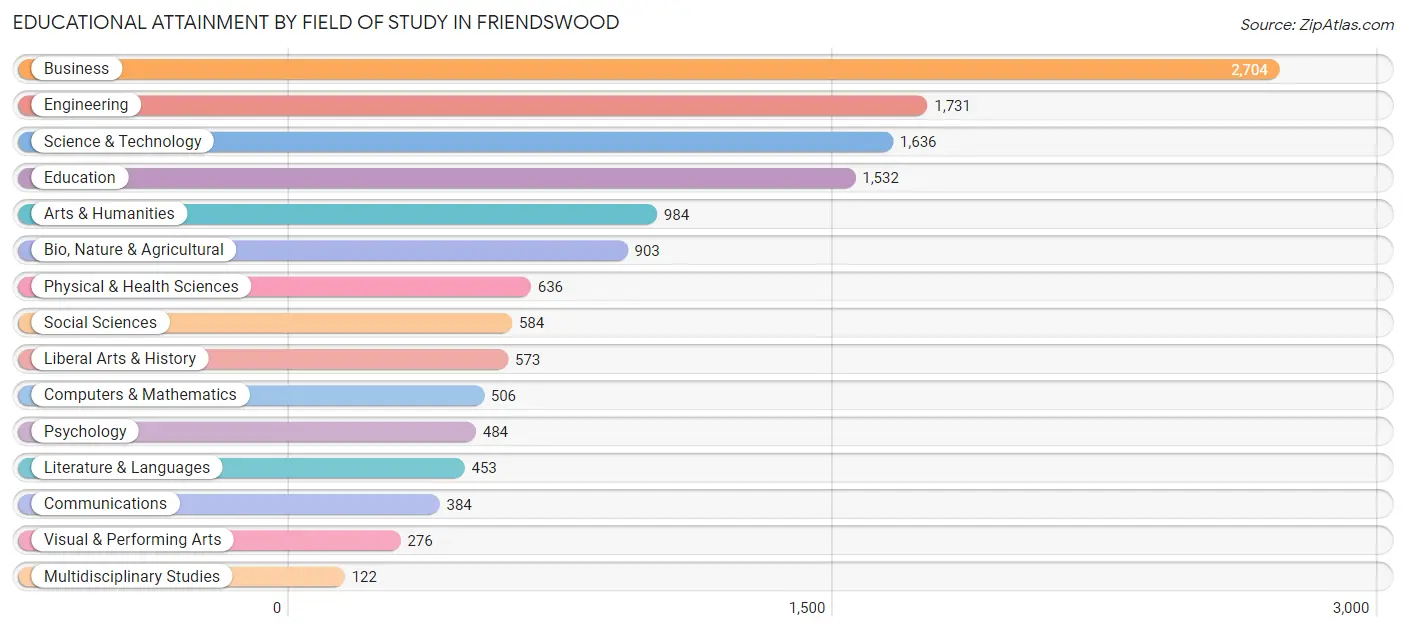
| Field of Study | # Graduates | % Graduates |
| Computers & Mathematics | 506 | 3.7% |
| Bio, Nature & Agricultural | 903 | 6.7% |
| Physical & Health Sciences | 636 | 4.7% |
| Psychology | 484 | 3.6% |
| Social Sciences | 584 | 4.3% |
| Engineering | 1,731 | 12.8% |
| Multidisciplinary Studies | 122 | 0.9% |
| Science & Technology | 1,636 | 12.1% |
| Business | 2,704 | 20.0% |
| Education | 1,532 | 11.3% |
| Literature & Languages | 453 | 3.4% |
| Liberal Arts & History | 573 | 4.2% |
| Visual & Performing Arts | 276 | 2.0% |
| Communications | 384 | 2.8% |
| Arts & Humanities | 984 | 7.3% |
| Total | 13,508 | 100.0% |
Transportation & Commute in Friendswood
Vehicle Availability by Sex in Friendswood
The most prevalent vehicle ownership categories in Friendswood are males with 2 vehicles (5,472, accounting for 51.3%) and females with 2 vehicles (3,927, making up 62.5%).
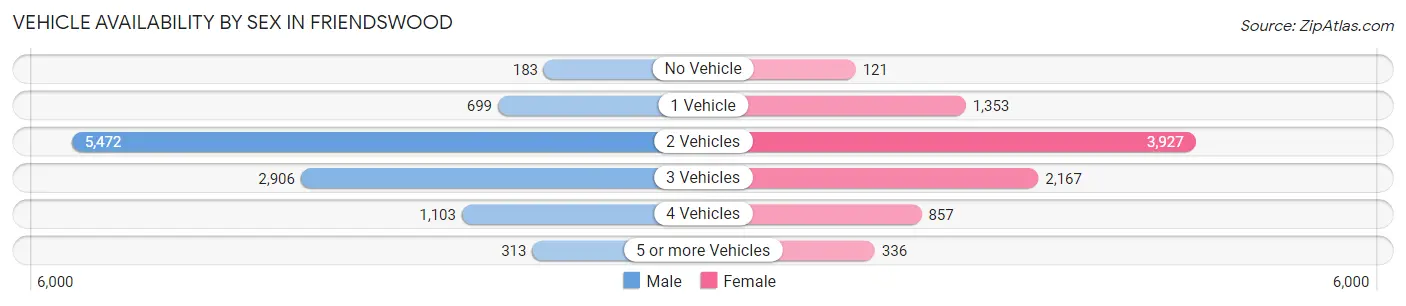
| Vehicles Available | Male | Female |
| No Vehicle | 183 (1.7%) | 121 (1.4%) |
| 1 Vehicle | 699 (6.6%) | 1,353 (15.4%) |
| 2 Vehicles | 5,472 (51.3%) | 3,927 (44.8%) |
| 3 Vehicles | 2,906 (27.2%) | 2,167 (24.7%) |
| 4 Vehicles | 1,103 (10.3%) | 857 (9.8%) |
| 5 or more Vehicles | 313 (2.9%) | 336 (3.8%) |
| Total | 10,676 (100.0%) | 8,761 (100.0%) |
Commute Time in Friendswood
The most frequently occuring commute durations in Friendswood are 15 to 19 minutes (2,750 commuters, 16.5%), 20 to 24 minutes (2,442 commuters, 14.6%), and 30 to 34 minutes (2,358 commuters, 14.1%).
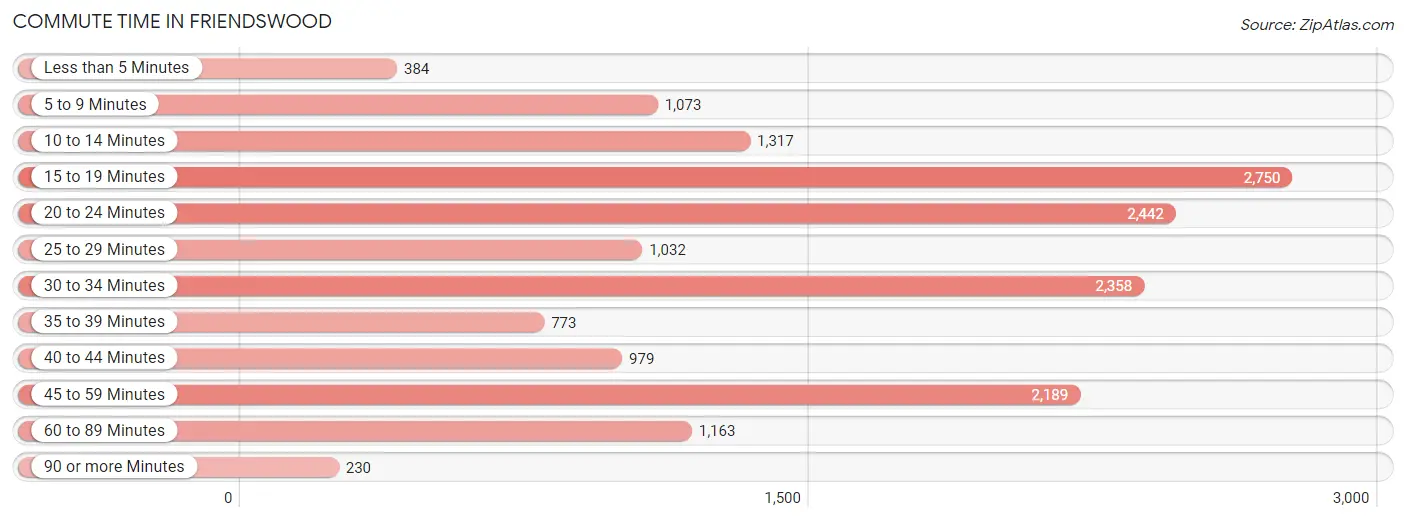
| Commute Time | # Commuters | % Commuters |
| Less than 5 Minutes | 384 | 2.3% |
| 5 to 9 Minutes | 1,073 | 6.4% |
| 10 to 14 Minutes | 1,317 | 7.9% |
| 15 to 19 Minutes | 2,750 | 16.5% |
| 20 to 24 Minutes | 2,442 | 14.6% |
| 25 to 29 Minutes | 1,032 | 6.2% |
| 30 to 34 Minutes | 2,358 | 14.1% |
| 35 to 39 Minutes | 773 | 4.6% |
| 40 to 44 Minutes | 979 | 5.9% |
| 45 to 59 Minutes | 2,189 | 13.1% |
| 60 to 89 Minutes | 1,163 | 7.0% |
| 90 or more Minutes | 230 | 1.4% |
Commute Time by Sex in Friendswood
The most common commute times in Friendswood are 45 to 59 minutes (1,570 commuters, 16.8%) for males and 15 to 19 minutes (1,673 commuters, 22.8%) for females.
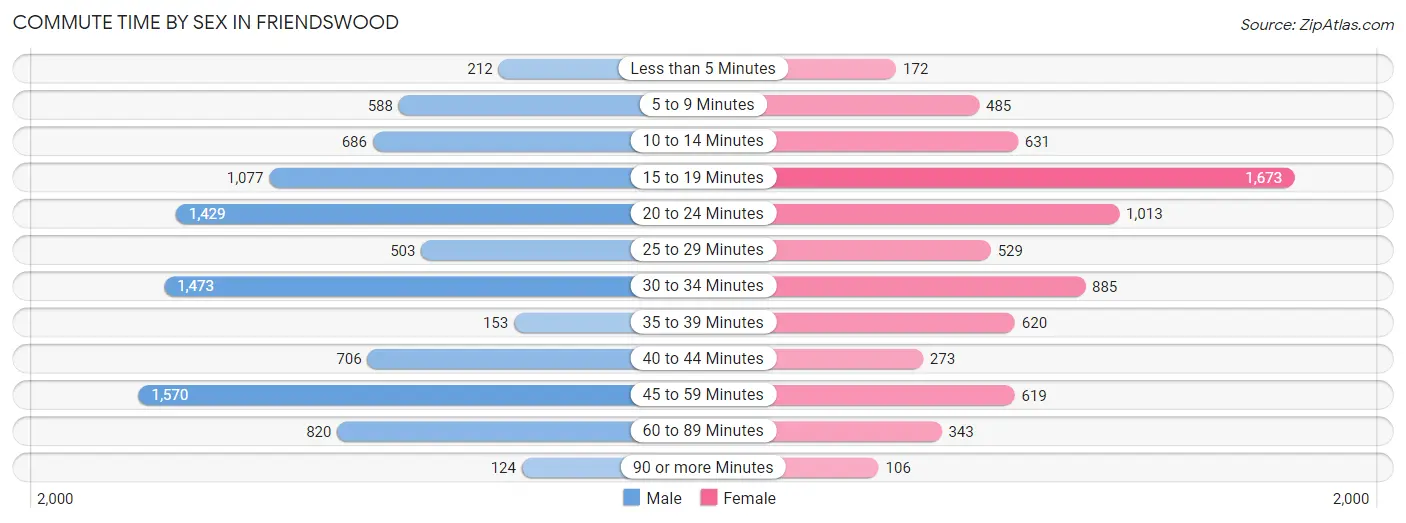
| Commute Time | Male | Female |
| Less than 5 Minutes | 212 (2.3%) | 172 (2.3%) |
| 5 to 9 Minutes | 588 (6.3%) | 485 (6.6%) |
| 10 to 14 Minutes | 686 (7.3%) | 631 (8.6%) |
| 15 to 19 Minutes | 1,077 (11.5%) | 1,673 (22.8%) |
| 20 to 24 Minutes | 1,429 (15.3%) | 1,013 (13.8%) |
| 25 to 29 Minutes | 503 (5.4%) | 529 (7.2%) |
| 30 to 34 Minutes | 1,473 (15.8%) | 885 (12.0%) |
| 35 to 39 Minutes | 153 (1.6%) | 620 (8.4%) |
| 40 to 44 Minutes | 706 (7.6%) | 273 (3.7%) |
| 45 to 59 Minutes | 1,570 (16.8%) | 619 (8.4%) |
| 60 to 89 Minutes | 820 (8.8%) | 343 (4.7%) |
| 90 or more Minutes | 124 (1.3%) | 106 (1.4%) |
Time of Departure to Work by Sex in Friendswood
The most frequent times of departure to work in Friendswood are 7:00 AM to 7:29 AM (1,344, 14.4%) for males and 7:30 AM to 7:59 AM (1,257, 17.1%) for females.
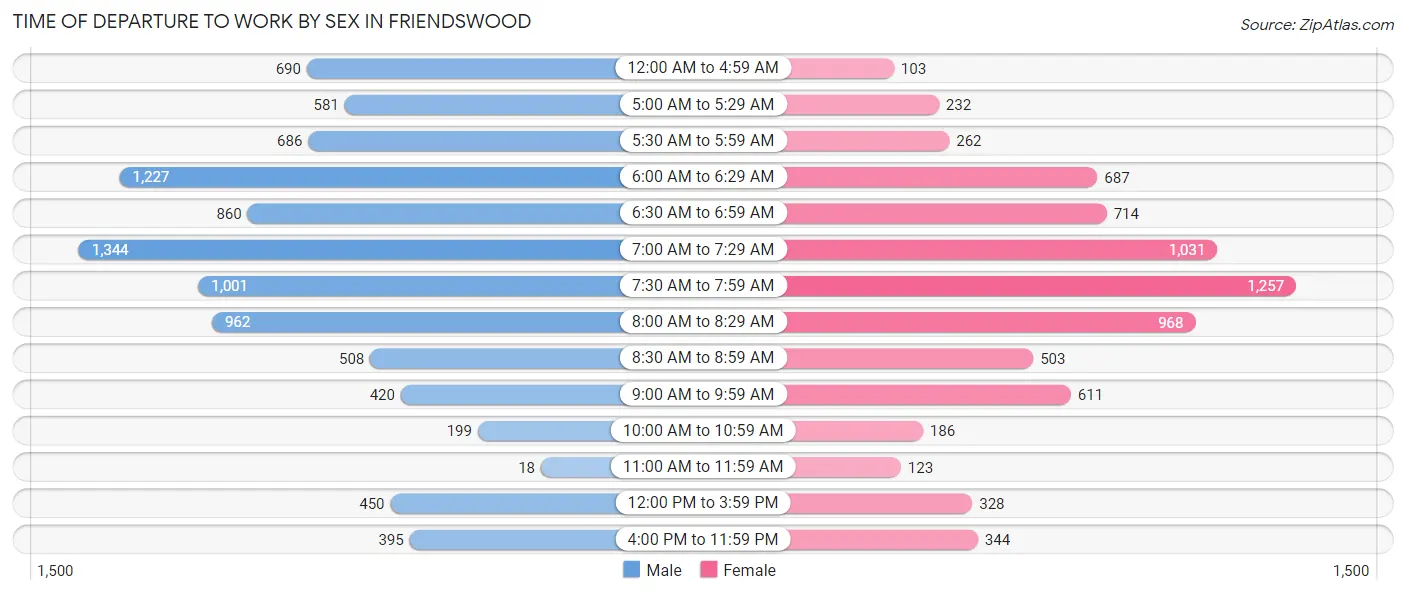
| Time of Departure | Male | Female |
| 12:00 AM to 4:59 AM | 690 (7.4%) | 103 (1.4%) |
| 5:00 AM to 5:29 AM | 581 (6.2%) | 232 (3.2%) |
| 5:30 AM to 5:59 AM | 686 (7.3%) | 262 (3.6%) |
| 6:00 AM to 6:29 AM | 1,227 (13.1%) | 687 (9.3%) |
| 6:30 AM to 6:59 AM | 860 (9.2%) | 714 (9.7%) |
| 7:00 AM to 7:29 AM | 1,344 (14.4%) | 1,031 (14.0%) |
| 7:30 AM to 7:59 AM | 1,001 (10.7%) | 1,257 (17.1%) |
| 8:00 AM to 8:29 AM | 962 (10.3%) | 968 (13.2%) |
| 8:30 AM to 8:59 AM | 508 (5.4%) | 503 (6.8%) |
| 9:00 AM to 9:59 AM | 420 (4.5%) | 611 (8.3%) |
| 10:00 AM to 10:59 AM | 199 (2.1%) | 186 (2.5%) |
| 11:00 AM to 11:59 AM | 18 (0.2%) | 123 (1.7%) |
| 12:00 PM to 3:59 PM | 450 (4.8%) | 328 (4.5%) |
| 4:00 PM to 11:59 PM | 395 (4.2%) | 344 (4.7%) |
| Total | 9,341 (100.0%) | 7,349 (100.0%) |
Housing Occupancy in Friendswood
Occupancy by Ownership in Friendswood
Of the total 14,201 dwellings in Friendswood, owner-occupied units account for 10,913 (76.8%), while renter-occupied units make up 3,288 (23.2%).
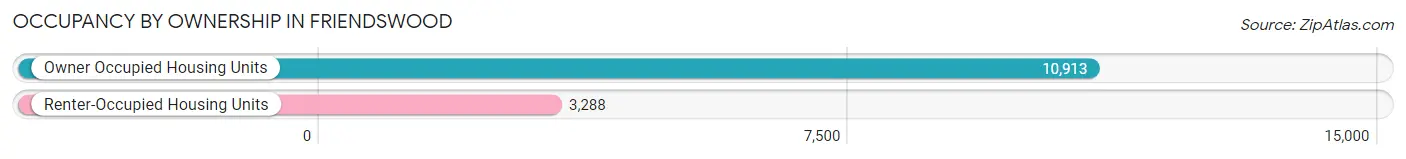
| Occupancy | # Housing Units | % Housing Units |
| Owner Occupied Housing Units | 10,913 | 76.8% |
| Renter-Occupied Housing Units | 3,288 | 23.2% |
| Total Occupied Housing Units | 14,201 | 100.0% |
Occupancy by Household Size in Friendswood
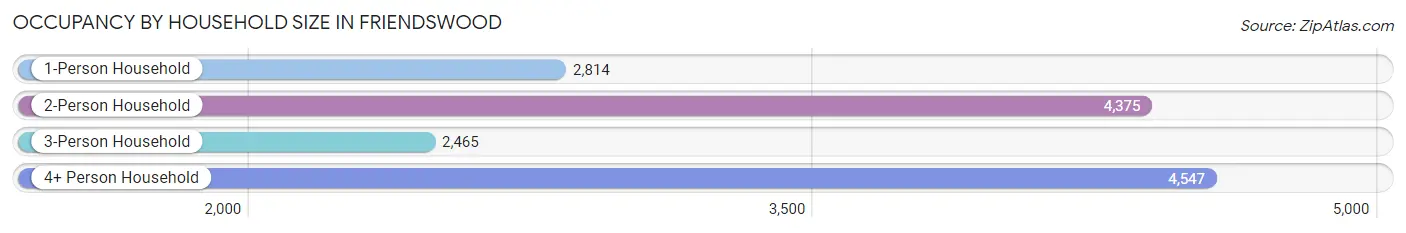
| Household Size | # Housing Units | % Housing Units |
| 1-Person Household | 2,814 | 19.8% |
| 2-Person Household | 4,375 | 30.8% |
| 3-Person Household | 2,465 | 17.4% |
| 4+ Person Household | 4,547 | 32.0% |
| Total Housing Units | 14,201 | 100.0% |
Occupancy by Ownership by Household Size in Friendswood
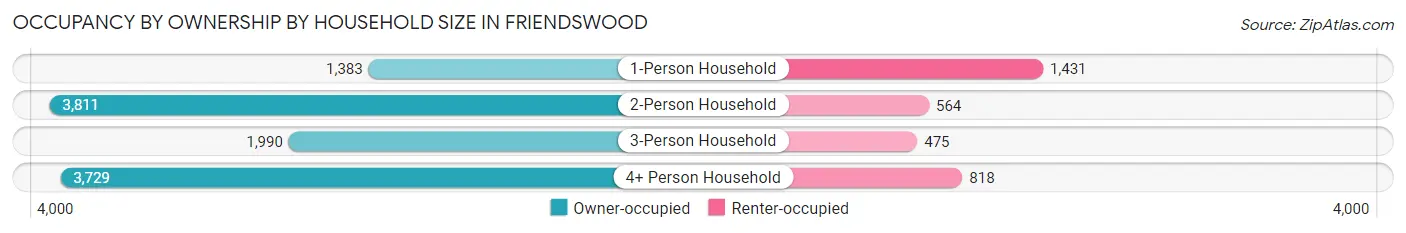
| Household Size | Owner-occupied | Renter-occupied |
| 1-Person Household | 1,383 (49.1%) | 1,431 (50.8%) |
| 2-Person Household | 3,811 (87.1%) | 564 (12.9%) |
| 3-Person Household | 1,990 (80.7%) | 475 (19.3%) |
| 4+ Person Household | 3,729 (82.0%) | 818 (18.0%) |
| Total Housing Units | 10,913 (76.8%) | 3,288 (23.2%) |
Occupancy by Educational Attainment in Friendswood
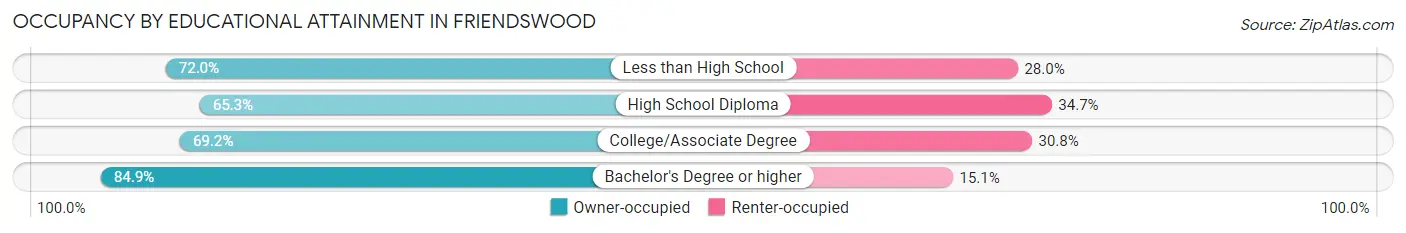
| Household Size | Owner-occupied | Renter-occupied |
| Less than High School | 429 (72.0%) | 167 (28.0%) |
| High School Diploma | 1,125 (65.3%) | 599 (34.7%) |
| College/Associate Degree | 3,193 (69.2%) | 1,422 (30.8%) |
| Bachelor's Degree or higher | 6,166 (84.9%) | 1,100 (15.1%) |
Occupancy by Age of Householder in Friendswood
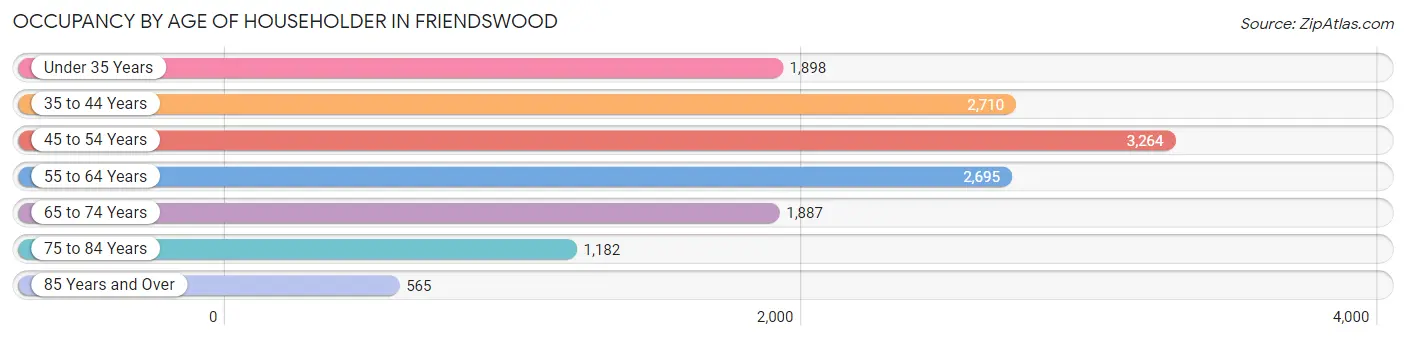
| Age Bracket | # Households | % Households |
| Under 35 Years | 1,898 | 13.4% |
| 35 to 44 Years | 2,710 | 19.1% |
| 45 to 54 Years | 3,264 | 23.0% |
| 55 to 64 Years | 2,695 | 19.0% |
| 65 to 74 Years | 1,887 | 13.3% |
| 75 to 84 Years | 1,182 | 8.3% |
| 85 Years and Over | 565 | 4.0% |
| Total | 14,201 | 100.0% |
Housing Finances in Friendswood
Median Income by Occupancy in Friendswood
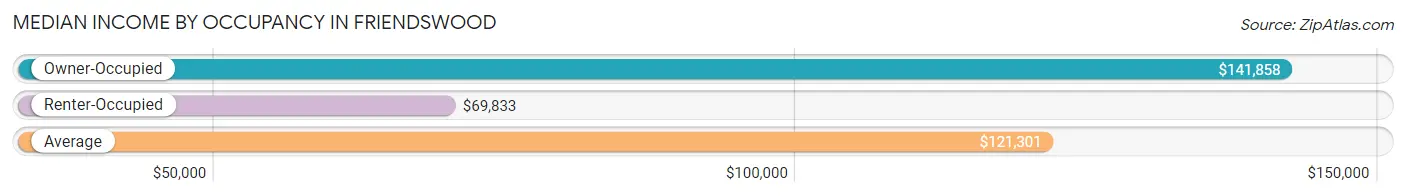
| Occupancy Type | # Households | Median Income |
| Owner-Occupied | 10,913 (76.8%) | $141,858 |
| Renter-Occupied | 3,288 (23.2%) | $69,833 |
| Average | 14,201 (100.0%) | $121,301 |
Occupancy by Householder Income Bracket in Friendswood
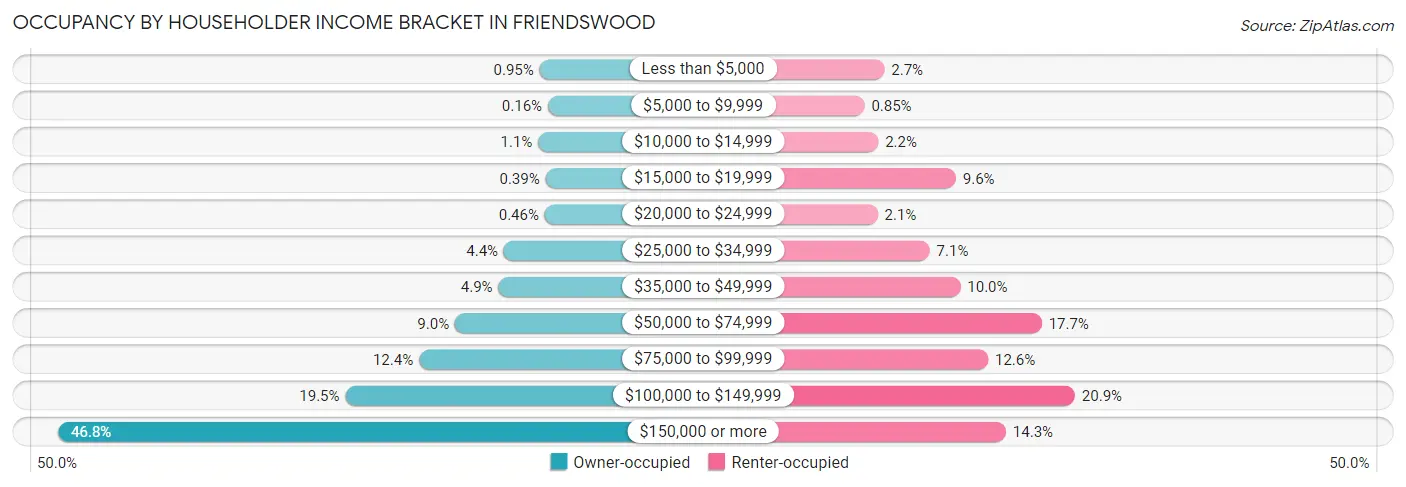
| Income Bracket | Owner-occupied | Renter-occupied |
| Less than $5,000 | 104 (0.9%) | 90 (2.7%) |
| $5,000 to $9,999 | 17 (0.2%) | 28 (0.9%) |
| $10,000 to $14,999 | 119 (1.1%) | 71 (2.2%) |
| $15,000 to $19,999 | 43 (0.4%) | 314 (9.6%) |
| $20,000 to $24,999 | 50 (0.5%) | 69 (2.1%) |
| $25,000 to $34,999 | 475 (4.3%) | 232 (7.1%) |
| $35,000 to $49,999 | 531 (4.9%) | 328 (10.0%) |
| $50,000 to $74,999 | 983 (9.0%) | 583 (17.7%) |
| $75,000 to $99,999 | 1,358 (12.4%) | 415 (12.6%) |
| $100,000 to $149,999 | 2,123 (19.5%) | 687 (20.9%) |
| $150,000 or more | 5,110 (46.8%) | 471 (14.3%) |
| Total | 10,913 (100.0%) | 3,288 (100.0%) |
Monthly Housing Cost Tiers in Friendswood
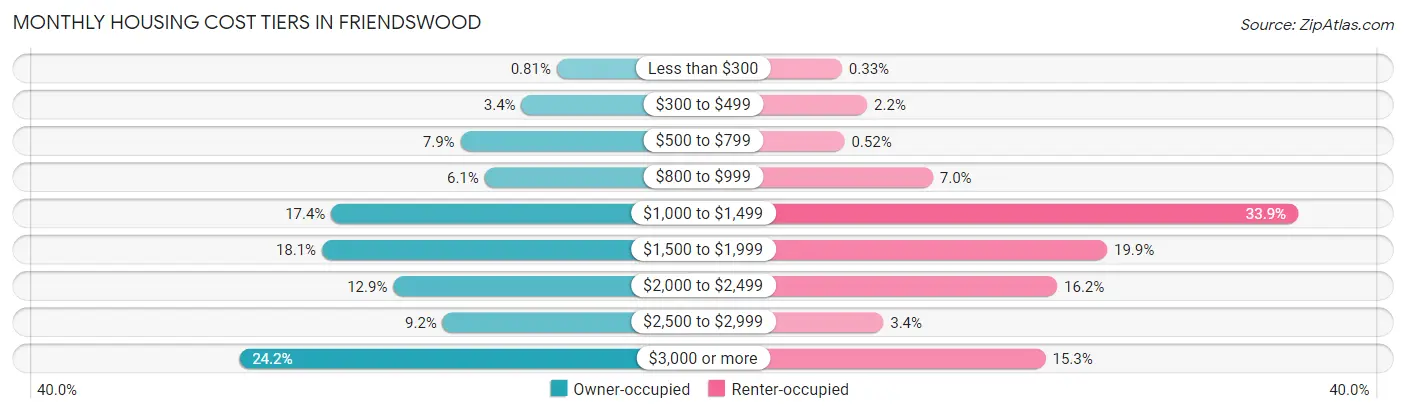
| Monthly Cost | Owner-occupied | Renter-occupied |
| Less than $300 | 88 (0.8%) | 11 (0.3%) |
| $300 to $499 | 372 (3.4%) | 72 (2.2%) |
| $500 to $799 | 862 (7.9%) | 17 (0.5%) |
| $800 to $999 | 668 (6.1%) | 231 (7.0%) |
| $1,000 to $1,499 | 1,901 (17.4%) | 1,115 (33.9%) |
| $1,500 to $1,999 | 1,975 (18.1%) | 653 (19.9%) |
| $2,000 to $2,499 | 1,402 (12.9%) | 532 (16.2%) |
| $2,500 to $2,999 | 1,005 (9.2%) | 111 (3.4%) |
| $3,000 or more | 2,640 (24.2%) | 504 (15.3%) |
| Total | 10,913 (100.0%) | 3,288 (100.0%) |
Physical Housing Characteristics in Friendswood
Housing Structures in Friendswood
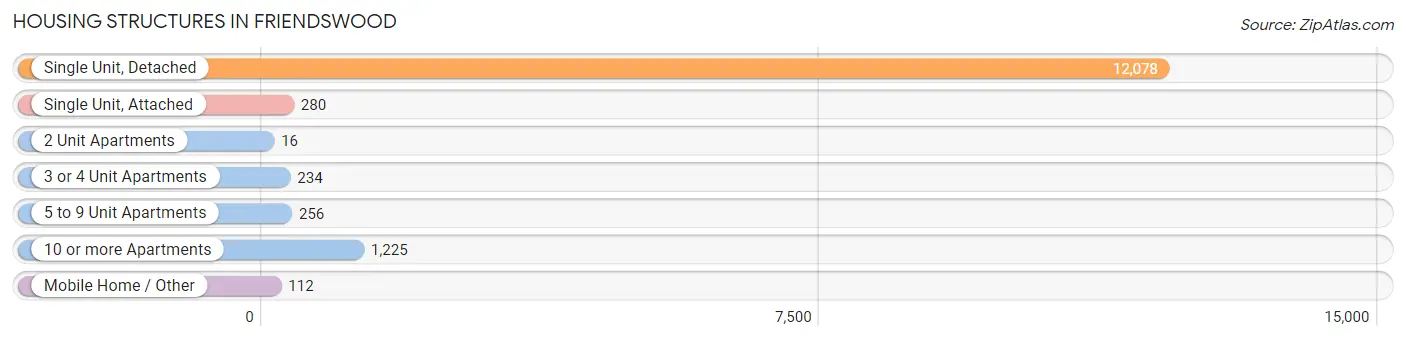
| Structure Type | # Housing Units | % Housing Units |
| Single Unit, Detached | 12,078 | 85.1% |
| Single Unit, Attached | 280 | 2.0% |
| 2 Unit Apartments | 16 | 0.1% |
| 3 or 4 Unit Apartments | 234 | 1.7% |
| 5 to 9 Unit Apartments | 256 | 1.8% |
| 10 or more Apartments | 1,225 | 8.6% |
| Mobile Home / Other | 112 | 0.8% |
| Total | 14,201 | 100.0% |
Housing Structures by Occupancy in Friendswood
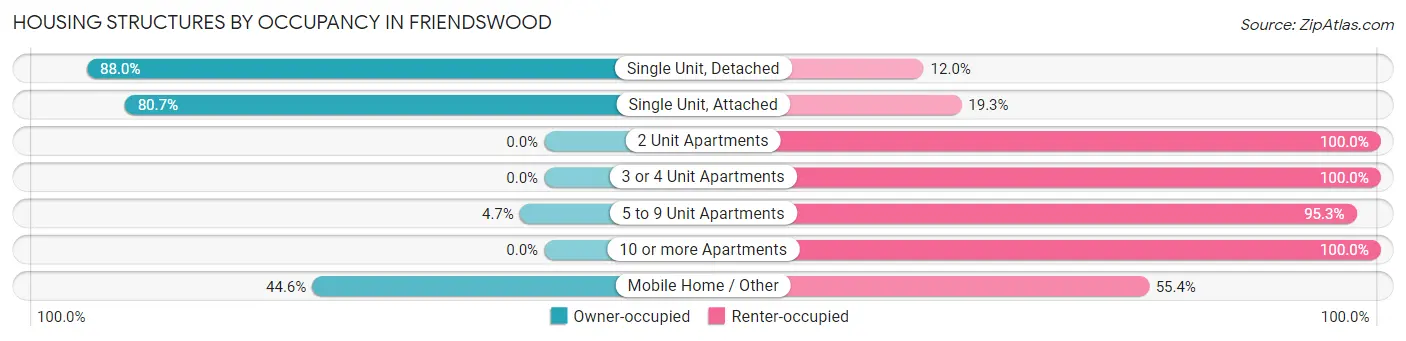
| Structure Type | Owner-occupied | Renter-occupied |
| Single Unit, Detached | 10,625 (88.0%) | 1,453 (12.0%) |
| Single Unit, Attached | 226 (80.7%) | 54 (19.3%) |
| 2 Unit Apartments | 0 (0.0%) | 16 (100.0%) |
| 3 or 4 Unit Apartments | 0 (0.0%) | 234 (100.0%) |
| 5 to 9 Unit Apartments | 12 (4.7%) | 244 (95.3%) |
| 10 or more Apartments | 0 (0.0%) | 1,225 (100.0%) |
| Mobile Home / Other | 50 (44.6%) | 62 (55.4%) |
| Total | 10,913 (76.8%) | 3,288 (23.2%) |
Housing Structures by Number of Rooms in Friendswood
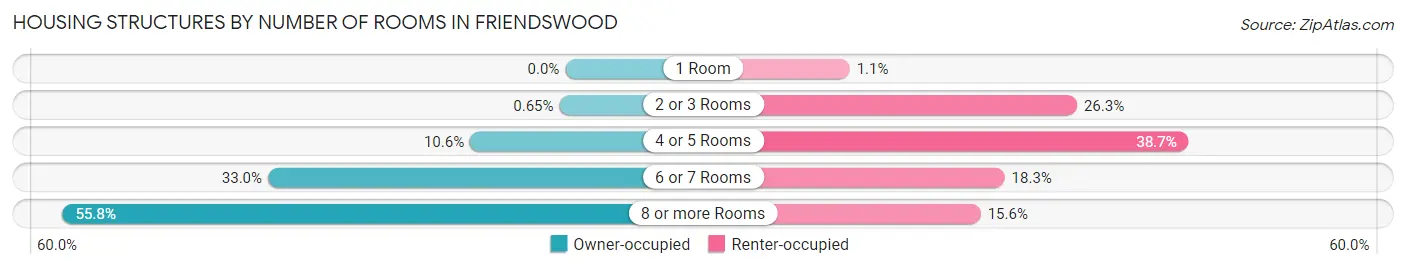
| Number of Rooms | Owner-occupied | Renter-occupied |
| 1 Room | 0 (0.0%) | 36 (1.1%) |
| 2 or 3 Rooms | 71 (0.6%) | 865 (26.3%) |
| 4 or 5 Rooms | 1,153 (10.6%) | 1,272 (38.7%) |
| 6 or 7 Rooms | 3,601 (33.0%) | 601 (18.3%) |
| 8 or more Rooms | 6,088 (55.8%) | 514 (15.6%) |
| Total | 10,913 (100.0%) | 3,288 (100.0%) |
Housing Structure by Heating Type in Friendswood
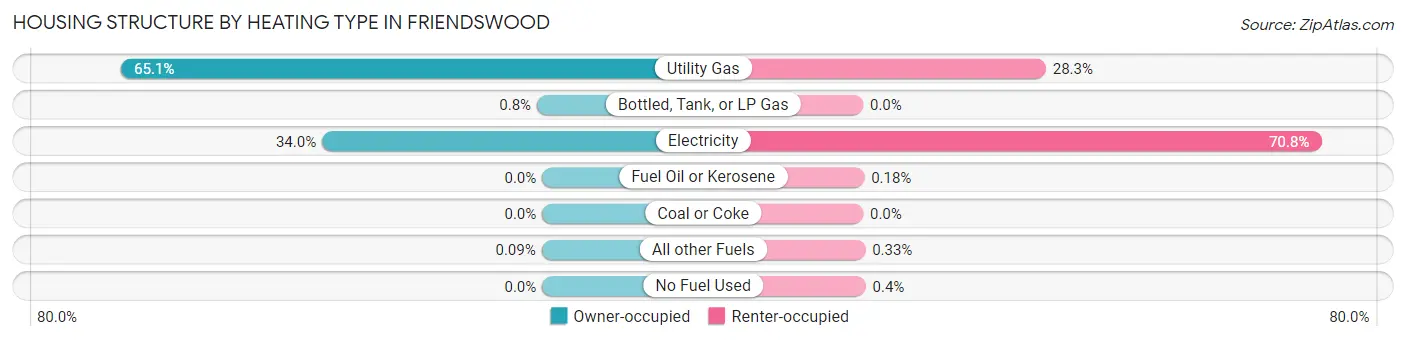
| Heating Type | Owner-occupied | Renter-occupied |
| Utility Gas | 7,102 (65.1%) | 929 (28.2%) |
| Bottled, Tank, or LP Gas | 87 (0.8%) | 0 (0.0%) |
| Electricity | 3,714 (34.0%) | 2,329 (70.8%) |
| Fuel Oil or Kerosene | 0 (0.0%) | 6 (0.2%) |
| Coal or Coke | 0 (0.0%) | 0 (0.0%) |
| All other Fuels | 10 (0.1%) | 11 (0.3%) |
| No Fuel Used | 0 (0.0%) | 13 (0.4%) |
| Total | 10,913 (100.0%) | 3,288 (100.0%) |
Household Vehicle Usage in Friendswood
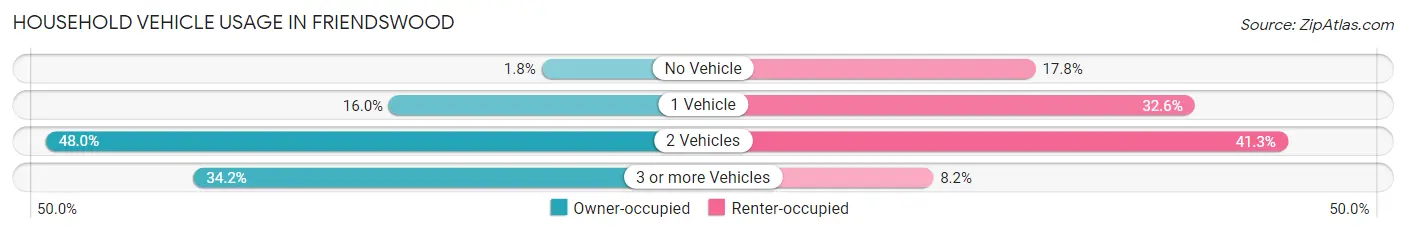
| Vehicles per Household | Owner-occupied | Renter-occupied |
| No Vehicle | 191 (1.8%) | 585 (17.8%) |
| 1 Vehicle | 1,745 (16.0%) | 1,073 (32.6%) |
| 2 Vehicles | 5,240 (48.0%) | 1,359 (41.3%) |
| 3 or more Vehicles | 3,737 (34.2%) | 271 (8.2%) |
| Total | 10,913 (100.0%) | 3,288 (100.0%) |
Real Estate & Mortgages in Friendswood
Real Estate and Mortgage Overview in Friendswood
| Characteristic | Without Mortgage | With Mortgage |
| Housing Units | 3,877 | 7,036 |
| Median Property Value | $339,000 | $375,600 |
| Median Household Income | $118,553 | $3,513 |
| Monthly Housing Costs | $1,018 | $2,614 |
| Real Estate Taxes | $5,585 | $179 |
Property Value by Mortgage Status in Friendswood
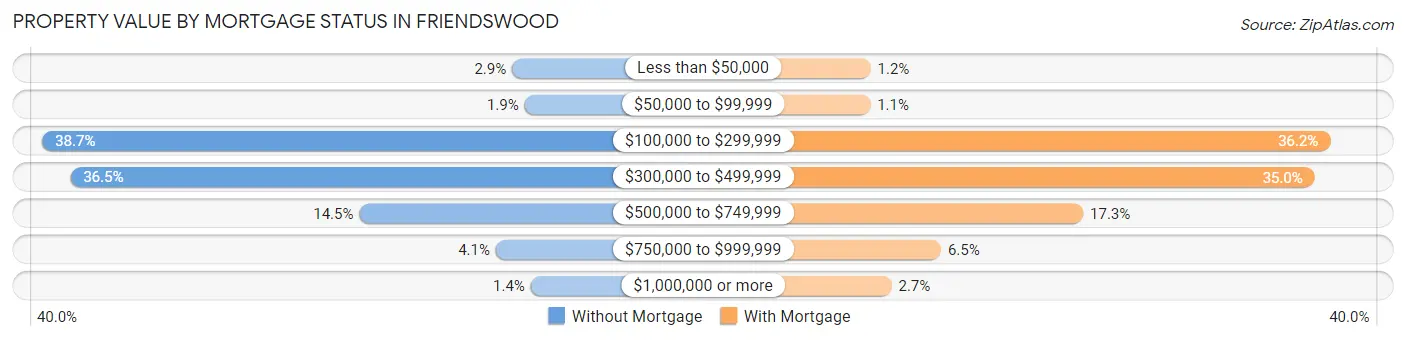
| Property Value | Without Mortgage | With Mortgage |
| Less than $50,000 | 111 (2.9%) | 81 (1.1%) |
| $50,000 to $99,999 | 74 (1.9%) | 79 (1.1%) |
| $100,000 to $299,999 | 1,499 (38.7%) | 2,544 (36.2%) |
| $300,000 to $499,999 | 1,416 (36.5%) | 2,461 (35.0%) |
| $500,000 to $749,999 | 562 (14.5%) | 1,220 (17.3%) |
| $750,000 to $999,999 | 159 (4.1%) | 458 (6.5%) |
| $1,000,000 or more | 56 (1.4%) | 193 (2.7%) |
| Total | 3,877 (100.0%) | 7,036 (100.0%) |
Household Income by Mortgage Status in Friendswood
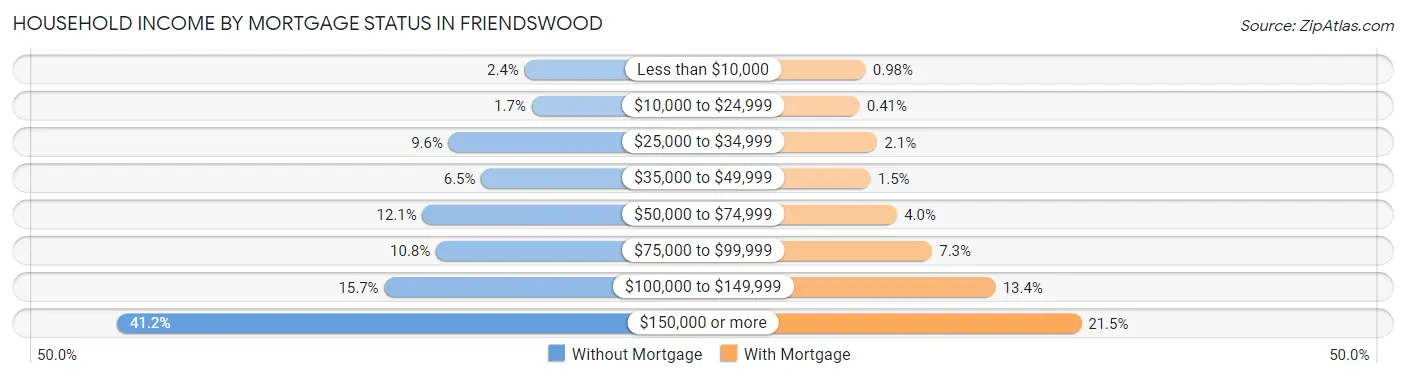
| Household Income | Without Mortgage | With Mortgage |
| Less than $10,000 | 92 (2.4%) | 69 (1.0%) |
| $10,000 to $24,999 | 66 (1.7%) | 29 (0.4%) |
| $25,000 to $34,999 | 372 (9.6%) | 146 (2.1%) |
| $35,000 to $49,999 | 252 (6.5%) | 103 (1.5%) |
| $50,000 to $74,999 | 469 (12.1%) | 279 (4.0%) |
| $75,000 to $99,999 | 419 (10.8%) | 514 (7.3%) |
| $100,000 to $149,999 | 610 (15.7%) | 939 (13.4%) |
| $150,000 or more | 1,597 (41.2%) | 1,513 (21.5%) |
| Total | 3,877 (100.0%) | 7,036 (100.0%) |
Property Value to Household Income Ratio in Friendswood
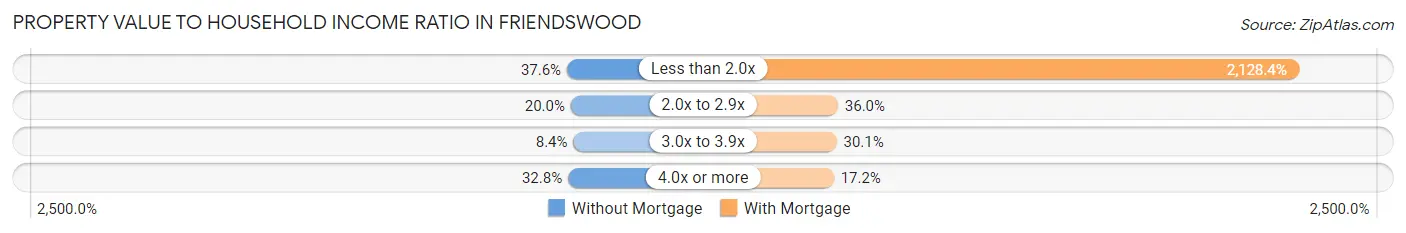
| Value-to-Income Ratio | Without Mortgage | With Mortgage |
| Less than 2.0x | 1,457 (37.6%) | 149,755 (2,128.4%) |
| 2.0x to 2.9x | 775 (20.0%) | 2,532 (36.0%) |
| 3.0x to 3.9x | 325 (8.4%) | 2,121 (30.1%) |
| 4.0x or more | 1,273 (32.8%) | 1,209 (17.2%) |
| Total | 3,877 (100.0%) | 7,036 (100.0%) |
Real Estate Taxes by Mortgage Status in Friendswood
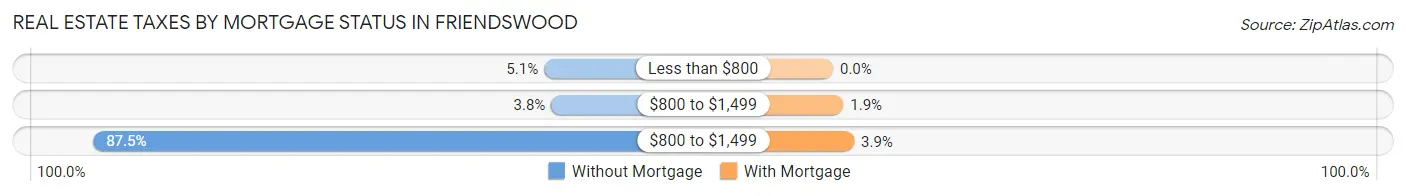
| Property Taxes | Without Mortgage | With Mortgage |
| Less than $800 | 199 (5.1%) | 0 (0.0%) |
| $800 to $1,499 | 148 (3.8%) | 132 (1.9%) |
| $800 to $1,499 | 3,391 (87.5%) | 271 (3.8%) |
| Total | 3,877 (100.0%) | 7,036 (100.0%) |
Health & Disability in Friendswood
Health Insurance Coverage by Age in Friendswood
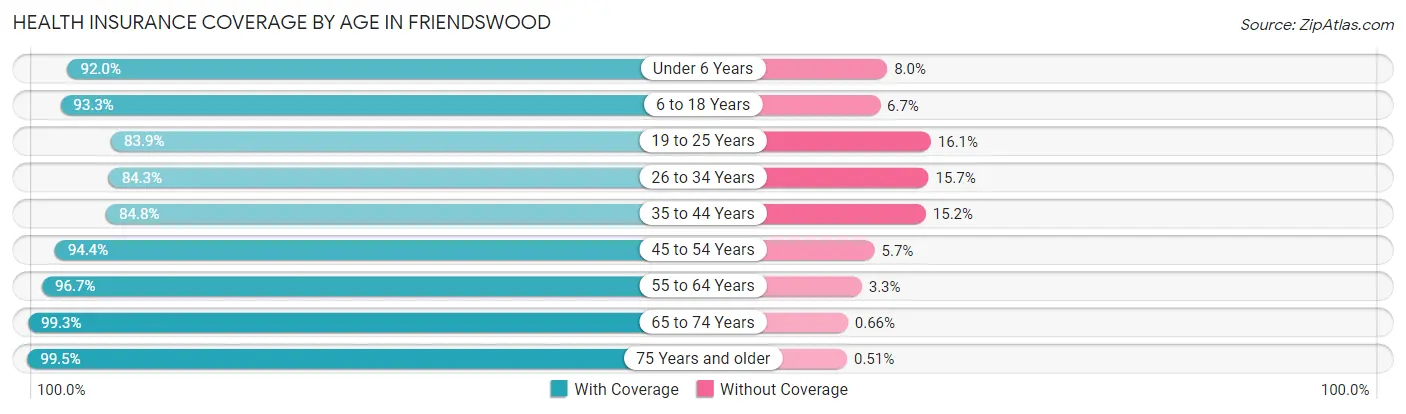
| Age Bracket | With Coverage | Without Coverage |
| Under 6 Years | 2,849 (92.0%) | 248 (8.0%) |
| 6 to 18 Years | 7,944 (93.3%) | 569 (6.7%) |
| 19 to 25 Years | 2,884 (83.9%) | 555 (16.1%) |
| 26 to 34 Years | 2,881 (84.3%) | 537 (15.7%) |
| 35 to 44 Years | 4,380 (84.8%) | 786 (15.2%) |
| 45 to 54 Years | 5,716 (94.4%) | 342 (5.7%) |
| 55 to 64 Years | 4,925 (96.7%) | 166 (3.3%) |
| 65 to 74 Years | 3,308 (99.3%) | 22 (0.7%) |
| 75 Years and older | 2,524 (99.5%) | 13 (0.5%) |
| Total | 37,411 (92.0%) | 3,238 (8.0%) |
Health Insurance Coverage by Citizenship Status in Friendswood
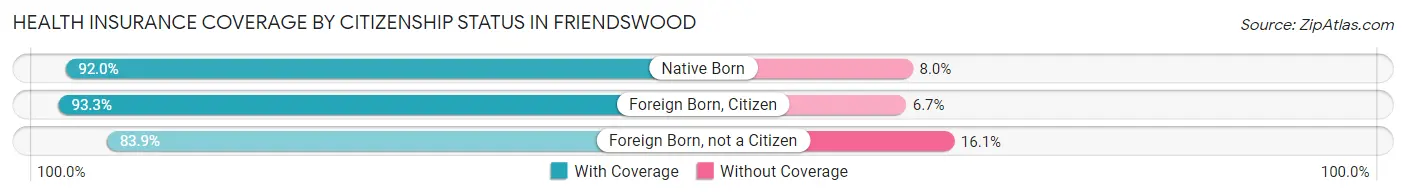
| Citizenship Status | With Coverage | Without Coverage |
| Native Born | 2,849 (92.0%) | 248 (8.0%) |
| Foreign Born, Citizen | 7,944 (93.3%) | 569 (6.7%) |
| Foreign Born, not a Citizen | 2,884 (83.9%) | 555 (16.1%) |
Health Insurance Coverage by Household Income in Friendswood
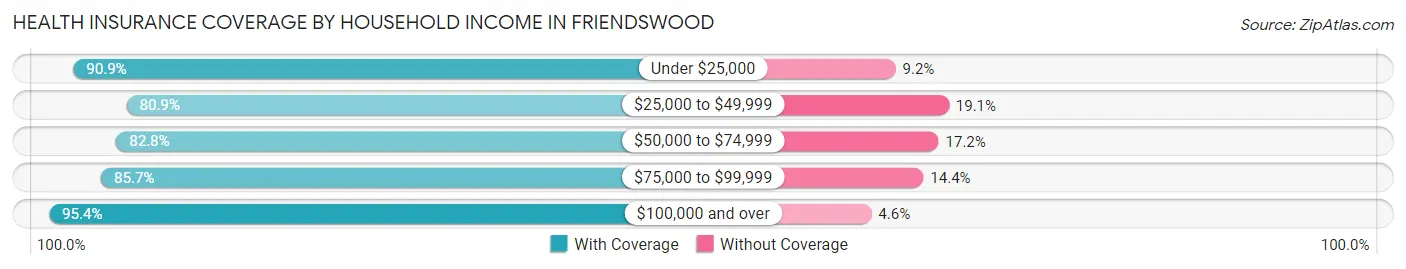
| Household Income | With Coverage | Without Coverage |
| Under $25,000 | 1,300 (90.8%) | 131 (9.1%) |
| $25,000 to $49,999 | 2,267 (80.9%) | 536 (19.1%) |
| $50,000 to $74,999 | 2,725 (82.8%) | 566 (17.2%) |
| $75,000 to $99,999 | 4,190 (85.7%) | 702 (14.3%) |
| $100,000 and over | 26,885 (95.4%) | 1,300 (4.6%) |
Public vs Private Health Insurance Coverage by Age in Friendswood
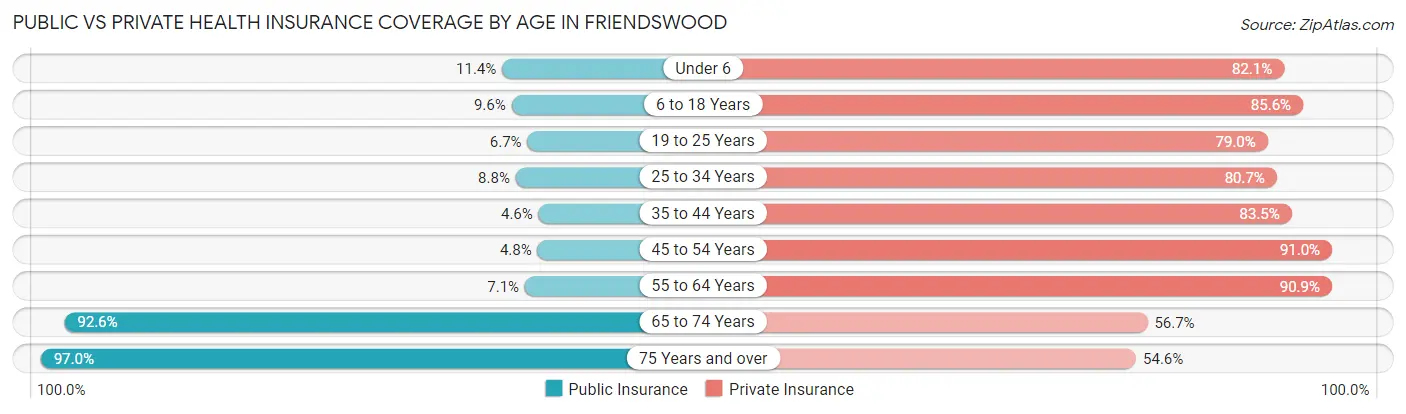
| Age Bracket | Public Insurance | Private Insurance |
| Under 6 | 352 (11.4%) | 2,542 (82.1%) |
| 6 to 18 Years | 818 (9.6%) | 7,285 (85.6%) |
| 19 to 25 Years | 229 (6.7%) | 2,718 (79.0%) |
| 25 to 34 Years | 302 (8.8%) | 2,759 (80.7%) |
| 35 to 44 Years | 237 (4.6%) | 4,313 (83.5%) |
| 45 to 54 Years | 290 (4.8%) | 5,511 (91.0%) |
| 55 to 64 Years | 363 (7.1%) | 4,630 (90.9%) |
| 65 to 74 Years | 3,084 (92.6%) | 1,889 (56.7%) |
| 75 Years and over | 2,461 (97.0%) | 1,386 (54.6%) |
| Total | 8,136 (20.0%) | 33,033 (81.3%) |
Disability Status by Sex by Age in Friendswood
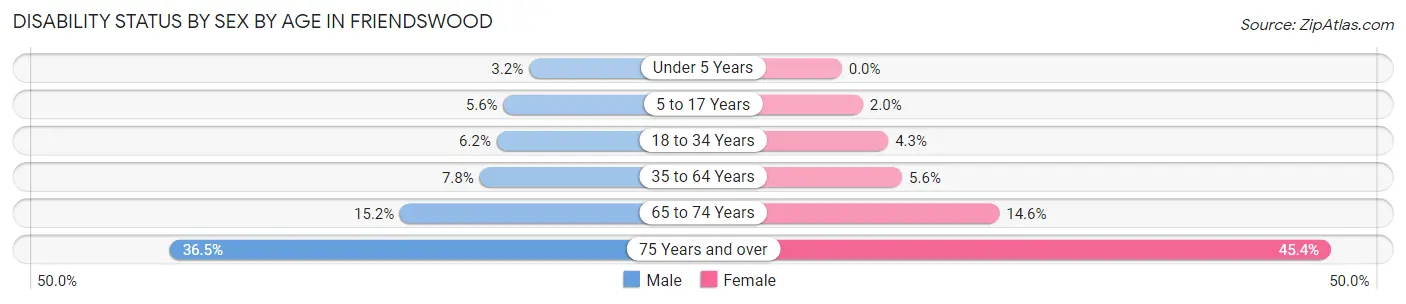
| Age Bracket | Male | Female |
| Under 5 Years | 49 (3.2%) | 0 (0.0%) |
| 5 to 17 Years | 221 (5.6%) | 86 (2.0%) |
| 18 to 34 Years | 224 (6.2%) | 165 (4.3%) |
| 35 to 64 Years | 627 (7.8%) | 462 (5.6%) |
| 65 to 74 Years | 230 (15.1%) | 265 (14.6%) |
| 75 Years and over | 316 (36.5%) | 759 (45.4%) |
Disability Class by Sex by Age in Friendswood
Disability Class: Hearing Difficulty
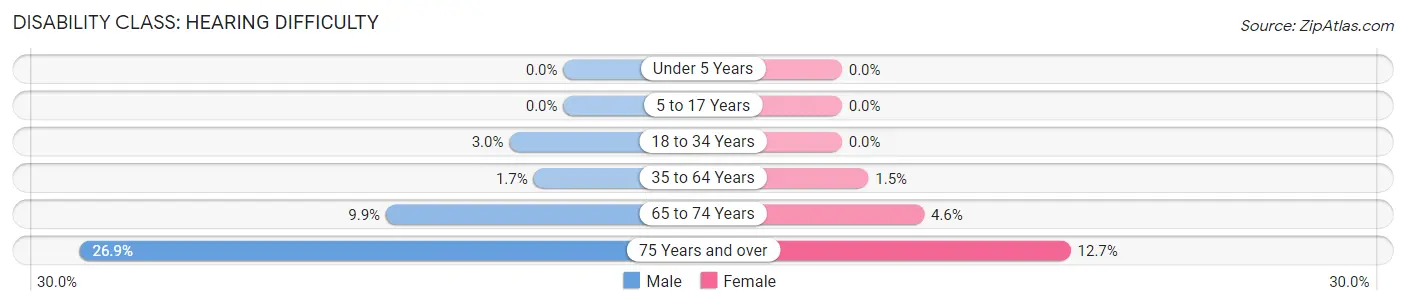
| Age Bracket | Male | Female |
| Under 5 Years | 0 (0.0%) | 0 (0.0%) |
| 5 to 17 Years | 0 (0.0%) | 0 (0.0%) |
| 18 to 34 Years | 109 (3.0%) | 0 (0.0%) |
| 35 to 64 Years | 134 (1.7%) | 122 (1.5%) |
| 65 to 74 Years | 150 (9.9%) | 83 (4.6%) |
| 75 Years and over | 233 (26.9%) | 213 (12.7%) |
Disability Class: Vision Difficulty
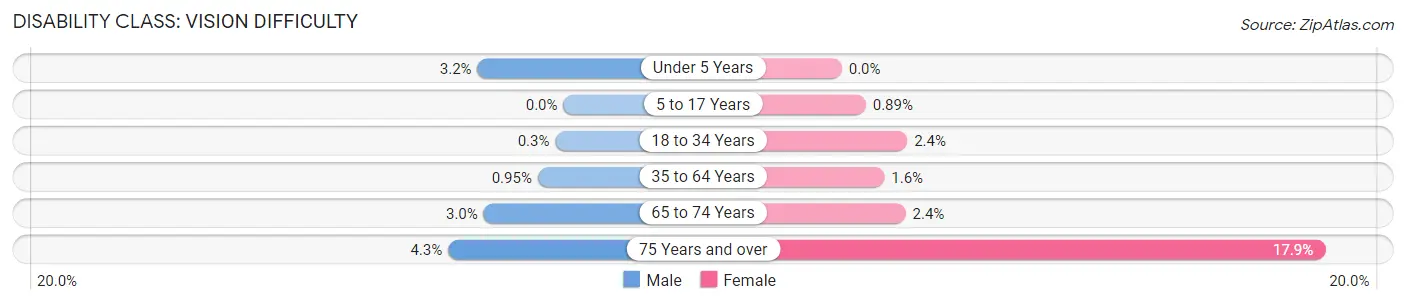
| Age Bracket | Male | Female |
| Under 5 Years | 49 (3.2%) | 0 (0.0%) |
| 5 to 17 Years | 0 (0.0%) | 39 (0.9%) |
| 18 to 34 Years | 11 (0.3%) | 93 (2.4%) |
| 35 to 64 Years | 77 (0.9%) | 130 (1.6%) |
| 65 to 74 Years | 45 (3.0%) | 43 (2.4%) |
| 75 Years and over | 37 (4.3%) | 300 (17.9%) |
Disability Class: Cognitive Difficulty
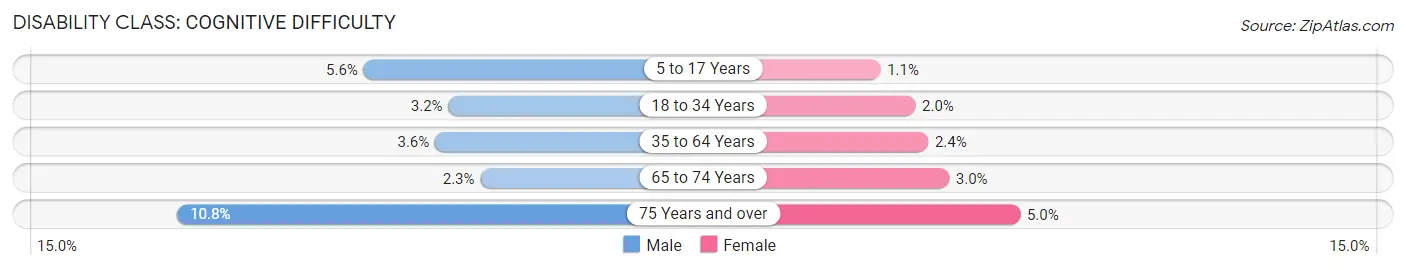
| Age Bracket | Male | Female |
| 5 to 17 Years | 221 (5.6%) | 47 (1.1%) |
| 18 to 34 Years | 116 (3.2%) | 78 (2.0%) |
| 35 to 64 Years | 288 (3.6%) | 198 (2.4%) |
| 65 to 74 Years | 35 (2.3%) | 54 (3.0%) |
| 75 Years and over | 93 (10.7%) | 83 (5.0%) |
Disability Class: Ambulatory Difficulty
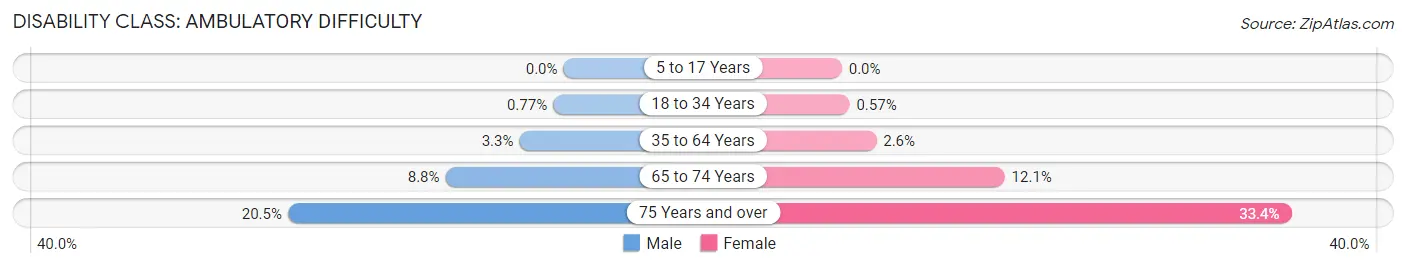
| Age Bracket | Male | Female |
| 5 to 17 Years | 0 (0.0%) | 0 (0.0%) |
| 18 to 34 Years | 28 (0.8%) | 22 (0.6%) |
| 35 to 64 Years | 264 (3.3%) | 211 (2.6%) |
| 65 to 74 Years | 133 (8.8%) | 219 (12.1%) |
| 75 Years and over | 177 (20.5%) | 558 (33.4%) |
Disability Class: Self-Care Difficulty
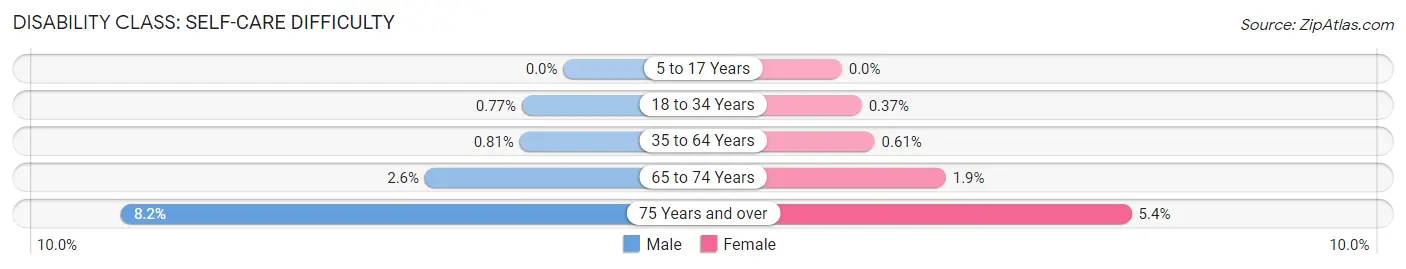
| Age Bracket | Male | Female |
| 5 to 17 Years | 0 (0.0%) | 0 (0.0%) |
| 18 to 34 Years | 28 (0.8%) | 14 (0.4%) |
| 35 to 64 Years | 65 (0.8%) | 50 (0.6%) |
| 65 to 74 Years | 39 (2.6%) | 35 (1.9%) |
| 75 Years and over | 71 (8.2%) | 90 (5.4%) |
Technology Access in Friendswood
Computing Device Access in Friendswood
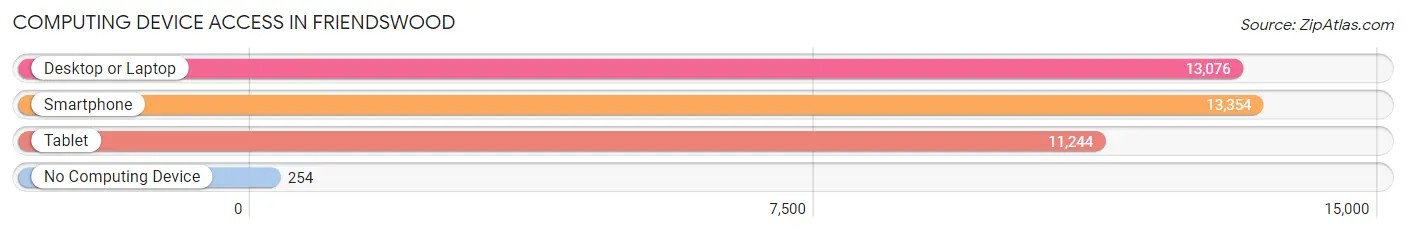
| Device Type | # Households | % Households |
| Desktop or Laptop | 13,076 | 92.1% |
| Smartphone | 13,354 | 94.0% |
| Tablet | 11,244 | 79.2% |
| No Computing Device | 254 | 1.8% |
| Total | 14,201 | 100.0% |
Internet Access in Friendswood
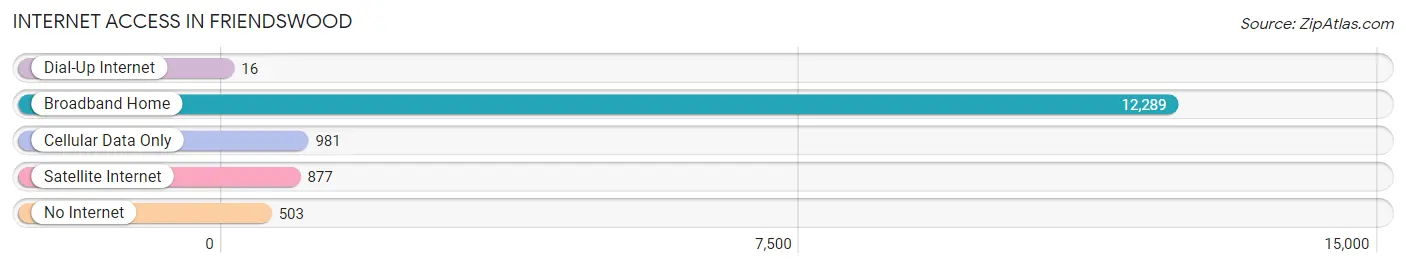
| Internet Type | # Households | % Households |
| Dial-Up Internet | 16 | 0.1% |
| Broadband Home | 12,289 | 86.5% |
| Cellular Data Only | 981 | 6.9% |
| Satellite Internet | 877 | 6.2% |
| No Internet | 503 | 3.5% |
| Total | 14,201 | 100.0% |
Friendswood Summary
Friendswwod, TX is a city located in the southeastern part of the state of Texas, in the United States. It is part of the Houston–The Woodlands–Sugar Land metropolitan area. The city is located in Harris, Galveston, and Brazoria counties. As of the 2010 census, the city had a population of 35,805.
History
Friendswwod, TX was founded in 1895 by a group of Quakers from Iowa. The Quakers were looking for a place to settle and practice their faith. They chose the area because of its proximity to Galveston Bay and the Gulf of Mexico. The city was named after the Quaker Friends Meeting House, which was built in 1895.
The city was incorporated in 1960 and has since grown to become one of the most affluent suburbs of Houston. The city has experienced rapid growth in recent years, with its population increasing by more than 50% between 2000 and 2010.
Geography
Friendswwod, TX is located in southeastern Texas, about 25 miles south of Houston. It is situated in Harris, Galveston, and Brazoria counties. The city covers an area of about 25 square miles and is bordered by Clear Creek to the north, Clear Lake to the east, and Galveston Bay to the south.
The city has a humid subtropical climate, with hot, humid summers and mild winters. The average annual temperature is around 70°F, with temperatures reaching as high as 95°F in the summer and as low as 40°F in the winter.
Economy
Friendswwod, TX has a strong and diverse economy. The city is home to a number of major employers, including Chevron Phillips Chemical Company, Schlumberger, and Halliburton. The city also has a thriving retail sector, with a number of shopping centers and malls.
The city is also home to a number of technology companies, including Hewlett Packard, Microsoft, and Oracle. The city is also home to a number of medical centers, including the University of Texas Medical Branch and the Clear Lake Regional Medical Center.
Demographics
As of the 2010 census, the population of Friendswwod, TX was 35,805. The racial makeup of the city was 79.3% White, 8.2% African American, 0.4% Native American, 5.2% Asian, and 6.9% from other races. Hispanic or Latino of any race were 17.3% of the population.
The median household income in the city was $90,945, and the median family income was $103,945. The per capita income was $37,945. About 4.3% of families and 5.7% of the population were below the poverty line.
Conclusion
Friendswwod, TX is a city located in southeastern Texas, about 25 miles south of Houston. It is part of the Houston–The Woodlands–Sugar Land metropolitan area. The city was founded in 1895 by a group of Quakers from Iowa and has since grown to become one of the most affluent suburbs of Houston. The city has a strong and diverse economy, with major employers in the oil and gas, technology, and medical sectors. As of the 2010 census, the population of Friendswwod, TX was 35,805, with a median household income of $90,945.
Common Questions
What is Per Capita Income in Friendswood?
Per Capita income in Friendswood is $53,766.
What is the Median Family Income in Friendswood?
Median Family Income in Friendswood is $144,408.
What is the Median Household income in Friendswood?
Median Household Income in Friendswood is $121,301.
What is Income or Wage Gap in Friendswood?
Income or Wage Gap in Friendswood is 34.9%.
Women in Friendswood earn 65.1 cents for every dollar earned by a man.
What is Inequality or Gini Index in Friendswood?
Inequality or Gini Index in Friendswood is 0.42.
What is the Total Population of Friendswood?
Total Population of Friendswood is 40,888.
What is the Total Male Population of Friendswood?
Total Male Population of Friendswood is 19,682.
What is the Total Female Population of Friendswood?
Total Female Population of Friendswood is 21,206.
What is the Ratio of Males per 100 Females in Friendswood?
There are 92.81 Males per 100 Females in Friendswood.
What is the Ratio of Females per 100 Males in Friendswood?
There are 107.74 Females per 100 Males in Friendswood.
What is the Median Population Age in Friendswood?
Median Population Age in Friendswood is 38.7 Years.
What is the Average Family Size in Friendswood
Average Family Size in Friendswood is 3.3 People.
What is the Average Household Size in Friendswood
Average Household Size in Friendswood is 2.9 People.
How Large is the Labor Force in Friendswood?
There are 20,504 People in the Labor Forcein in Friendswood.
What is the Percentage of People in the Labor Force in Friendswood?
65.7% of People are in the Labor Force in Friendswood.
What is the Unemployment Rate in Friendswood?
Unemployment Rate in Friendswood is 4.6%.