Canadian, TX Map & Demographics
Canadian Map
Canadian Overview
$30,235
PER CAPITA INCOME
$76,875
AVG FAMILY INCOME
$54,013
AVG HOUSEHOLD INCOME
33.9%
WAGE / INCOME GAP [ % ]
66.1¢/ $1
WAGE / INCOME GAP [ $ ]
0.40
INEQUALITY / GINI INDEX
2,330
TOTAL POPULATION
1,338
MALE POPULATION
992
FEMALE POPULATION
134.88
MALES / 100 FEMALES
74.14
FEMALES / 100 MALES
38.2
MEDIAN AGE
3.3
AVG FAMILY SIZE
2.6
AVG HOUSEHOLD SIZE
1,172
LABOR FORCE [ PEOPLE ]
66.2%
PERCENT IN LABOR FORCE
3.5%
UNEMPLOYMENT RATE
Canadian Zip Codes
Canadian Area Codes
Income in Canadian
Income Overview in Canadian
Per Capita Income in Canadian is $30,235, while median incomes of families and households are $76,875 and $54,013 respectively.
| Characteristic | Number | Measure |
| Per Capita Income | 2,330 | $30,235 |
| Median Family Income | 610 | $76,875 |
| Mean Family Income | 610 | $95,293 |
| Median Household Income | 867 | $54,013 |
| Mean Household Income | 867 | $77,877 |
| Income Deficit | 610 | $0 |
| Wage / Income Gap (%) | 2,330 | 33.88% |
| Wage / Income Gap ($) | 2,330 | 66.12¢ per $1 |
| Gini / Inequality Index | 2,330 | 0.40 |
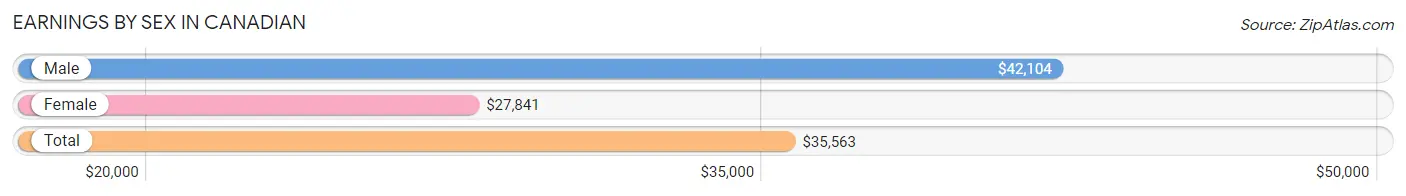
Earnings by Sex in Canadian
Average Earnings in Canadian are $35,563, $42,104 for men and $27,841 for women, a difference of 33.9%.
| Sex | Number | Average Earnings |
| Male | 787 (62.5%) | $42,104 |
| Female | 472 (37.5%) | $27,841 |
| Total | 1,259 (100.0%) | $35,563 |
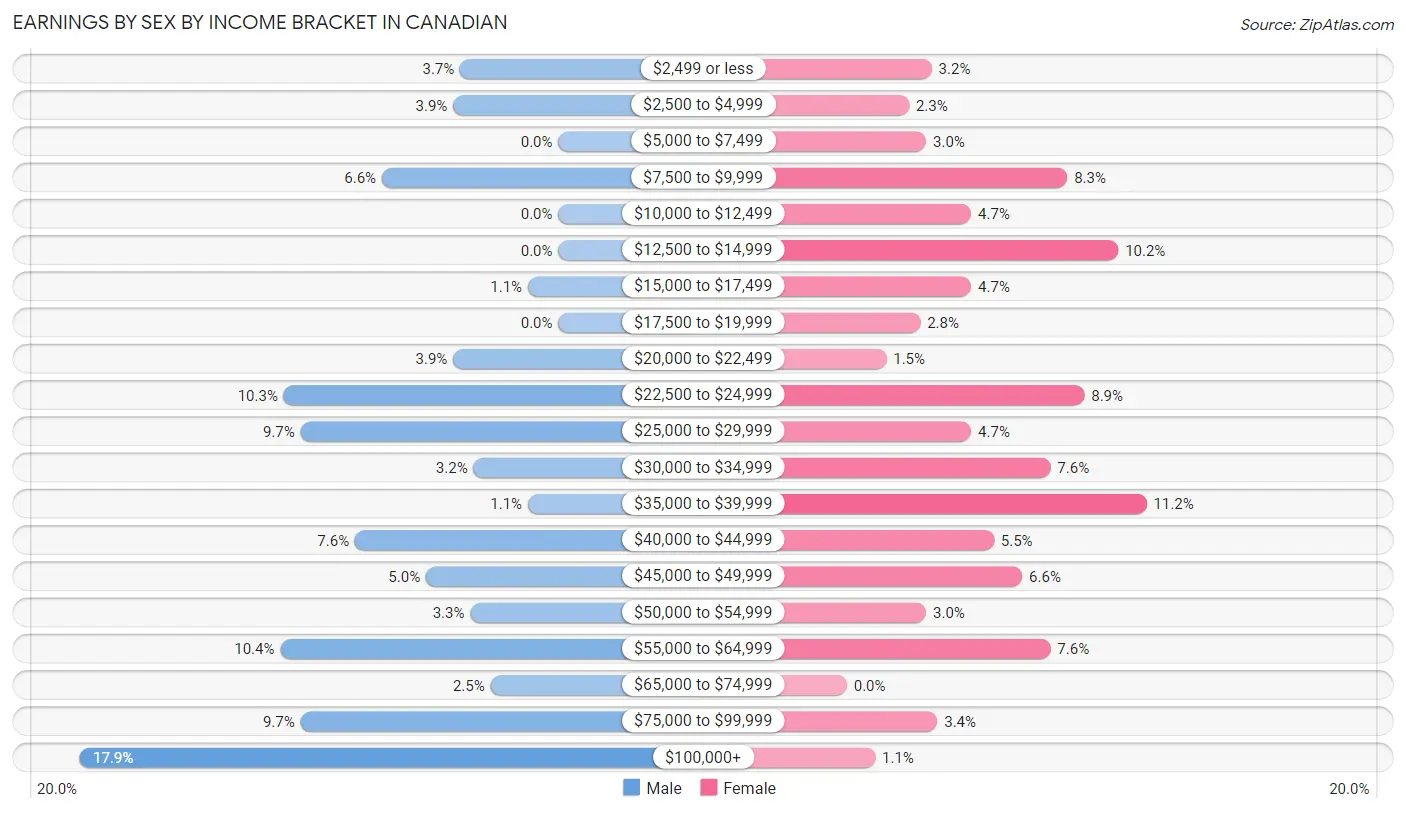
Earnings by Sex by Income Bracket in Canadian
The most common earnings brackets in Canadian are $100,000+ for men (141 | 17.9%) and $35,000 to $39,999 for women (53 | 11.2%).
| Income | Male | Female |
| $2,499 or less | 29 (3.7%) | 15 (3.2%) |
| $2,500 to $4,999 | 31 (3.9%) | 11 (2.3%) |
| $5,000 to $7,499 | 0 (0.0%) | 14 (3.0%) |
| $7,500 to $9,999 | 52 (6.6%) | 39 (8.3%) |
| $10,000 to $12,499 | 0 (0.0%) | 22 (4.7%) |
| $12,500 to $14,999 | 0 (0.0%) | 48 (10.2%) |
| $15,000 to $17,499 | 9 (1.1%) | 22 (4.7%) |
| $17,500 to $19,999 | 0 (0.0%) | 13 (2.8%) |
| $20,000 to $22,499 | 31 (3.9%) | 7 (1.5%) |
| $22,500 to $24,999 | 81 (10.3%) | 42 (8.9%) |
| $25,000 to $29,999 | 76 (9.7%) | 22 (4.7%) |
| $30,000 to $34,999 | 25 (3.2%) | 36 (7.6%) |
| $35,000 to $39,999 | 9 (1.1%) | 53 (11.2%) |
| $40,000 to $44,999 | 60 (7.6%) | 26 (5.5%) |
| $45,000 to $49,999 | 39 (5.0%) | 31 (6.6%) |
| $50,000 to $54,999 | 26 (3.3%) | 14 (3.0%) |
| $55,000 to $64,999 | 82 (10.4%) | 36 (7.6%) |
| $65,000 to $74,999 | 20 (2.5%) | 0 (0.0%) |
| $75,000 to $99,999 | 76 (9.7%) | 16 (3.4%) |
| $100,000+ | 141 (17.9%) | 5 (1.1%) |
| Total | 787 (100.0%) | 472 (100.0%) |
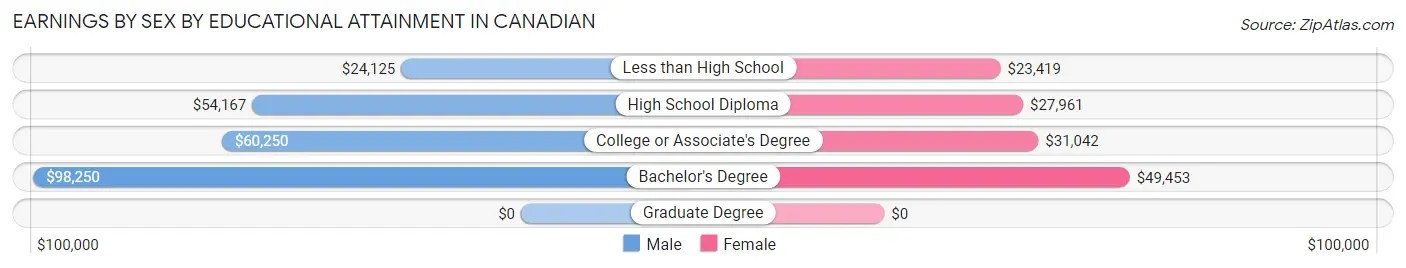
Earnings by Sex by Educational Attainment in Canadian
Average earnings in Canadian are $56,250 for men and $29,261 for women, a difference of 48.0%. Men with an educational attainment of bachelor's degree enjoy the highest average annual earnings of $98,250, while those with less than high school education earn the least with $24,125. Women with an educational attainment of bachelor's degree earn the most with the average annual earnings of $49,453, while those with less than high school education have the smallest earnings of $23,419.
| Educational Attainment | Male Income | Female Income |
| Less than High School | $24,125 | $23,419 |
| High School Diploma | $54,167 | $27,961 |
| College or Associate's Degree | $60,250 | $31,042 |
| Bachelor's Degree | $98,250 | $49,453 |
| Graduate Degree | - | - |
| Total | $56,250 | $29,261 |
Family Income in Canadian
Family Income Brackets in Canadian
According to the Canadian family income data, there are 152 families falling into the $100,000 to $149,999 income range, which is the most common income bracket and makes up 24.9% of all families.
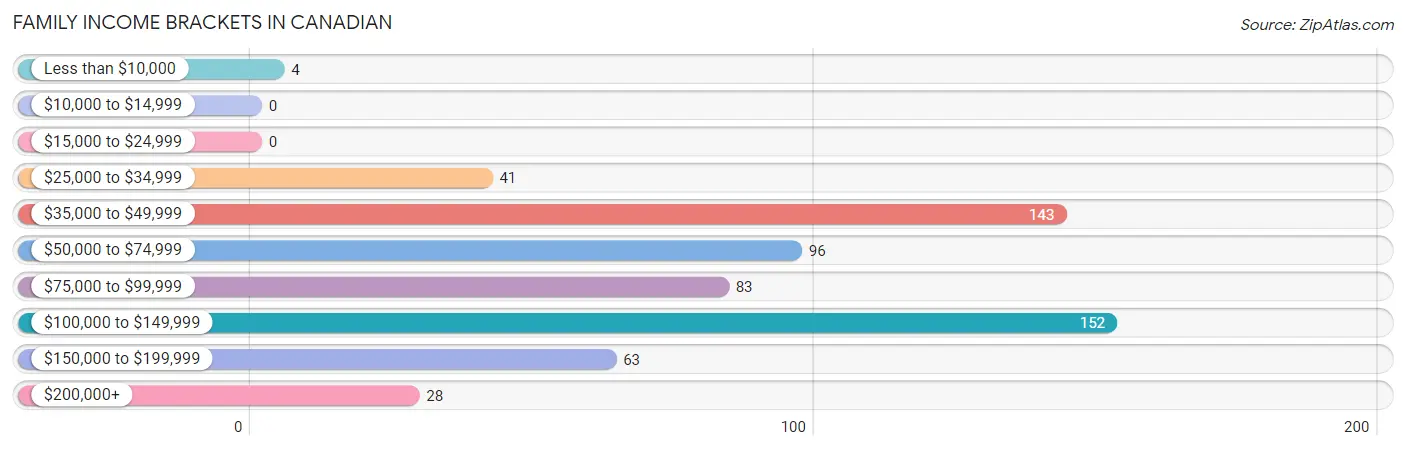
| Income Bracket | # Families | % Families |
| Less than $10,000 | 4 | 0.7% |
| $10,000 to $14,999 | 0 | 0.0% |
| $15,000 to $24,999 | 0 | 0.0% |
| $25,000 to $34,999 | 41 | 6.7% |
| $35,000 to $49,999 | 143 | 23.4% |
| $50,000 to $74,999 | 96 | 15.7% |
| $75,000 to $99,999 | 83 | 13.6% |
| $100,000 to $149,999 | 152 | 24.9% |
| $150,000 to $199,999 | 63 | 10.3% |
| $200,000+ | 28 | 4.6% |
Family Income by Famaliy Size in Canadian
5-person families (56 | 9.2%) account for the highest median family income in Canadian with $116,250 per family, while 2-person families (202 | 33.1%) have the highest median income of $56,786 per family member.
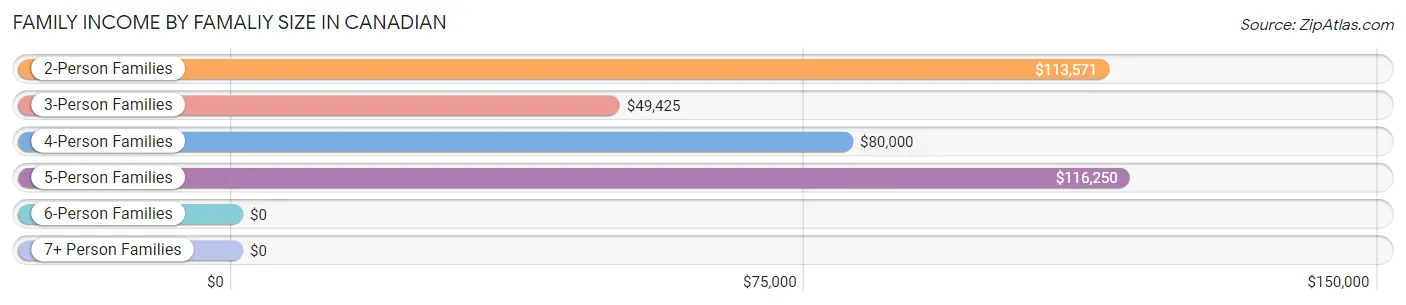
| Income Bracket | # Families | Median Income |
| 2-Person Families | 202 (33.1%) | $113,571 |
| 3-Person Families | 155 (25.4%) | $49,425 |
| 4-Person Families | 166 (27.2%) | $80,000 |
| 5-Person Families | 56 (9.2%) | $116,250 |
| 6-Person Families | 25 (4.1%) | $0 |
| 7+ Person Families | 6 (1.0%) | $0 |
| Total | 610 (100.0%) | $76,875 |
Family Income by Number of Earners in Canadian
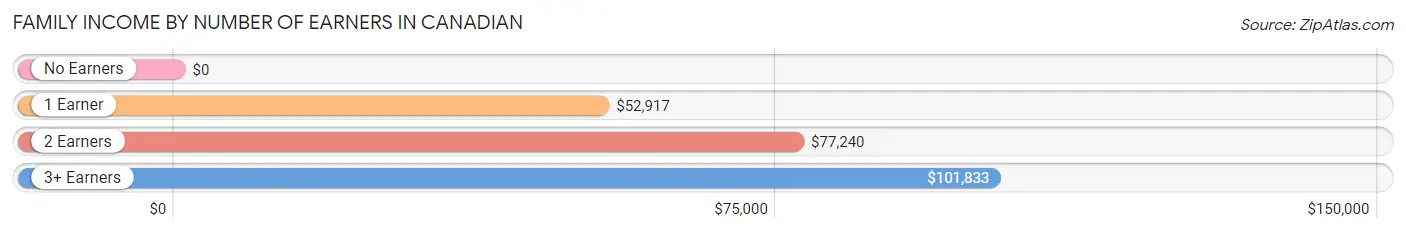
| Number of Earners | # Families | Median Income |
| No Earners | 36 (5.9%) | $0 |
| 1 Earner | 163 (26.7%) | $52,917 |
| 2 Earners | 357 (58.5%) | $77,240 |
| 3+ Earners | 54 (8.8%) | $101,833 |
| Total | 610 (100.0%) | $76,875 |
Household Income in Canadian
Household Income Brackets in Canadian
With 192 households falling in the category, the $35,000 to $49,999 income range is the most frequent in Canadian, accounting for 22.2% of all households.
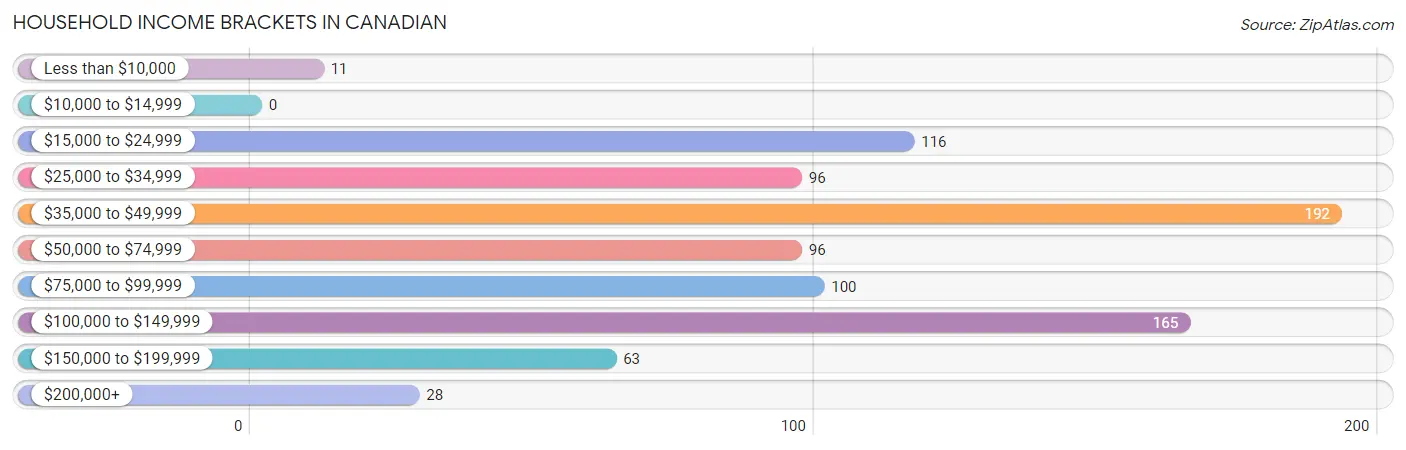
| Income Bracket | # Households | % Households |
| Less than $10,000 | 11 | 1.3% |
| $10,000 to $14,999 | 0 | 0.0% |
| $15,000 to $24,999 | 116 | 13.4% |
| $25,000 to $34,999 | 96 | 11.1% |
| $35,000 to $49,999 | 192 | 22.1% |
| $50,000 to $74,999 | 96 | 11.1% |
| $75,000 to $99,999 | 100 | 11.5% |
| $100,000 to $149,999 | 165 | 19.0% |
| $150,000 to $199,999 | 63 | 7.3% |
| $200,000+ | 28 | 3.2% |
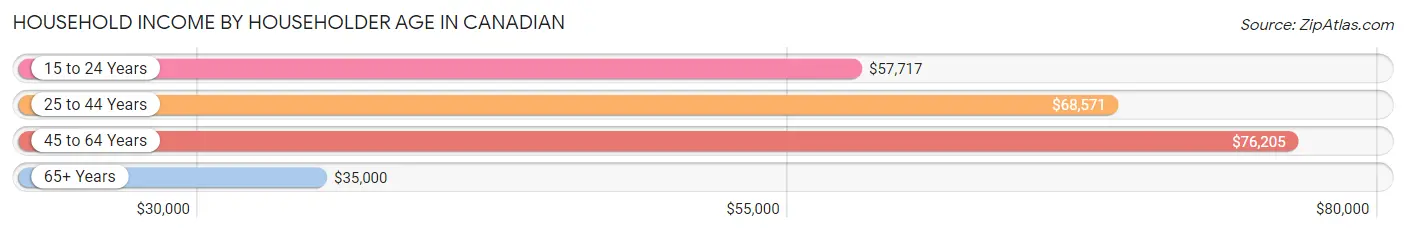
Household Income by Householder Age in Canadian
The median household income in Canadian is $54,013, with the highest median household income of $76,205 found in the 45 to 64 years age bracket for the primary householder. A total of 293 households (33.8%) fall into this category. Meanwhile, the 65+ years age bracket for the primary householder has the lowest median household income of $35,000, with 184 households (21.2%) in this group.
| Income Bracket | # Households | Median Income |
| 15 to 24 Years | 42 (4.8%) | $57,717 |
| 25 to 44 Years | 348 (40.1%) | $68,571 |
| 45 to 64 Years | 293 (33.8%) | $76,205 |
| 65+ Years | 184 (21.2%) | $35,000 |
| Total | 867 (100.0%) | $54,013 |
Poverty in Canadian
Income Below Poverty by Sex and Age in Canadian
With 8.5% poverty level for males and 7.0% for females among the residents of Canadian, 12 to 14 year old males and 6 to 11 year old females are the most vulnerable to poverty, with 24 males (48.0%) and 21 females (24.4%) in their respective age groups living below the poverty level.
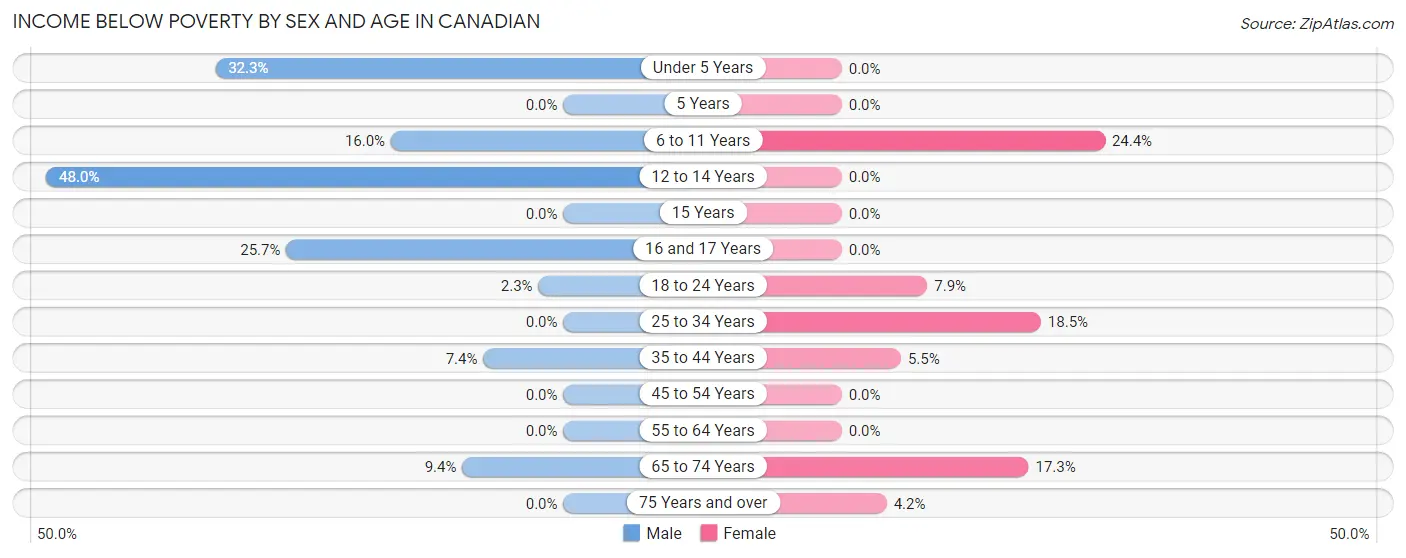
| Age Bracket | Male | Female |
| Under 5 Years | 21 (32.3%) | 0 (0.0%) |
| 5 Years | 0 (0.0%) | 0 (0.0%) |
| 6 to 11 Years | 24 (16.0%) | 21 (24.4%) |
| 12 to 14 Years | 24 (48.0%) | 0 (0.0%) |
| 15 Years | 0 (0.0%) | 0 (0.0%) |
| 16 and 17 Years | 9 (25.7%) | 0 (0.0%) |
| 18 to 24 Years | 4 (2.3%) | 5 (7.9%) |
| 25 to 34 Years | 0 (0.0%) | 17 (18.5%) |
| 35 to 44 Years | 20 (7.4%) | 9 (5.5%) |
| 45 to 54 Years | 0 (0.0%) | 0 (0.0%) |
| 55 to 64 Years | 0 (0.0%) | 0 (0.0%) |
| 65 to 74 Years | 9 (9.4%) | 13 (17.3%) |
| 75 Years and over | 0 (0.0%) | 3 (4.2%) |
| Total | 111 (8.5%) | 68 (7.0%) |
Income Above Poverty by Sex and Age in Canadian
According to the poverty statistics in Canadian, males aged 5 years and females aged under 5 years are the age groups that are most secure financially, with 100.0% of males and 100.0% of females in these age groups living above the poverty line.
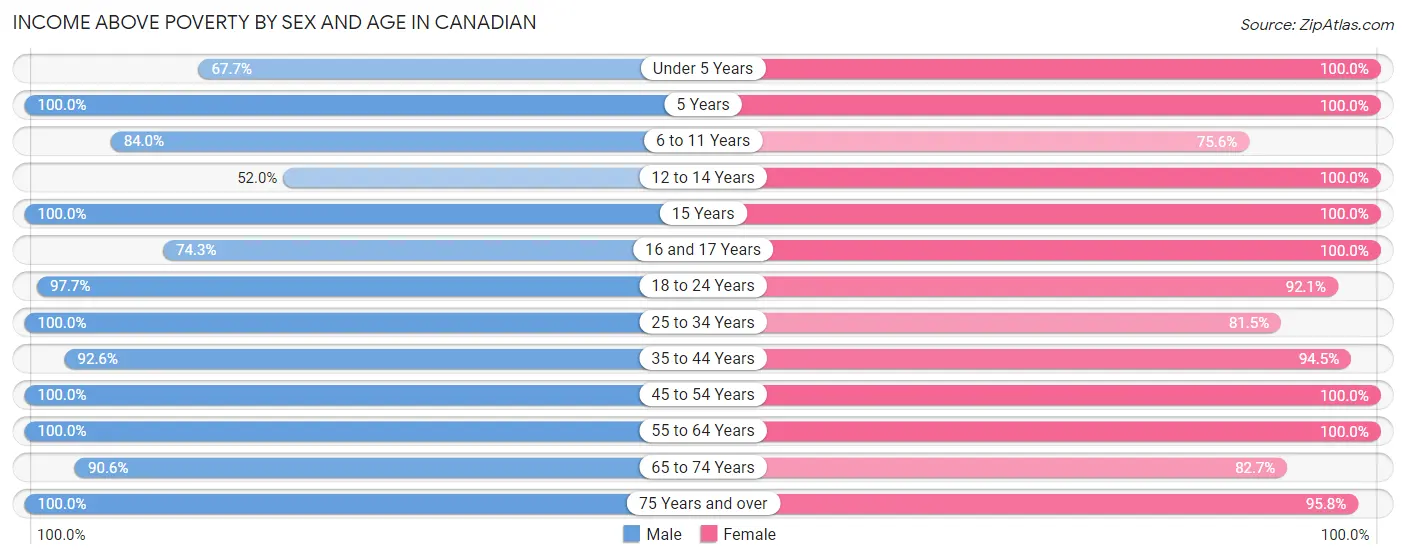
| Age Bracket | Male | Female |
| Under 5 Years | 44 (67.7%) | 48 (100.0%) |
| 5 Years | 6 (100.0%) | 3 (100.0%) |
| 6 to 11 Years | 126 (84.0%) | 65 (75.6%) |
| 12 to 14 Years | 26 (52.0%) | 76 (100.0%) |
| 15 Years | 52 (100.0%) | 24 (100.0%) |
| 16 and 17 Years | 26 (74.3%) | 14 (100.0%) |
| 18 to 24 Years | 169 (97.7%) | 58 (92.1%) |
| 25 to 34 Years | 54 (100.0%) | 75 (81.5%) |
| 35 to 44 Years | 249 (92.6%) | 155 (94.5%) |
| 45 to 54 Years | 161 (100.0%) | 197 (100.0%) |
| 55 to 64 Years | 163 (100.0%) | 56 (100.0%) |
| 65 to 74 Years | 87 (90.6%) | 62 (82.7%) |
| 75 Years and over | 37 (100.0%) | 69 (95.8%) |
| Total | 1,200 (91.5%) | 902 (93.0%) |
Income Below Poverty Among Married-Couple Families in Canadian
The poverty statistics for married-couple families in Canadian show that 5.4% or 24 of the total 445 families live below the poverty line. Families with 3 or 4 children have the highest poverty rate of 30.3%, comprising of 20 families. On the other hand, families with 1 or 2 children have the lowest poverty rate of 0.0%, which includes 0 families.
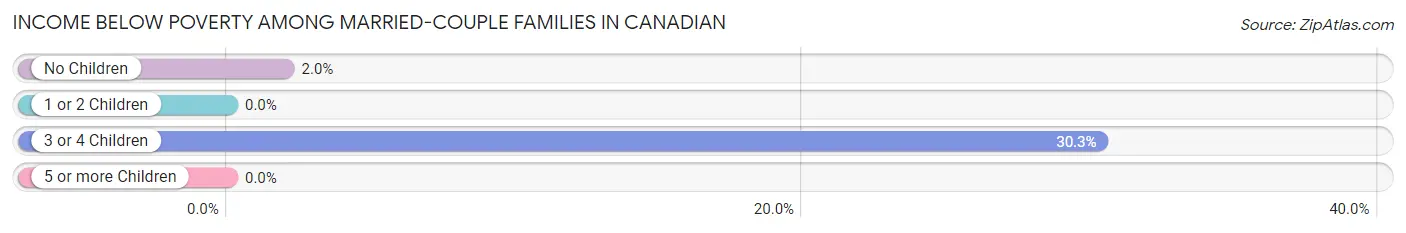
| Children | Above Poverty | Below Poverty |
| No Children | 199 (98.0%) | 4 (2.0%) |
| 1 or 2 Children | 176 (100.0%) | 0 (0.0%) |
| 3 or 4 Children | 46 (69.7%) | 20 (30.3%) |
| 5 or more Children | 0 (0.0%) | 0 (0.0%) |
| Total | 421 (94.6%) | 24 (5.4%) |
Income Below Poverty Among Single-Parent Households in Canadian
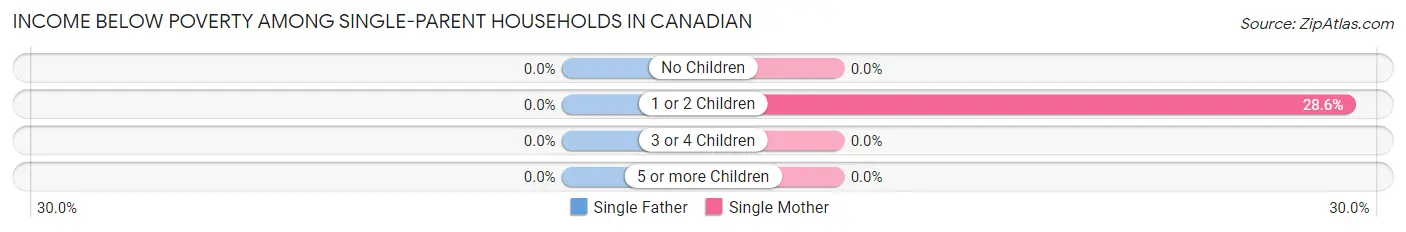
| Children | Single Father | Single Mother |
| No Children | 0 (0.0%) | 0 (0.0%) |
| 1 or 2 Children | 0 (0.0%) | 6 (28.6%) |
| 3 or 4 Children | 0 (0.0%) | 0 (0.0%) |
| 5 or more Children | 0 (0.0%) | 0 (0.0%) |
| Total | 0 (0.0%) | 6 (14.3%) |
Income Below Poverty Among Married-Couple vs Single-Parent Households in Canadian
The poverty data for Canadian shows that 24 of the married-couple family households (5.4%) and 6 of the single-parent households (3.6%) are living below the poverty level. Within the married-couple family households, those with 3 or 4 children have the highest poverty rate, with 20 households (30.3%) falling below the poverty line. Among the single-parent households, those with 1 or 2 children have the highest poverty rate, with 6 household (6.4%) living below poverty.
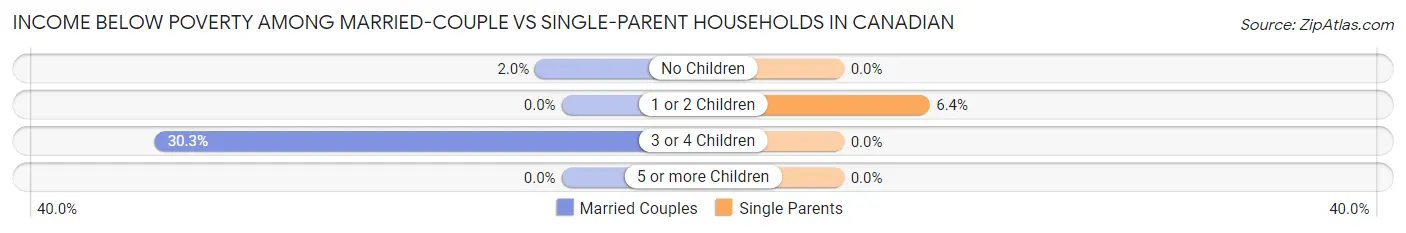
| Children | Married-Couple Families | Single-Parent Households |
| No Children | 4 (2.0%) | 0 (0.0%) |
| 1 or 2 Children | 0 (0.0%) | 6 (6.4%) |
| 3 or 4 Children | 20 (30.3%) | 0 (0.0%) |
| 5 or more Children | 0 (0.0%) | 0 (0.0%) |
| Total | 24 (5.4%) | 6 (3.6%) |
Race in Canadian
The most populous races in Canadian are White / Caucasian (1,682 | 72.2%), Hispanic or Latino (1,135 | 48.7%), and Some other Race (322 | 13.8%).
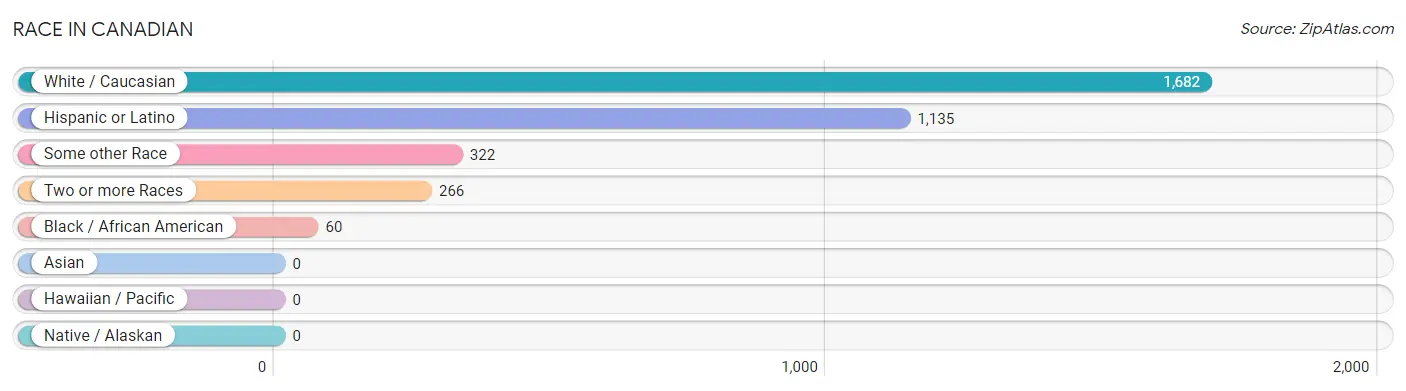
| Race | # Population | % Population |
| Asian | 0 | 0.0% |
| Black / African American | 60 | 2.6% |
| Hawaiian / Pacific | 0 | 0.0% |
| Hispanic or Latino | 1,135 | 48.7% |
| Native / Alaskan | 0 | 0.0% |
| White / Caucasian | 1,682 | 72.2% |
| Two or more Races | 266 | 11.4% |
| Some other Race | 322 | 13.8% |
| Total | 2,330 | 100.0% |
Ancestry in Canadian
The most populous ancestries reported in Canadian are Mexican (1,065 | 45.7%), German (398 | 17.1%), Irish (173 | 7.4%), American (102 | 4.4%), and English (91 | 3.9%), together accounting for 78.5% of all Canadian residents.
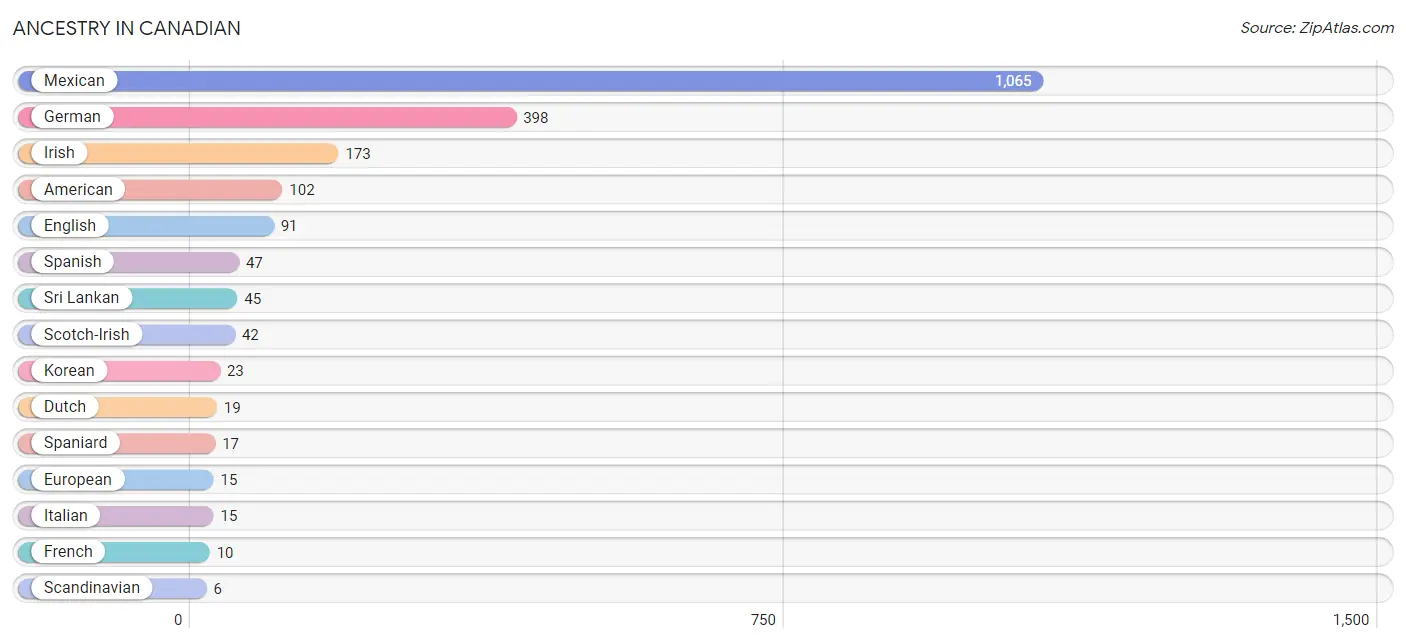
| Ancestry | # Population | % Population |
| African | 4 | 0.2% |
| American | 102 | 4.4% |
| Czech | 3 | 0.1% |
| Dutch | 19 | 0.8% |
| English | 91 | 3.9% |
| European | 15 | 0.6% |
| French | 10 | 0.4% |
| German | 398 | 17.1% |
| Irish | 173 | 7.4% |
| Italian | 15 | 0.6% |
| Korean | 23 | 1.0% |
| Mexican | 1,065 | 45.7% |
| Scandinavian | 6 | 0.3% |
| Scotch-Irish | 42 | 1.8% |
| Scottish | 4 | 0.2% |
| Spaniard | 17 | 0.7% |
| Spanish | 47 | 2.0% |
| Sri Lankan | 45 | 1.9% |
| Subsaharan African | 4 | 0.2% |
| Welsh | 5 | 0.2% | View All 20 Rows |
Immigrants in Canadian
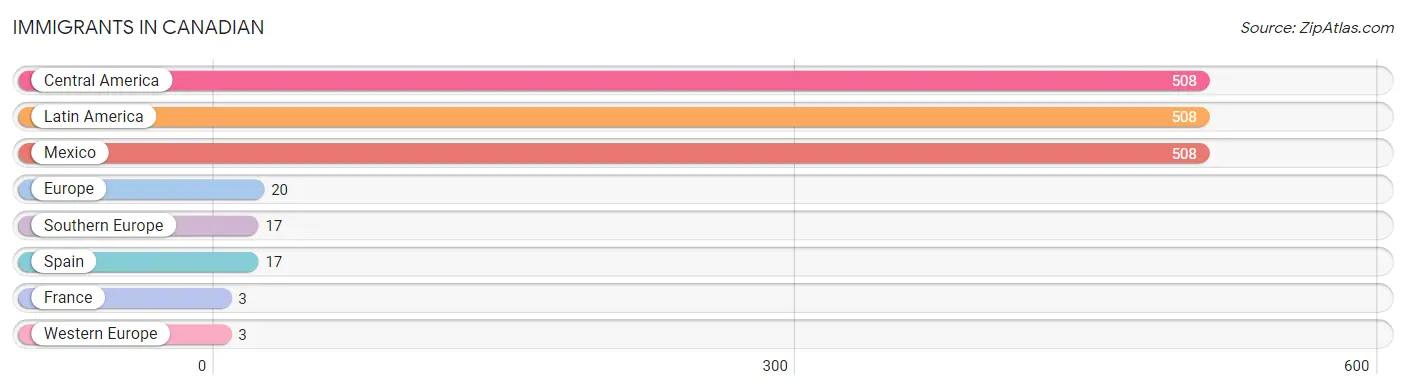
The most numerous immigrant groups reported in Canadian came from Central America (508 | 21.8%), Latin America (508 | 21.8%), Mexico (508 | 21.8%), Europe (20 | 0.9%), and Southern Europe (17 | 0.7%), together accounting for 67.0% of all Canadian residents.
| Immigration Origin | # Population | % Population |
| Central America | 508 | 21.8% |
| Europe | 20 | 0.9% |
| France | 3 | 0.1% |
| Latin America | 508 | 21.8% |
| Mexico | 508 | 21.8% |
| Southern Europe | 17 | 0.7% |
| Spain | 17 | 0.7% |
| Western Europe | 3 | 0.1% | View All 8 Rows |
Sex and Age in Canadian
Sex and Age in Canadian
The most populous age groups in Canadian are 40 to 44 Years (150 | 11.2%) for men and 10 to 14 Years (110 | 11.1%) for women.
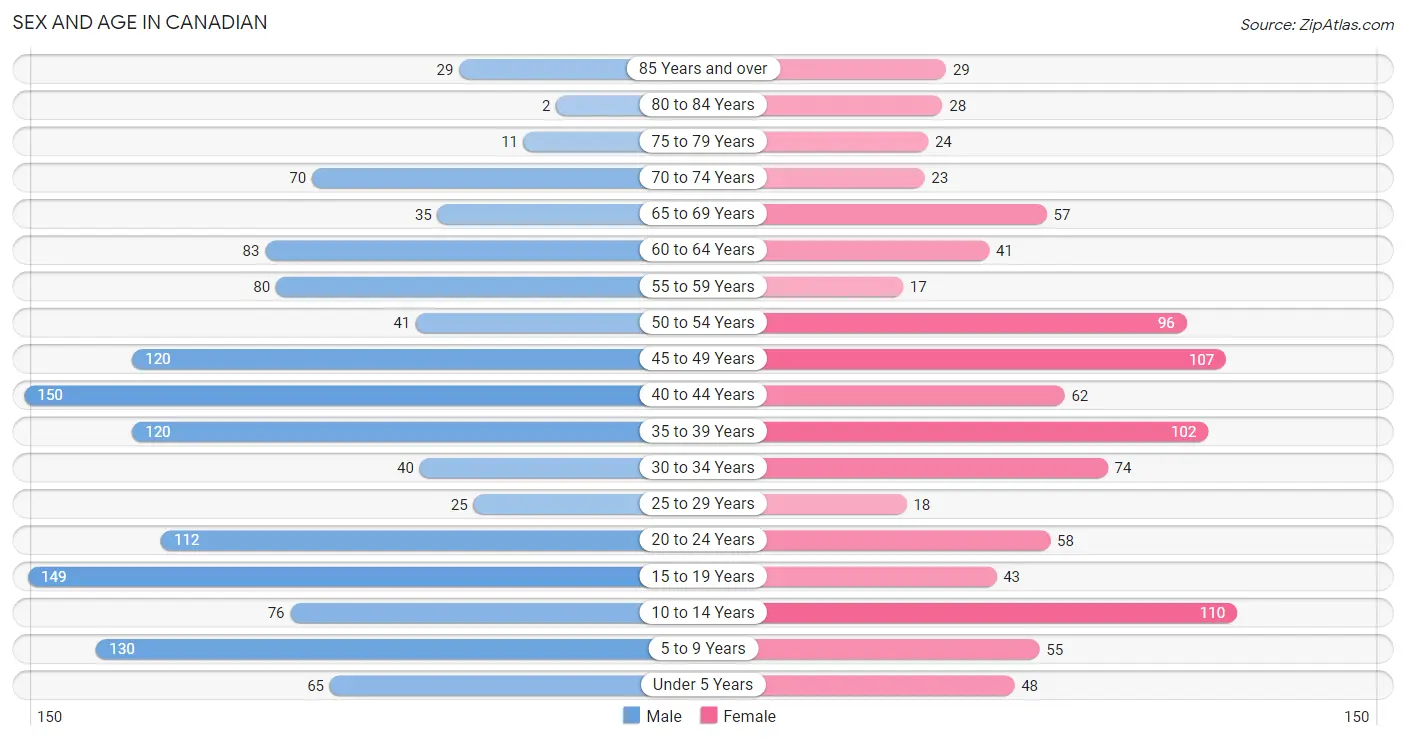
| Age Bracket | Male | Female |
| Under 5 Years | 65 (4.9%) | 48 (4.8%) |
| 5 to 9 Years | 130 (9.7%) | 55 (5.5%) |
| 10 to 14 Years | 76 (5.7%) | 110 (11.1%) |
| 15 to 19 Years | 149 (11.1%) | 43 (4.3%) |
| 20 to 24 Years | 112 (8.4%) | 58 (5.9%) |
| 25 to 29 Years | 25 (1.9%) | 18 (1.8%) |
| 30 to 34 Years | 40 (3.0%) | 74 (7.5%) |
| 35 to 39 Years | 120 (9.0%) | 102 (10.3%) |
| 40 to 44 Years | 150 (11.2%) | 62 (6.2%) |
| 45 to 49 Years | 120 (9.0%) | 107 (10.8%) |
| 50 to 54 Years | 41 (3.1%) | 96 (9.7%) |
| 55 to 59 Years | 80 (6.0%) | 17 (1.7%) |
| 60 to 64 Years | 83 (6.2%) | 41 (4.1%) |
| 65 to 69 Years | 35 (2.6%) | 57 (5.8%) |
| 70 to 74 Years | 70 (5.2%) | 23 (2.3%) |
| 75 to 79 Years | 11 (0.8%) | 24 (2.4%) |
| 80 to 84 Years | 2 (0.2%) | 28 (2.8%) |
| 85 Years and over | 29 (2.2%) | 29 (2.9%) |
| Total | 1,338 (100.0%) | 992 (100.0%) |
Families and Households in Canadian
Median Family Size in Canadian
The median family size in Canadian is 3.31 persons per family, with married-couple families (445 | 73.0%) accounting for the largest median family size of 3.51 persons per family. On the other hand, single female/mother families (42 | 6.9%) represent the smallest median family size with 2.57 persons per family.
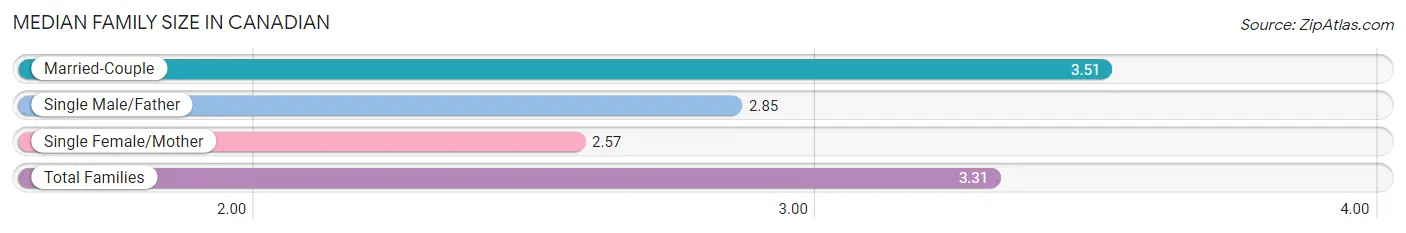
| Family Type | # Families | Family Size |
| Married-Couple | 445 (73.0%) | 3.51 |
| Single Male/Father | 123 (20.2%) | 2.85 |
| Single Female/Mother | 42 (6.9%) | 2.57 |
| Total Families | 610 (100.0%) | 3.31 |
Median Household Size in Canadian
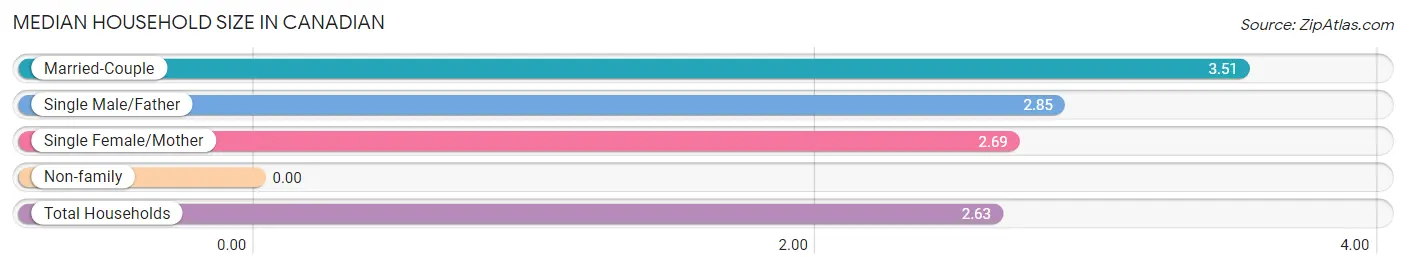
| Household Type | # Households | Household Size |
| Married-Couple | 445 (51.3%) | 3.51 |
| Single Male/Father | 123 (14.2%) | 2.85 |
| Single Female/Mother | 42 (4.8%) | 2.69 |
| Non-family | 257 (29.6%) | - |
| Total Households | 867 (100.0%) | 2.63 |
Household Size by Marriage Status in Canadian
Out of a total of 867 households in Canadian, 610 (70.4%) are family households, while 257 (29.6%) are nonfamily households. The most numerous type of family households are 2-person households, comprising 196, and the most common type of nonfamily households are 1-person households, comprising 257.
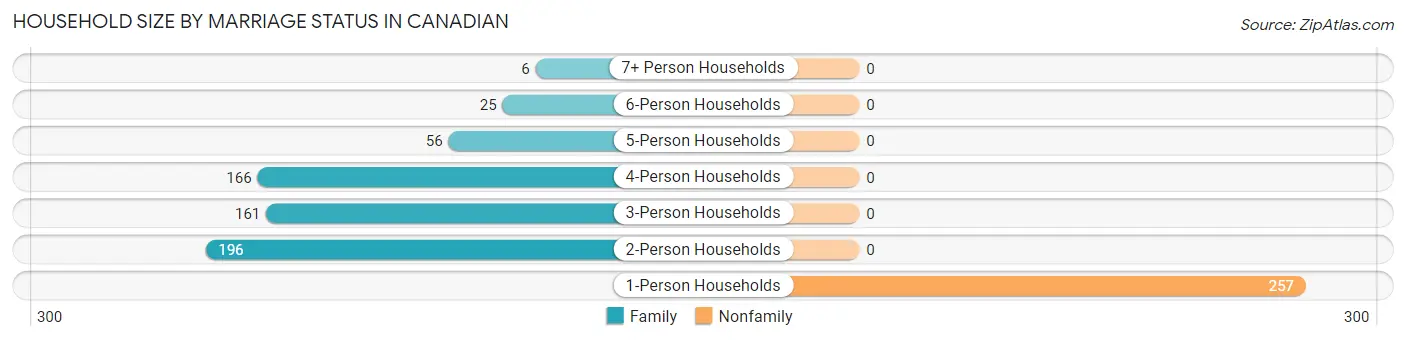
| Household Size | Family Households | Nonfamily Households |
| 1-Person Households | - | 257 (29.6%) |
| 2-Person Households | 196 (22.6%) | 0 (0.0%) |
| 3-Person Households | 161 (18.6%) | 0 (0.0%) |
| 4-Person Households | 166 (19.2%) | 0 (0.0%) |
| 5-Person Households | 56 (6.5%) | 0 (0.0%) |
| 6-Person Households | 25 (2.9%) | 0 (0.0%) |
| 7+ Person Households | 6 (0.7%) | 0 (0.0%) |
| Total | 610 (70.4%) | 257 (29.6%) |
Female Fertility in Canadian
Fertility by Age in Canadian
Average fertility rate in Canadian is 55.0 births per 1,000 women. Women in the age bracket of 20 to 34 years have the highest fertility rate with 133.0 births per 1,000 women. Women in the age bracket of 20 to 34 years acount for 74.1% of all women with births.
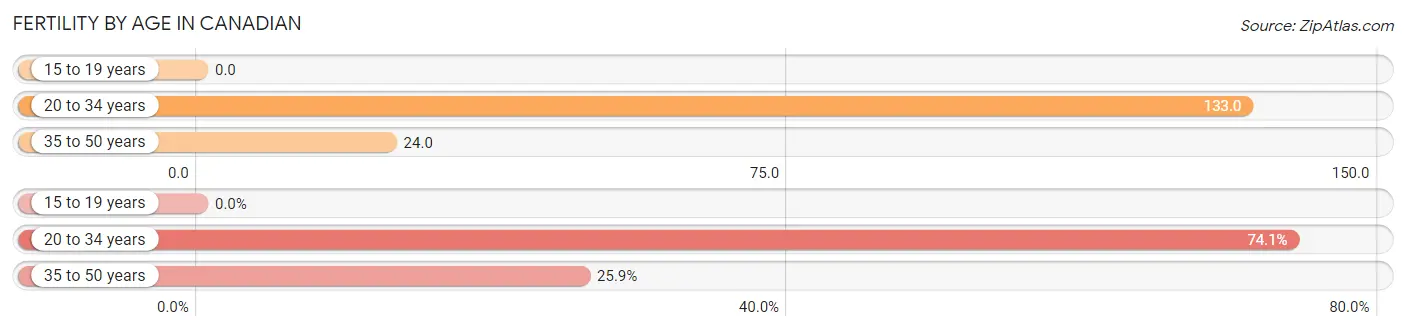
| Age Bracket | Women with Births | Births / 1,000 Women |
| 15 to 19 years | 0 (0.0%) | 0.0 |
| 20 to 34 years | 20 (74.1%) | 133.0 |
| 35 to 50 years | 7 (25.9%) | 24.0 |
| Total | 27 (100.0%) | 55.0 |
Fertility by Age by Marriage Status in Canadian
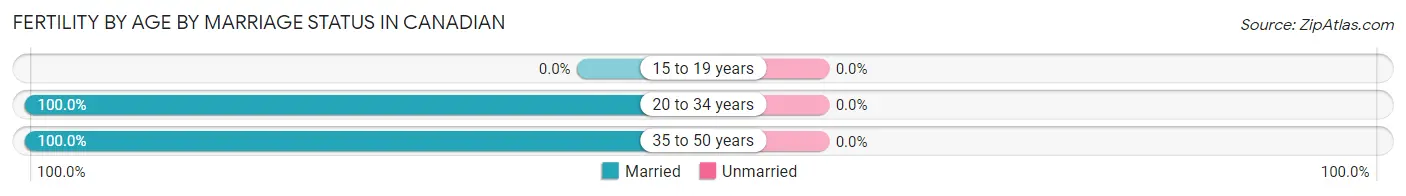
| Age Bracket | Married | Unmarried |
| 15 to 19 years | 0 (0.0%) | 0 (0.0%) |
| 20 to 34 years | 20 (100.0%) | 0 (0.0%) |
| 35 to 50 years | 7 (100.0%) | 0 (0.0%) |
| Total | 27 (100.0%) | 0 (0.0%) |
Fertility by Education in Canadian
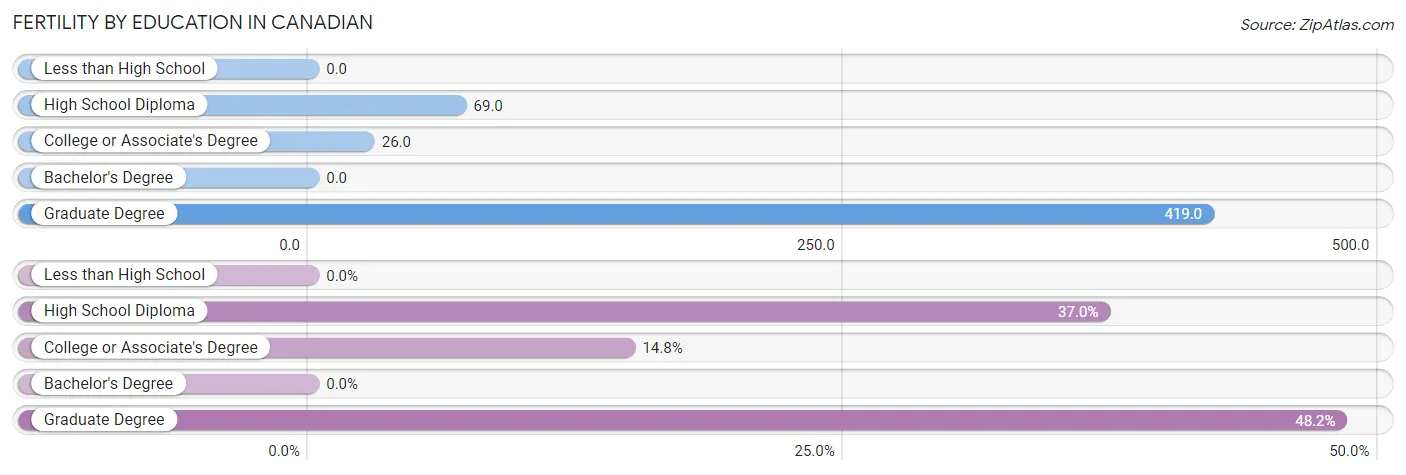
| Educational Attainment | Women with Births | Births / 1,000 Women |
| Less than High School | 0 (0.0%) | 0.0 |
| High School Diploma | 10 (37.0%) | 69.0 |
| College or Associate's Degree | 4 (14.8%) | 26.0 |
| Bachelor's Degree | 0 (0.0%) | 0.0 |
| Graduate Degree | 13 (48.1%) | 419.0 |
| Total | 27 (100.0%) | 55.0 |
Fertility by Education by Marriage Status in Canadian
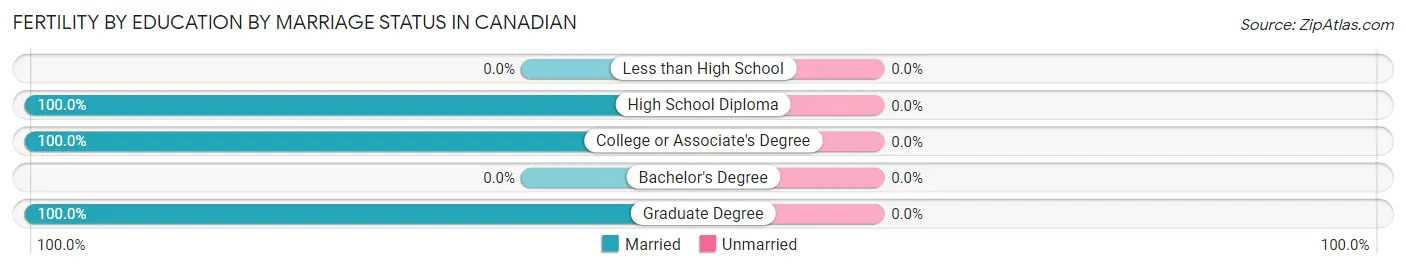
| Educational Attainment | Married | Unmarried |
| Less than High School | 0 (0.0%) | 0 (0.0%) |
| High School Diploma | 10 (100.0%) | 0 (0.0%) |
| College or Associate's Degree | 4 (100.0%) | 0 (0.0%) |
| Bachelor's Degree | 0 (0.0%) | 0 (0.0%) |
| Graduate Degree | 13 (100.0%) | 0 (0.0%) |
| Total | 27 (100.0%) | 0 (0.0%) |
Employment Characteristics in Canadian
Employment by Class of Employer in Canadian
Among the 1,115 employed individuals in Canadian, private company employees (694 | 62.2%), local government employees (212 | 19.0%), and self-employed (not incorporated) (85 | 7.6%) make up the most common classes of employment.
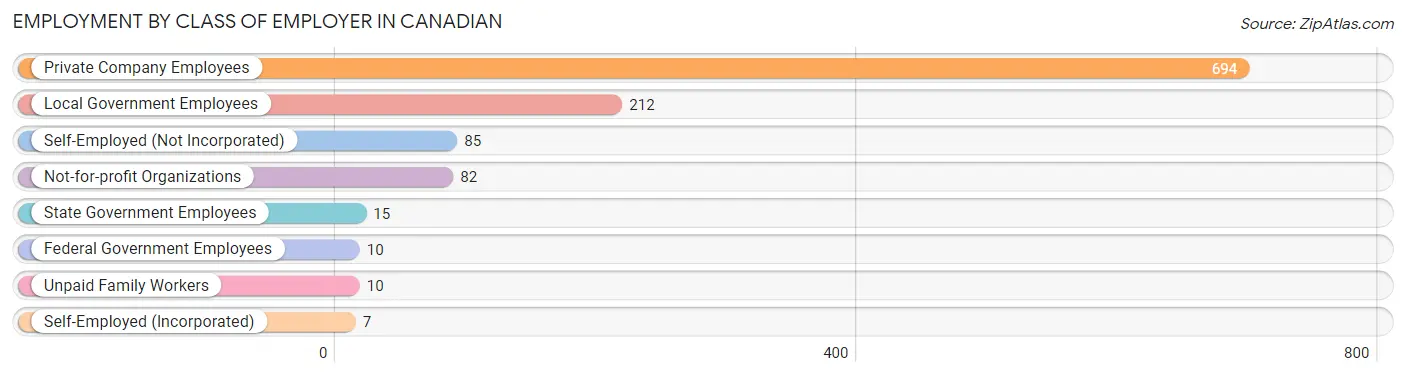
| Employer Class | # Employees | % Employees |
| Private Company Employees | 694 | 62.2% |
| Self-Employed (Incorporated) | 7 | 0.6% |
| Self-Employed (Not Incorporated) | 85 | 7.6% |
| Not-for-profit Organizations | 82 | 7.3% |
| Local Government Employees | 212 | 19.0% |
| State Government Employees | 15 | 1.3% |
| Federal Government Employees | 10 | 0.9% |
| Unpaid Family Workers | 10 | 0.9% |
| Total | 1,115 | 100.0% |
Employment Status by Age in Canadian
According to the labor force statistics for Canadian, out of the total population over 16 years of age (1,770), 66.2% or 1,172 individuals are in the labor force, with 3.5% or 41 of them unemployed. The age group with the highest labor force participation rate is 20 to 24 years, with 89.4% or 152 individuals in the labor force. Within the labor force, the 16 to 19 years age range has the highest percentage of unemployed individuals, with 66.7% or 14 of them being unemployed.
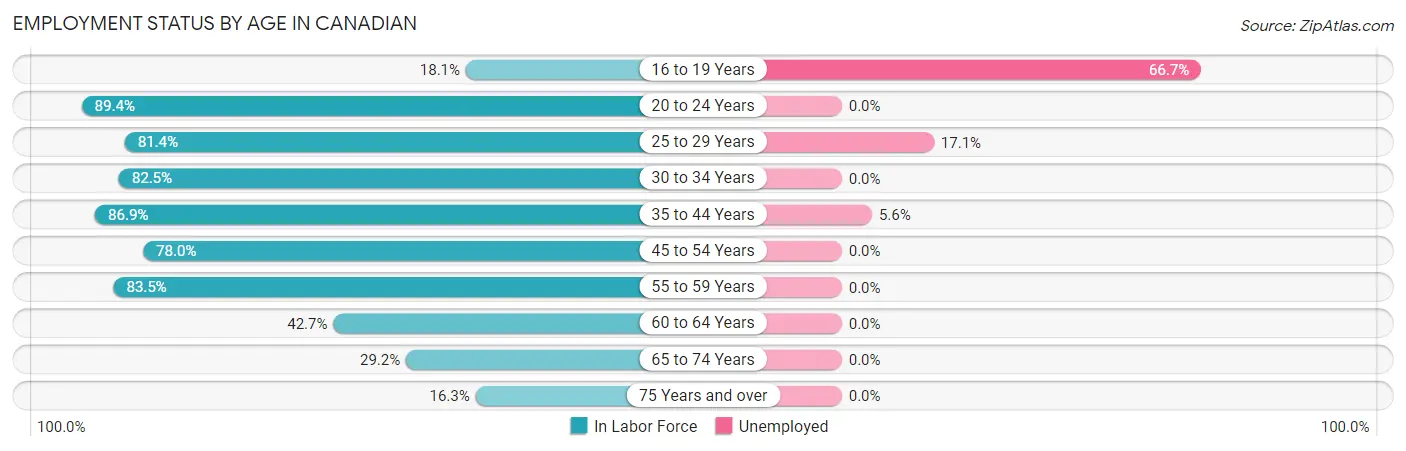
| Age Bracket | In Labor Force | Unemployed |
| 16 to 19 Years | 21 (18.1%) | 14 (66.7%) |
| 20 to 24 Years | 152 (89.4%) | 0 (0.0%) |
| 25 to 29 Years | 35 (81.4%) | 6 (17.1%) |
| 30 to 34 Years | 94 (82.5%) | 0 (0.0%) |
| 35 to 44 Years | 377 (86.9%) | 21 (5.6%) |
| 45 to 54 Years | 284 (78.0%) | 0 (0.0%) |
| 55 to 59 Years | 81 (83.5%) | 0 (0.0%) |
| 60 to 64 Years | 53 (42.7%) | 0 (0.0%) |
| 65 to 74 Years | 54 (29.2%) | 0 (0.0%) |
| 75 Years and over | 20 (16.3%) | 0 (0.0%) |
| Total | 1,172 (66.2%) | 41 (3.5%) |
Employment Status by Educational Attainment in Canadian
According to labor force statistics for Canadian, 78.6% of individuals (924) out of the total population between 25 and 64 years of age (1,176) are in the labor force, with 2.9% or 27 of them being unemployed. The group with the highest labor force participation rate are those with the educational attainment of bachelor's degree or higher, with 93.0% or 160 individuals in the labor force. Within the labor force, individuals with high school diploma education have the highest percentage of unemployment, with 7.5% or 27 of them being unemployed.
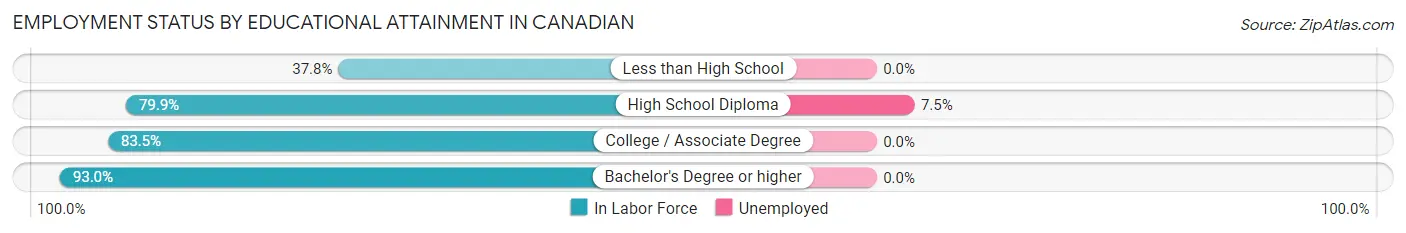
| Educational Attainment | In Labor Force | Unemployed |
| Less than High School | 48 (37.8%) | 0 (0.0%) |
| High School Diploma | 362 (79.9%) | 34 (7.5%) |
| College / Associate Degree | 354 (83.5%) | 0 (0.0%) |
| Bachelor's Degree or higher | 160 (93.0%) | 0 (0.0%) |
| Total | 924 (78.6%) | 34 (2.9%) |
Employment Occupations by Sex in Canadian
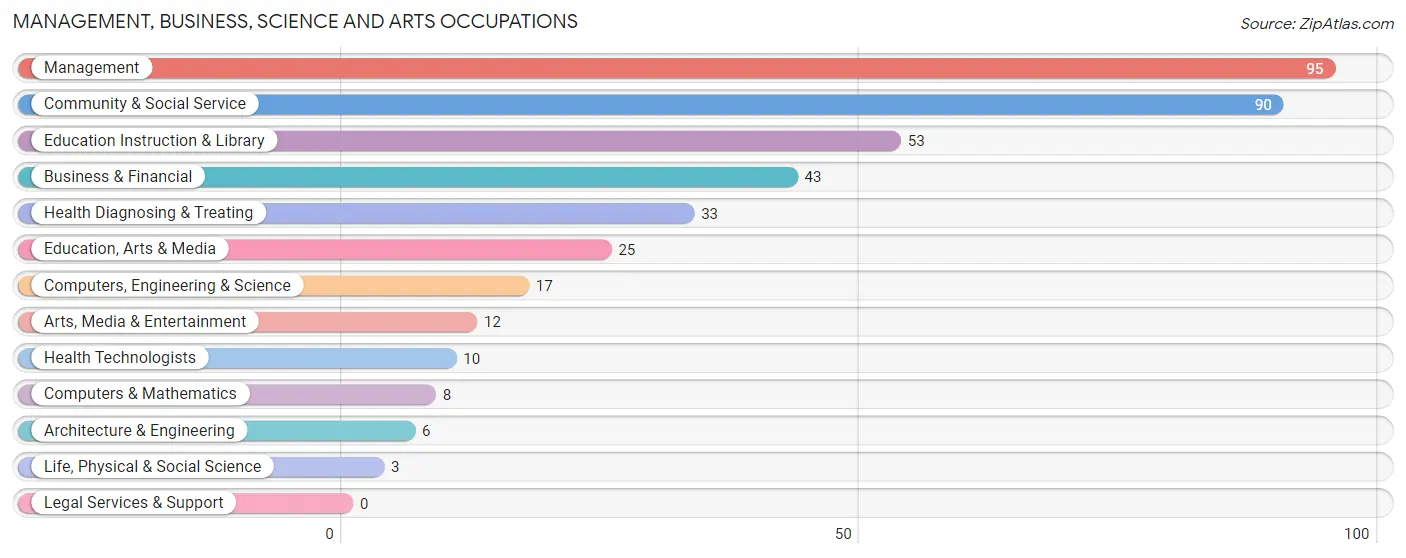
Management, Business, Science and Arts Occupations
The most common Management, Business, Science and Arts occupations in Canadian are Management (95 | 8.4%), Community & Social Service (90 | 8.0%), Education Instruction & Library (53 | 4.7%), Business & Financial (43 | 3.8%), and Health Diagnosing & Treating (33 | 2.9%).
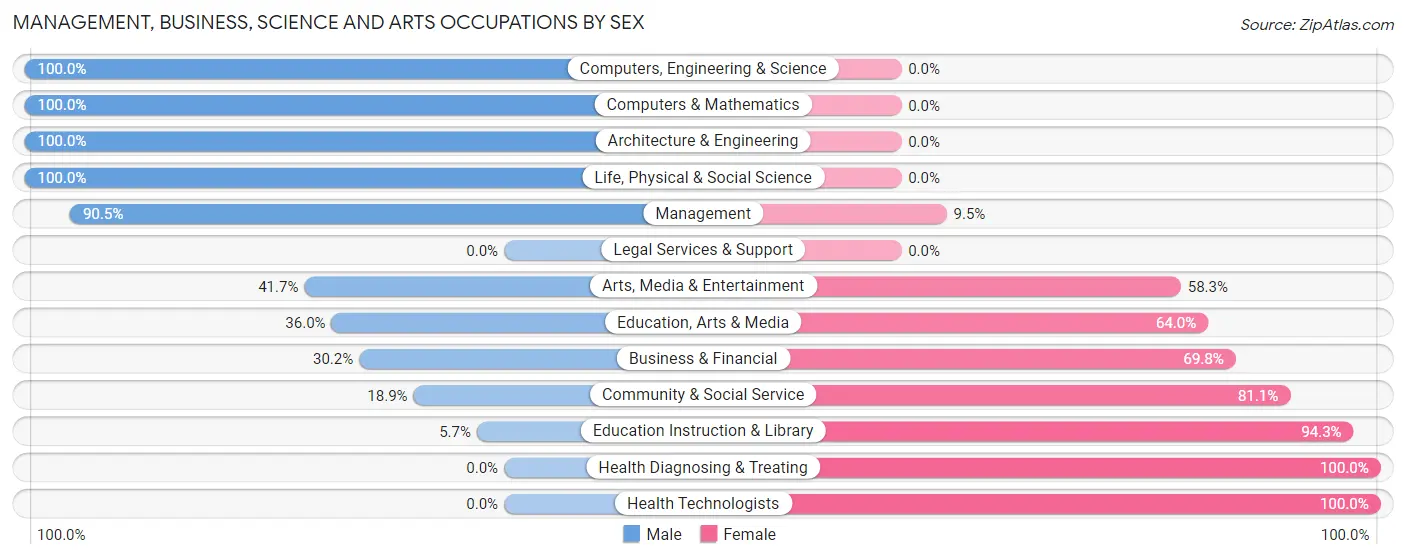
Management, Business, Science and Arts Occupations by Sex
Within the Management, Business, Science and Arts occupations in Canadian, the most male-oriented occupations are Computers, Engineering & Science (100.0%), Computers & Mathematics (100.0%), and Architecture & Engineering (100.0%), while the most female-oriented occupations are Health Diagnosing & Treating (100.0%), Health Technologists (100.0%), and Education Instruction & Library (94.3%).
| Occupation | Male | Female |
| Management | 86 (90.5%) | 9 (9.5%) |
| Business & Financial | 13 (30.2%) | 30 (69.8%) |
| Computers, Engineering & Science | 17 (100.0%) | 0 (0.0%) |
| Computers & Mathematics | 8 (100.0%) | 0 (0.0%) |
| Architecture & Engineering | 6 (100.0%) | 0 (0.0%) |
| Life, Physical & Social Science | 3 (100.0%) | 0 (0.0%) |
| Community & Social Service | 17 (18.9%) | 73 (81.1%) |
| Education, Arts & Media | 9 (36.0%) | 16 (64.0%) |
| Legal Services & Support | 0 (0.0%) | 0 (0.0%) |
| Education Instruction & Library | 3 (5.7%) | 50 (94.3%) |
| Arts, Media & Entertainment | 5 (41.7%) | 7 (58.3%) |
| Health Diagnosing & Treating | 0 (0.0%) | 33 (100.0%) |
| Health Technologists | 0 (0.0%) | 10 (100.0%) |
| Total (Category) | 133 (47.8%) | 145 (52.2%) |
| Total (Overall) | 673 (59.6%) | 457 (40.4%) |
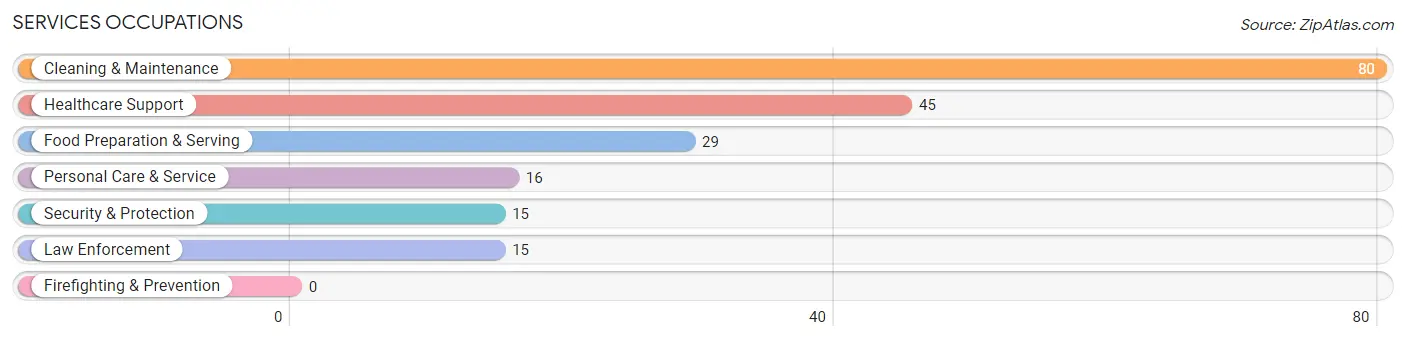
Services Occupations
The most common Services occupations in Canadian are Cleaning & Maintenance (80 | 7.1%), Healthcare Support (45 | 4.0%), Food Preparation & Serving (29 | 2.6%), Personal Care & Service (16 | 1.4%), and Security & Protection (15 | 1.3%).
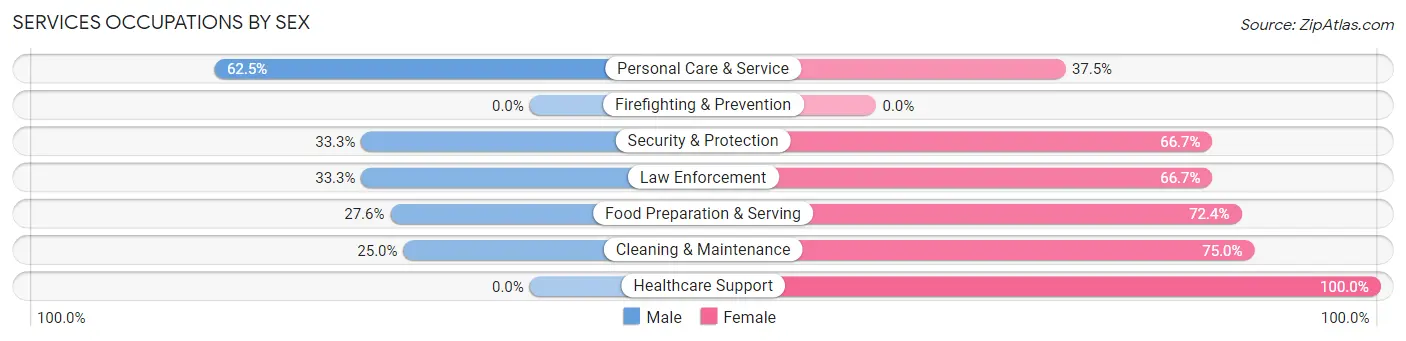
Services Occupations by Sex
Within the Services occupations in Canadian, the most male-oriented occupations are Personal Care & Service (62.5%), Security & Protection (33.3%), and Law Enforcement (33.3%), while the most female-oriented occupations are Healthcare Support (100.0%), Cleaning & Maintenance (75.0%), and Food Preparation & Serving (72.4%).
| Occupation | Male | Female |
| Healthcare Support | 0 (0.0%) | 45 (100.0%) |
| Security & Protection | 5 (33.3%) | 10 (66.7%) |
| Firefighting & Prevention | 0 (0.0%) | 0 (0.0%) |
| Law Enforcement | 5 (33.3%) | 10 (66.7%) |
| Food Preparation & Serving | 8 (27.6%) | 21 (72.4%) |
| Cleaning & Maintenance | 20 (25.0%) | 60 (75.0%) |
| Personal Care & Service | 10 (62.5%) | 6 (37.5%) |
| Total (Category) | 43 (23.2%) | 142 (76.8%) |
| Total (Overall) | 673 (59.6%) | 457 (40.4%) |
Sales and Office Occupations
The most common Sales and Office occupations in Canadian are Office & Administration (121 | 10.7%), and Sales & Related (109 | 9.7%).
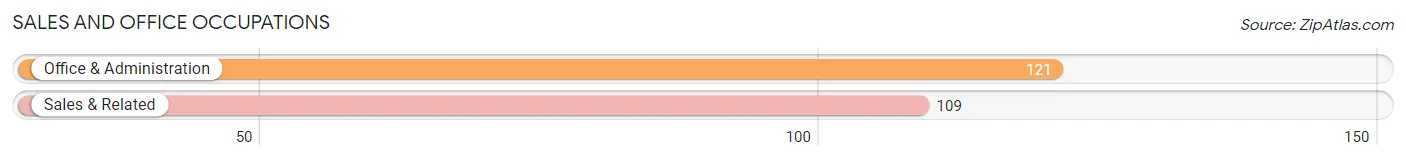
Sales and Office Occupations by Sex

| Occupation | Male | Female |
| Sales & Related | 71 (65.1%) | 38 (34.9%) |
| Office & Administration | 22 (18.2%) | 99 (81.8%) |
| Total (Category) | 93 (40.4%) | 137 (59.6%) |
| Total (Overall) | 673 (59.6%) | 457 (40.4%) |
Natural Resources, Construction and Maintenance Occupations
The most common Natural Resources, Construction and Maintenance occupations in Canadian are Construction & Extraction (196 | 17.3%), Farming, Fishing & Forestry (87 | 7.7%), and Installation, Maintenance & Repair (32 | 2.8%).
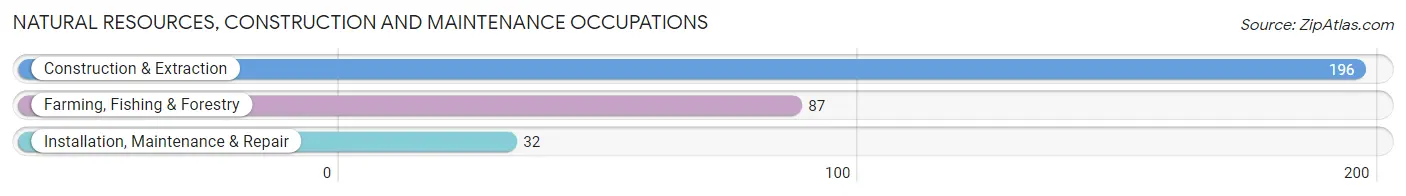
Natural Resources, Construction and Maintenance Occupations by Sex
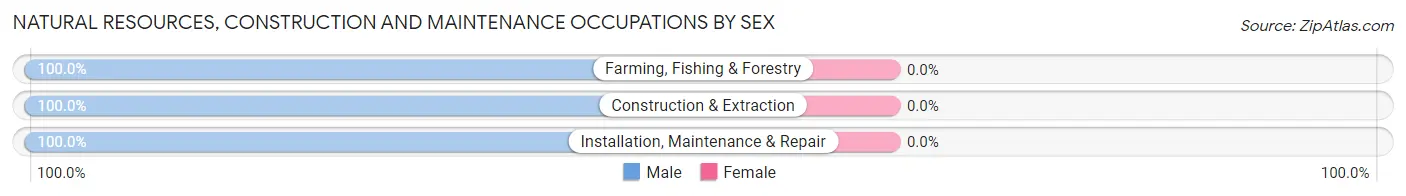
| Occupation | Male | Female |
| Farming, Fishing & Forestry | 87 (100.0%) | 0 (0.0%) |
| Construction & Extraction | 196 (100.0%) | 0 (0.0%) |
| Installation, Maintenance & Repair | 32 (100.0%) | 0 (0.0%) |
| Total (Category) | 315 (100.0%) | 0 (0.0%) |
| Total (Overall) | 673 (59.6%) | 457 (40.4%) |
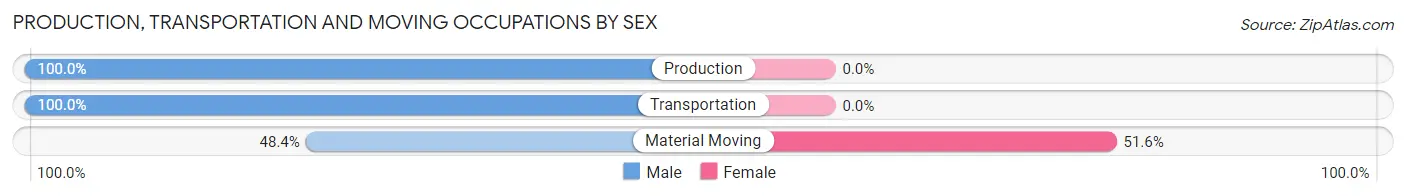
Production, Transportation and Moving Occupations
The most common Production, Transportation and Moving occupations in Canadian are Material Moving (64 | 5.7%), Transportation (40 | 3.5%), and Production (18 | 1.6%).
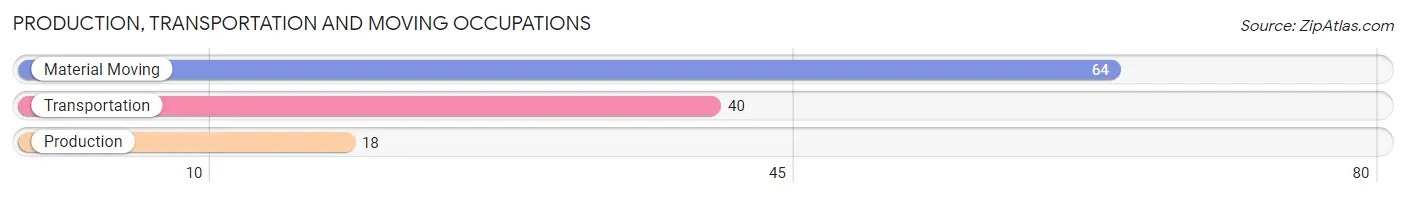
Production, Transportation and Moving Occupations by Sex
| Occupation | Male | Female |
| Production | 18 (100.0%) | 0 (0.0%) |
| Transportation | 40 (100.0%) | 0 (0.0%) |
| Material Moving | 31 (48.4%) | 33 (51.6%) |
| Total (Category) | 89 (73.0%) | 33 (27.1%) |
| Total (Overall) | 673 (59.6%) | 457 (40.4%) |
Employment Industries by Sex in Canadian
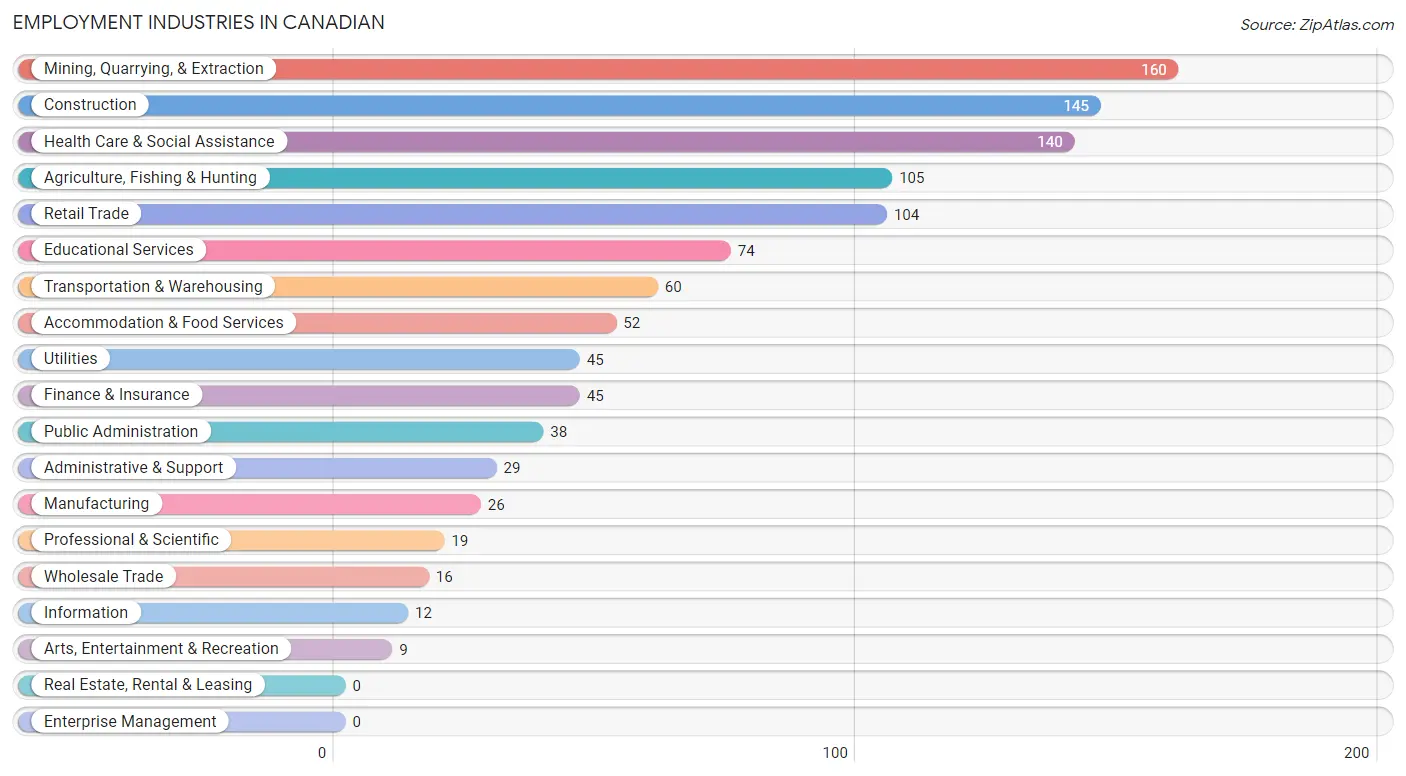
Employment Industries in Canadian
The major employment industries in Canadian include Mining, Quarrying, & Extraction (160 | 14.2%), Construction (145 | 12.8%), Health Care & Social Assistance (140 | 12.4%), Agriculture, Fishing & Hunting (105 | 9.3%), and Retail Trade (104 | 9.2%).
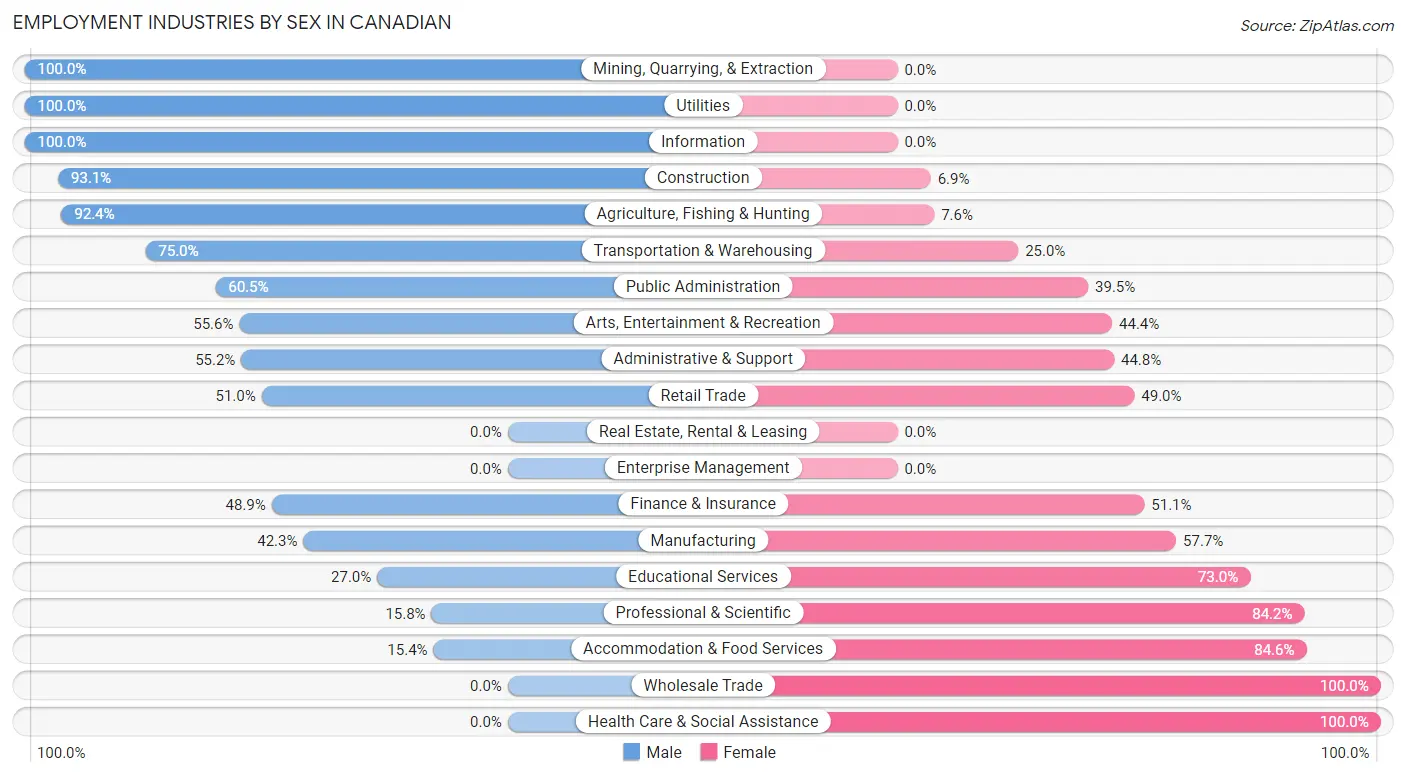
Employment Industries by Sex in Canadian
The Canadian industries that see more men than women are Mining, Quarrying, & Extraction (100.0%), Utilities (100.0%), and Information (100.0%), whereas the industries that tend to have a higher number of women are Wholesale Trade (100.0%), Health Care & Social Assistance (100.0%), and Accommodation & Food Services (84.6%).
| Industry | Male | Female |
| Agriculture, Fishing & Hunting | 97 (92.4%) | 8 (7.6%) |
| Mining, Quarrying, & Extraction | 160 (100.0%) | 0 (0.0%) |
| Construction | 135 (93.1%) | 10 (6.9%) |
| Manufacturing | 11 (42.3%) | 15 (57.7%) |
| Wholesale Trade | 0 (0.0%) | 16 (100.0%) |
| Retail Trade | 53 (51.0%) | 51 (49.0%) |
| Transportation & Warehousing | 45 (75.0%) | 15 (25.0%) |
| Utilities | 45 (100.0%) | 0 (0.0%) |
| Information | 12 (100.0%) | 0 (0.0%) |
| Finance & Insurance | 22 (48.9%) | 23 (51.1%) |
| Real Estate, Rental & Leasing | 0 (0.0%) | 0 (0.0%) |
| Professional & Scientific | 3 (15.8%) | 16 (84.2%) |
| Enterprise Management | 0 (0.0%) | 0 (0.0%) |
| Administrative & Support | 16 (55.2%) | 13 (44.8%) |
| Educational Services | 20 (27.0%) | 54 (73.0%) |
| Health Care & Social Assistance | 0 (0.0%) | 140 (100.0%) |
| Arts, Entertainment & Recreation | 5 (55.6%) | 4 (44.4%) |
| Accommodation & Food Services | 8 (15.4%) | 44 (84.6%) |
| Public Administration | 23 (60.5%) | 15 (39.5%) |
| Total | 673 (59.6%) | 457 (40.4%) |
Education in Canadian
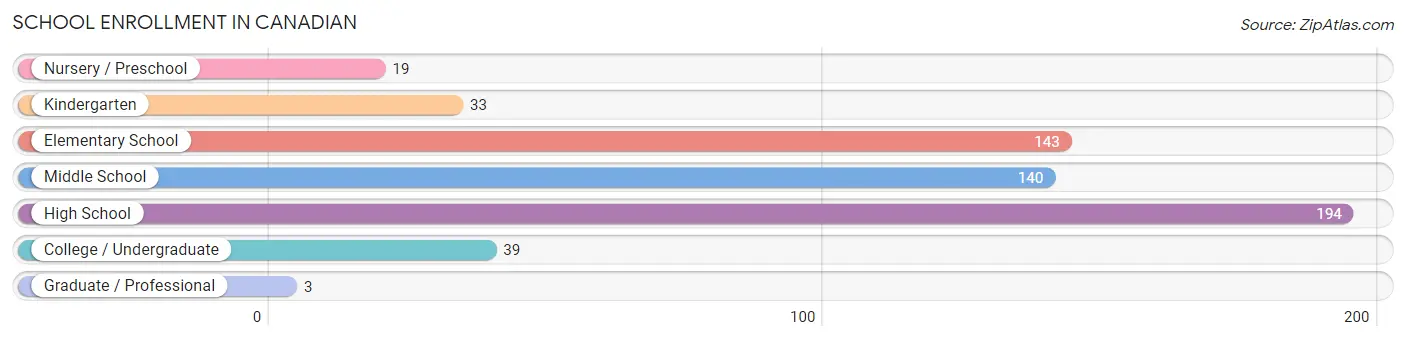
School Enrollment in Canadian
The most common levels of schooling among the 571 students in Canadian are high school (194 | 34.0%), elementary school (143 | 25.0%), and middle school (140 | 24.5%).
| School Level | # Students | % Students |
| Nursery / Preschool | 19 | 3.3% |
| Kindergarten | 33 | 5.8% |
| Elementary School | 143 | 25.0% |
| Middle School | 140 | 24.5% |
| High School | 194 | 34.0% |
| College / Undergraduate | 39 | 6.8% |
| Graduate / Professional | 3 | 0.5% |
| Total | 571 | 100.0% |
School Enrollment by Age by Funding Source in Canadian
Out of a total of 571 students who are enrolled in schools in Canadian, 9 (1.6%) attend a private institution, while the remaining 562 (98.4%) are enrolled in public schools. The age group of 15 to 17 year olds has the highest likelihood of being enrolled in private schools, with 6 (4.8% in the age bracket) enrolled. Conversely, the age group of 3 to 4 year olds has the lowest likelihood of being enrolled in a private school, with 10 (100.0% in the age bracket) attending a public institution.
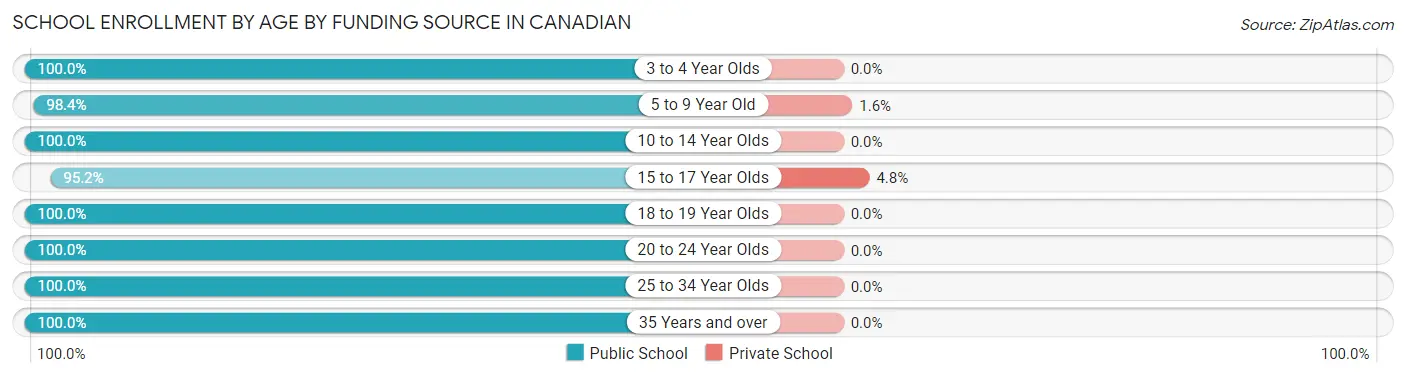
| Age Bracket | Public School | Private School |
| 3 to 4 Year Olds | 10 (100.0%) | 0 (0.0%) |
| 5 to 9 Year Old | 182 (98.4%) | 3 (1.6%) |
| 10 to 14 Year Olds | 186 (100.0%) | 0 (0.0%) |
| 15 to 17 Year Olds | 119 (95.2%) | 6 (4.8%) |
| 18 to 19 Year Olds | 53 (100.0%) | 0 (0.0%) |
| 20 to 24 Year Olds | 8 (100.0%) | 0 (0.0%) |
| 25 to 34 Year Olds | 3 (100.0%) | 0 (0.0%) |
| 35 Years and over | 1 (100.0%) | 0 (0.0%) |
| Total | 562 (98.4%) | 9 (1.6%) |
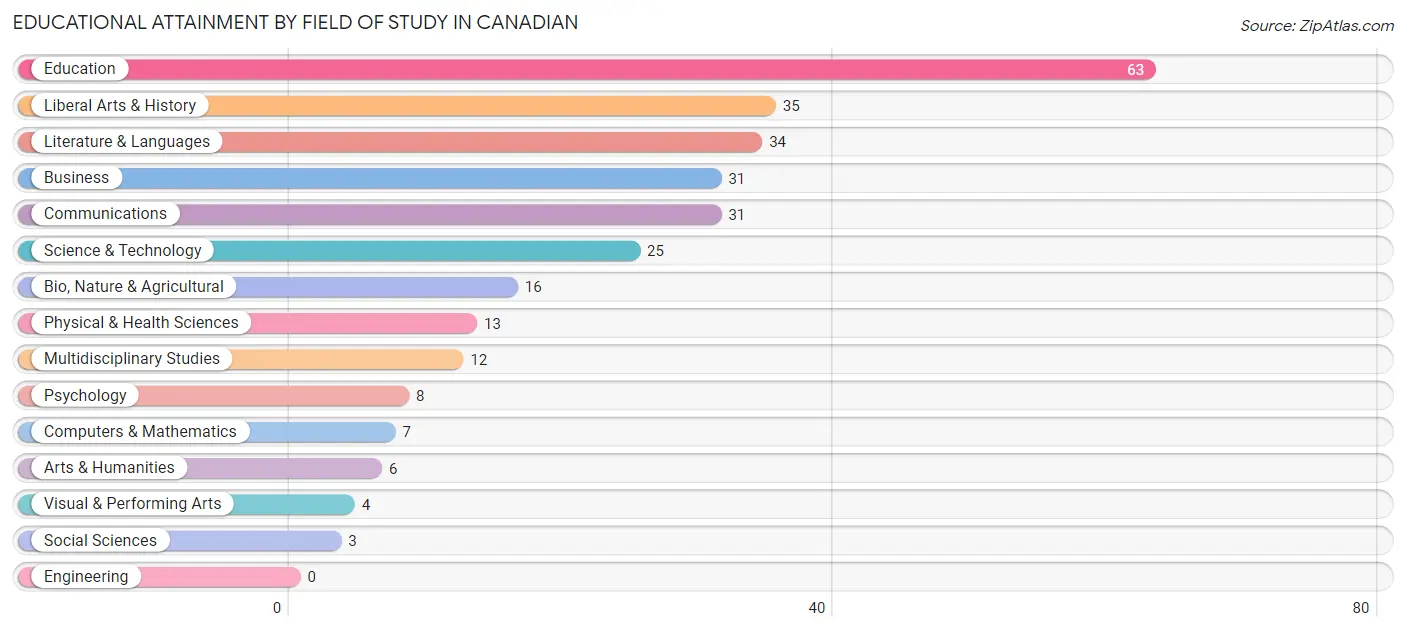
Educational Attainment by Field of Study in Canadian
Education (63 | 21.9%), liberal arts & history (35 | 12.1%), literature & languages (34 | 11.8%), business (31 | 10.8%), and communications (31 | 10.8%) are the most common fields of study among 288 individuals in Canadian who have obtained a bachelor's degree or higher.
| Field of Study | # Graduates | % Graduates |
| Computers & Mathematics | 7 | 2.4% |
| Bio, Nature & Agricultural | 16 | 5.6% |
| Physical & Health Sciences | 13 | 4.5% |
| Psychology | 8 | 2.8% |
| Social Sciences | 3 | 1.0% |
| Engineering | 0 | 0.0% |
| Multidisciplinary Studies | 12 | 4.2% |
| Science & Technology | 25 | 8.7% |
| Business | 31 | 10.8% |
| Education | 63 | 21.9% |
| Literature & Languages | 34 | 11.8% |
| Liberal Arts & History | 35 | 12.1% |
| Visual & Performing Arts | 4 | 1.4% |
| Communications | 31 | 10.8% |
| Arts & Humanities | 6 | 2.1% |
| Total | 288 | 100.0% |
Transportation & Commute in Canadian
Vehicle Availability by Sex in Canadian
The most prevalent vehicle ownership categories in Canadian are males with 2 vehicles (218, accounting for 32.4%) and females with 2 vehicles (191, making up 49.3%).
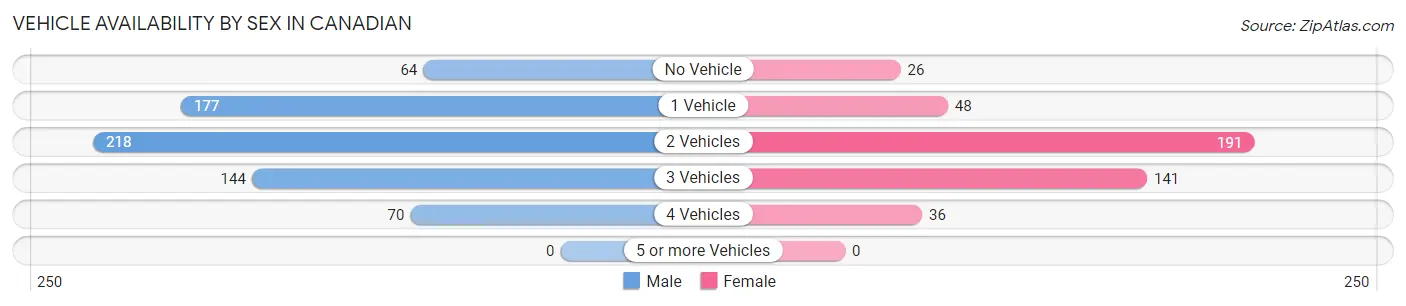
| Vehicles Available | Male | Female |
| No Vehicle | 64 (9.5%) | 26 (5.9%) |
| 1 Vehicle | 177 (26.3%) | 48 (10.9%) |
| 2 Vehicles | 218 (32.4%) | 191 (43.2%) |
| 3 Vehicles | 144 (21.4%) | 141 (31.9%) |
| 4 Vehicles | 70 (10.4%) | 36 (8.1%) |
| 5 or more Vehicles | 0 (0.0%) | 0 (0.0%) |
| Total | 673 (100.0%) | 442 (100.0%) |
Commute Time in Canadian
The most frequently occuring commute durations in Canadian are 5 to 9 minutes (300 commuters, 28.1%), less than 5 minutes (262 commuters, 24.6%), and 10 to 14 minutes (101 commuters, 9.5%).
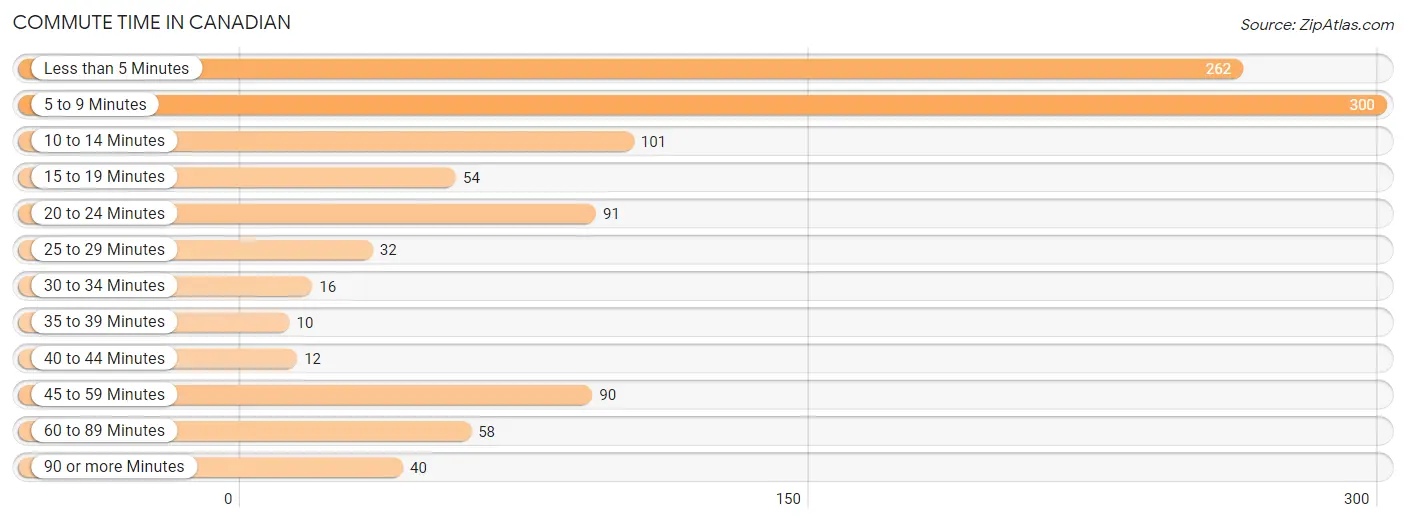
| Commute Time | # Commuters | % Commuters |
| Less than 5 Minutes | 262 | 24.6% |
| 5 to 9 Minutes | 300 | 28.1% |
| 10 to 14 Minutes | 101 | 9.5% |
| 15 to 19 Minutes | 54 | 5.1% |
| 20 to 24 Minutes | 91 | 8.5% |
| 25 to 29 Minutes | 32 | 3.0% |
| 30 to 34 Minutes | 16 | 1.5% |
| 35 to 39 Minutes | 10 | 0.9% |
| 40 to 44 Minutes | 12 | 1.1% |
| 45 to 59 Minutes | 90 | 8.4% |
| 60 to 89 Minutes | 58 | 5.4% |
| 90 or more Minutes | 40 | 3.7% |
Commute Time by Sex in Canadian
The most common commute times in Canadian are 5 to 9 minutes (153 commuters, 23.4%) for males and less than 5 minutes (178 commuters, 43.2%) for females.
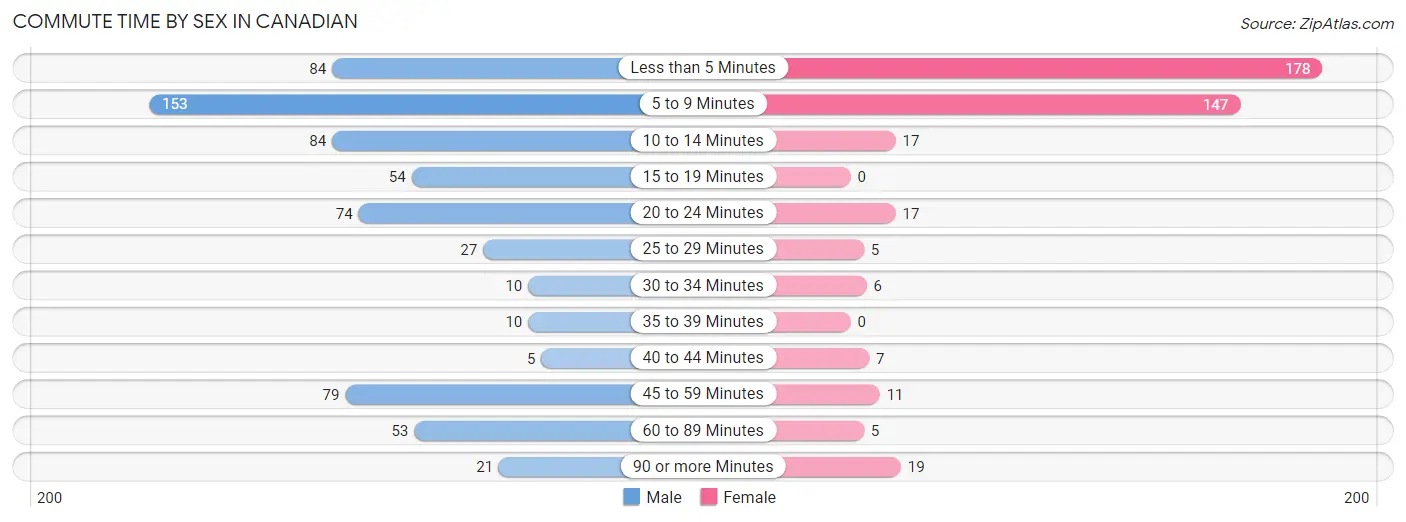
| Commute Time | Male | Female |
| Less than 5 Minutes | 84 (12.8%) | 178 (43.2%) |
| 5 to 9 Minutes | 153 (23.4%) | 147 (35.7%) |
| 10 to 14 Minutes | 84 (12.8%) | 17 (4.1%) |
| 15 to 19 Minutes | 54 (8.3%) | 0 (0.0%) |
| 20 to 24 Minutes | 74 (11.3%) | 17 (4.1%) |
| 25 to 29 Minutes | 27 (4.1%) | 5 (1.2%) |
| 30 to 34 Minutes | 10 (1.5%) | 6 (1.5%) |
| 35 to 39 Minutes | 10 (1.5%) | 0 (0.0%) |
| 40 to 44 Minutes | 5 (0.8%) | 7 (1.7%) |
| 45 to 59 Minutes | 79 (12.1%) | 11 (2.7%) |
| 60 to 89 Minutes | 53 (8.1%) | 5 (1.2%) |
| 90 or more Minutes | 21 (3.2%) | 19 (4.6%) |
Time of Departure to Work by Sex in Canadian
The most frequent times of departure to work in Canadian are 7:00 AM to 7:29 AM (172, 26.3%) for males and 7:00 AM to 7:29 AM (75, 18.2%) for females.
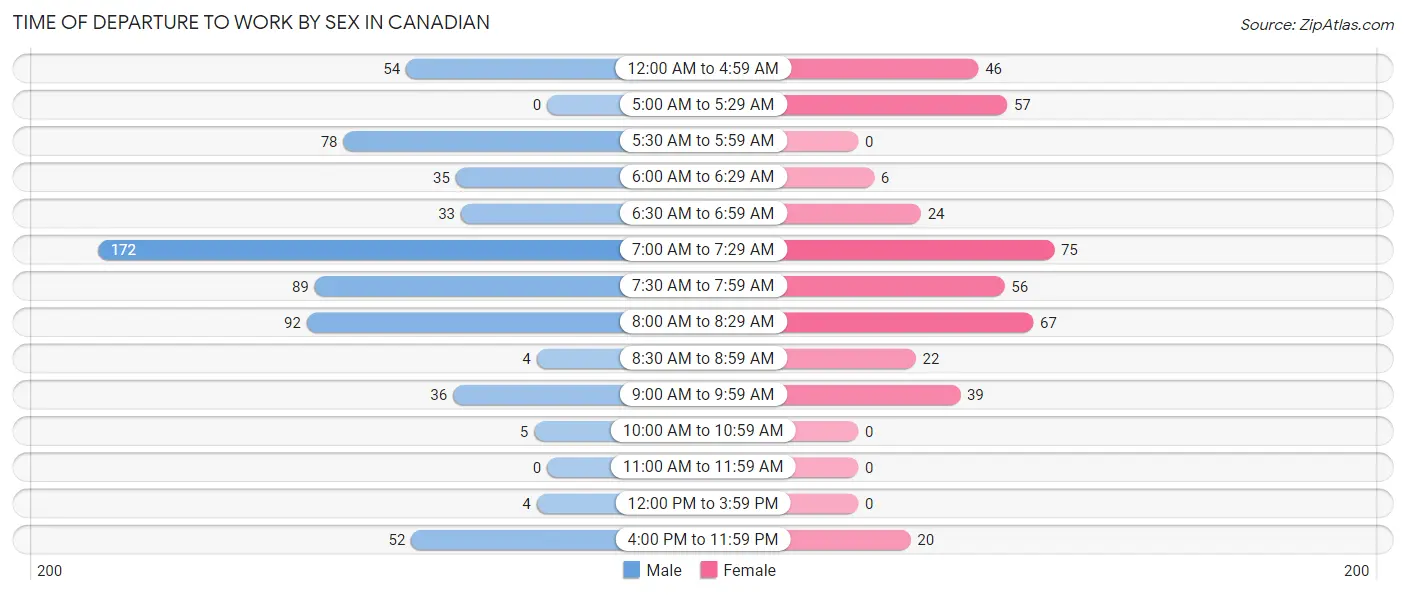
| Time of Departure | Male | Female |
| 12:00 AM to 4:59 AM | 54 (8.3%) | 46 (11.2%) |
| 5:00 AM to 5:29 AM | 0 (0.0%) | 57 (13.8%) |
| 5:30 AM to 5:59 AM | 78 (11.9%) | 0 (0.0%) |
| 6:00 AM to 6:29 AM | 35 (5.3%) | 6 (1.5%) |
| 6:30 AM to 6:59 AM | 33 (5.1%) | 24 (5.8%) |
| 7:00 AM to 7:29 AM | 172 (26.3%) | 75 (18.2%) |
| 7:30 AM to 7:59 AM | 89 (13.6%) | 56 (13.6%) |
| 8:00 AM to 8:29 AM | 92 (14.1%) | 67 (16.3%) |
| 8:30 AM to 8:59 AM | 4 (0.6%) | 22 (5.3%) |
| 9:00 AM to 9:59 AM | 36 (5.5%) | 39 (9.5%) |
| 10:00 AM to 10:59 AM | 5 (0.8%) | 0 (0.0%) |
| 11:00 AM to 11:59 AM | 0 (0.0%) | 0 (0.0%) |
| 12:00 PM to 3:59 PM | 4 (0.6%) | 0 (0.0%) |
| 4:00 PM to 11:59 PM | 52 (8.0%) | 20 (4.9%) |
| Total | 654 (100.0%) | 412 (100.0%) |
Housing Occupancy in Canadian
Occupancy by Ownership in Canadian
Of the total 867 dwellings in Canadian, owner-occupied units account for 629 (72.6%), while renter-occupied units make up 238 (27.5%).
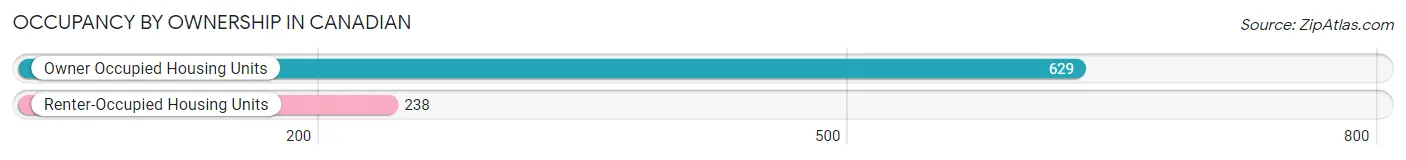
| Occupancy | # Housing Units | % Housing Units |
| Owner Occupied Housing Units | 629 | 72.6% |
| Renter-Occupied Housing Units | 238 | 27.5% |
| Total Occupied Housing Units | 867 | 100.0% |
Occupancy by Household Size in Canadian
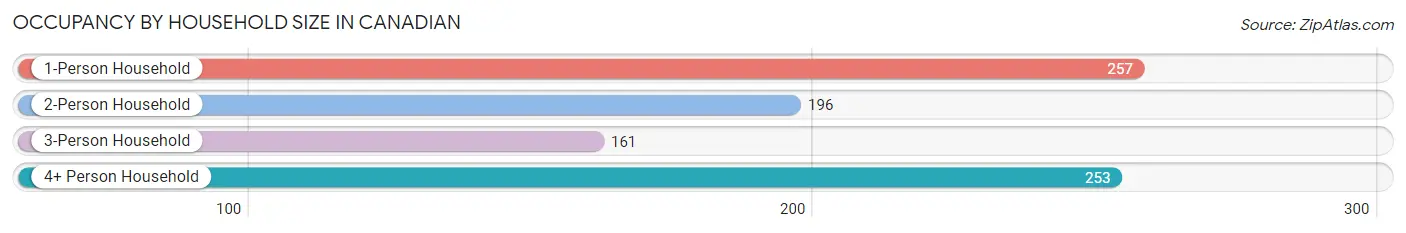
| Household Size | # Housing Units | % Housing Units |
| 1-Person Household | 257 | 29.6% |
| 2-Person Household | 196 | 22.6% |
| 3-Person Household | 161 | 18.6% |
| 4+ Person Household | 253 | 29.2% |
| Total Housing Units | 867 | 100.0% |
Occupancy by Ownership by Household Size in Canadian
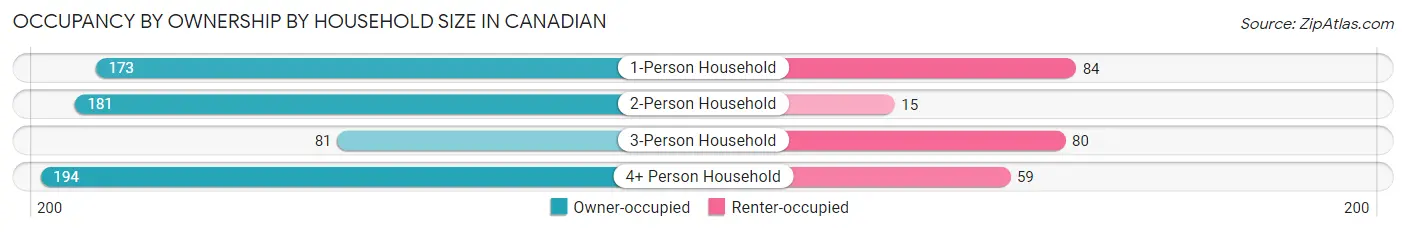
| Household Size | Owner-occupied | Renter-occupied |
| 1-Person Household | 173 (67.3%) | 84 (32.7%) |
| 2-Person Household | 181 (92.3%) | 15 (7.6%) |
| 3-Person Household | 81 (50.3%) | 80 (49.7%) |
| 4+ Person Household | 194 (76.7%) | 59 (23.3%) |
| Total Housing Units | 629 (72.6%) | 238 (27.5%) |
Occupancy by Educational Attainment in Canadian
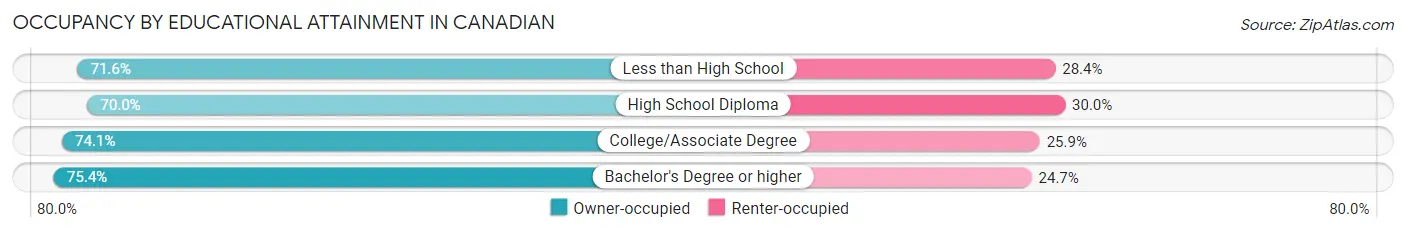
| Household Size | Owner-occupied | Renter-occupied |
| Less than High School | 63 (71.6%) | 25 (28.4%) |
| High School Diploma | 222 (70.0%) | 95 (30.0%) |
| College/Associate Degree | 237 (74.1%) | 83 (25.9%) |
| Bachelor's Degree or higher | 107 (75.3%) | 35 (24.6%) |
Occupancy by Age of Householder in Canadian
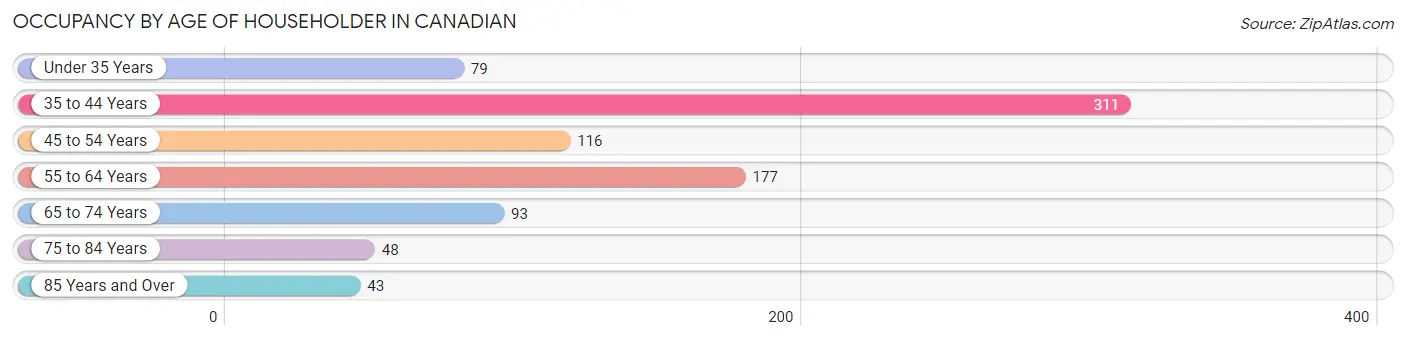
| Age Bracket | # Households | % Households |
| Under 35 Years | 79 | 9.1% |
| 35 to 44 Years | 311 | 35.9% |
| 45 to 54 Years | 116 | 13.4% |
| 55 to 64 Years | 177 | 20.4% |
| 65 to 74 Years | 93 | 10.7% |
| 75 to 84 Years | 48 | 5.5% |
| 85 Years and Over | 43 | 5.0% |
| Total | 867 | 100.0% |
Housing Finances in Canadian
Median Income by Occupancy in Canadian
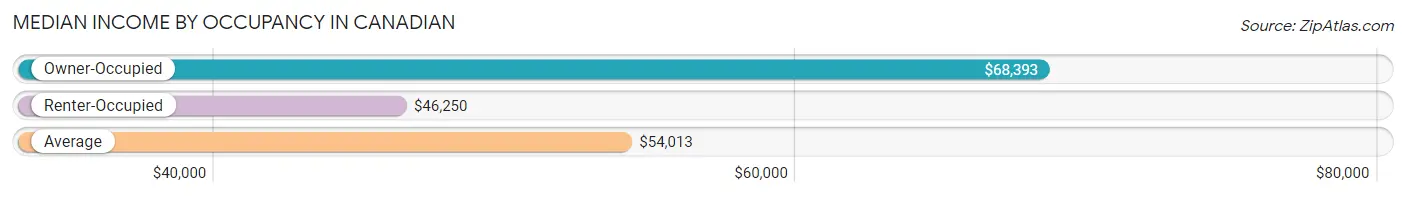
| Occupancy Type | # Households | Median Income |
| Owner-Occupied | 629 (72.6%) | $68,393 |
| Renter-Occupied | 238 (27.5%) | $46,250 |
| Average | 867 (100.0%) | $54,013 |
Occupancy by Householder Income Bracket in Canadian
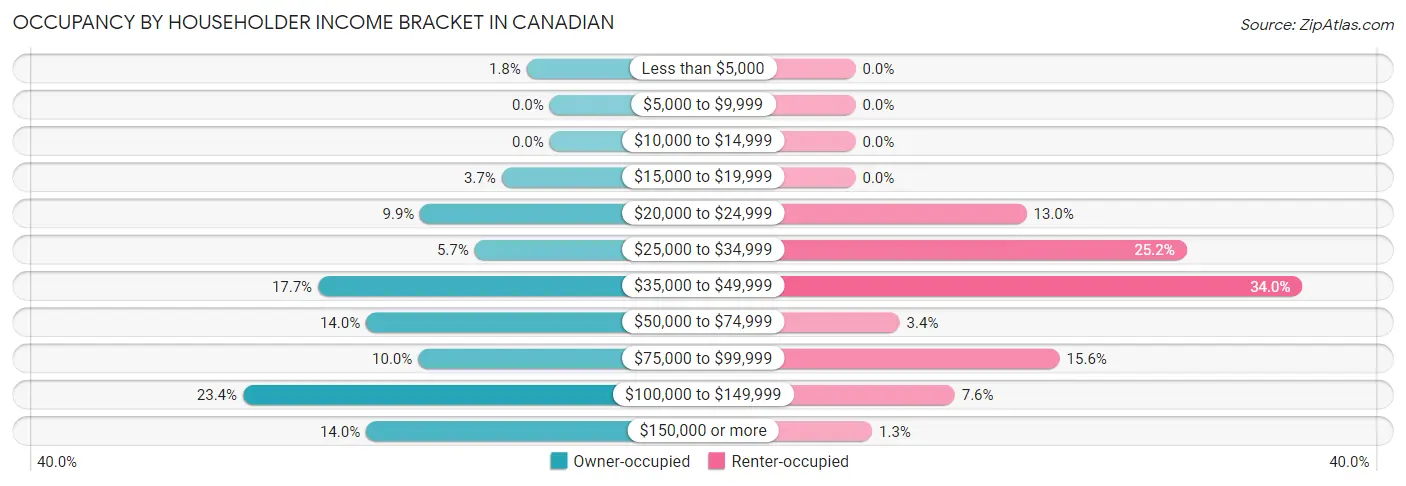
| Income Bracket | Owner-occupied | Renter-occupied |
| Less than $5,000 | 11 (1.8%) | 0 (0.0%) |
| $5,000 to $9,999 | 0 (0.0%) | 0 (0.0%) |
| $10,000 to $14,999 | 0 (0.0%) | 0 (0.0%) |
| $15,000 to $19,999 | 23 (3.7%) | 0 (0.0%) |
| $20,000 to $24,999 | 62 (9.9%) | 31 (13.0%) |
| $25,000 to $34,999 | 36 (5.7%) | 60 (25.2%) |
| $35,000 to $49,999 | 111 (17.6%) | 81 (34.0%) |
| $50,000 to $74,999 | 88 (14.0%) | 8 (3.4%) |
| $75,000 to $99,999 | 63 (10.0%) | 37 (15.5%) |
| $100,000 to $149,999 | 147 (23.4%) | 18 (7.6%) |
| $150,000 or more | 88 (14.0%) | 3 (1.3%) |
| Total | 629 (100.0%) | 238 (100.0%) |
Monthly Housing Cost Tiers in Canadian
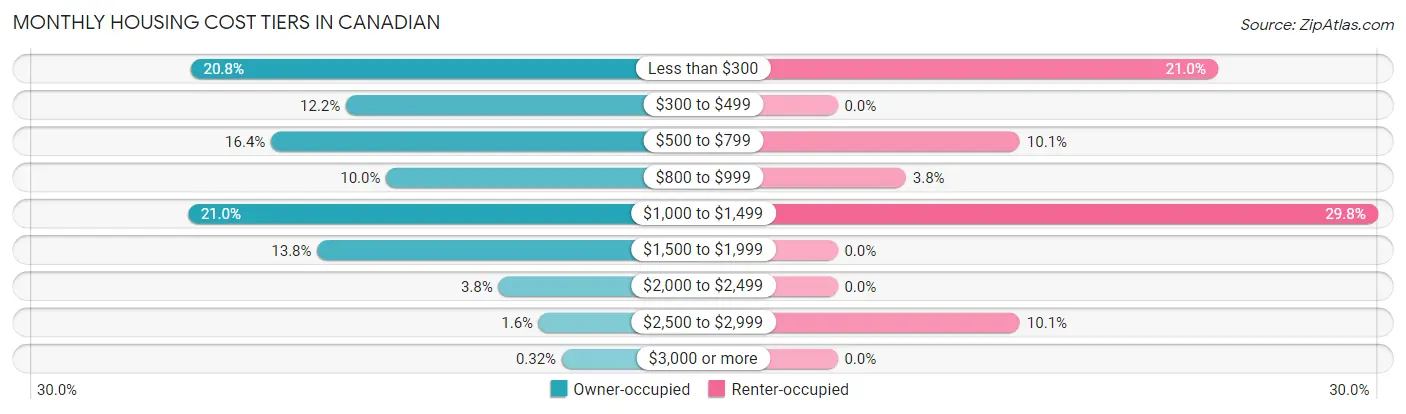
| Monthly Cost | Owner-occupied | Renter-occupied |
| Less than $300 | 131 (20.8%) | 50 (21.0%) |
| $300 to $499 | 77 (12.2%) | 0 (0.0%) |
| $500 to $799 | 103 (16.4%) | 24 (10.1%) |
| $800 to $999 | 63 (10.0%) | 9 (3.8%) |
| $1,000 to $1,499 | 132 (21.0%) | 71 (29.8%) |
| $1,500 to $1,999 | 87 (13.8%) | 0 (0.0%) |
| $2,000 to $2,499 | 24 (3.8%) | 0 (0.0%) |
| $2,500 to $2,999 | 10 (1.6%) | 24 (10.1%) |
| $3,000 or more | 2 (0.3%) | 0 (0.0%) |
| Total | 629 (100.0%) | 238 (100.0%) |
Physical Housing Characteristics in Canadian
Housing Structures in Canadian
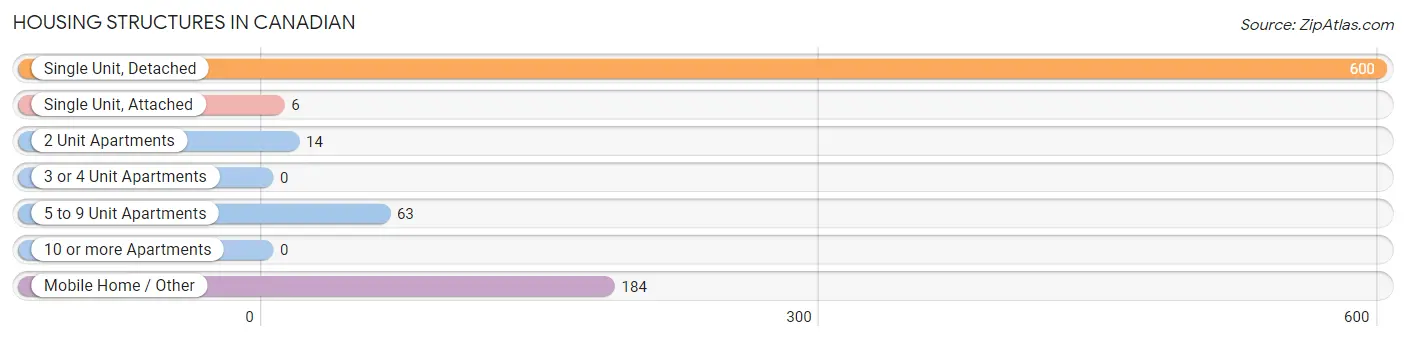
| Structure Type | # Housing Units | % Housing Units |
| Single Unit, Detached | 600 | 69.2% |
| Single Unit, Attached | 6 | 0.7% |
| 2 Unit Apartments | 14 | 1.6% |
| 3 or 4 Unit Apartments | 0 | 0.0% |
| 5 to 9 Unit Apartments | 63 | 7.3% |
| 10 or more Apartments | 0 | 0.0% |
| Mobile Home / Other | 184 | 21.2% |
| Total | 867 | 100.0% |
Housing Structures by Occupancy in Canadian
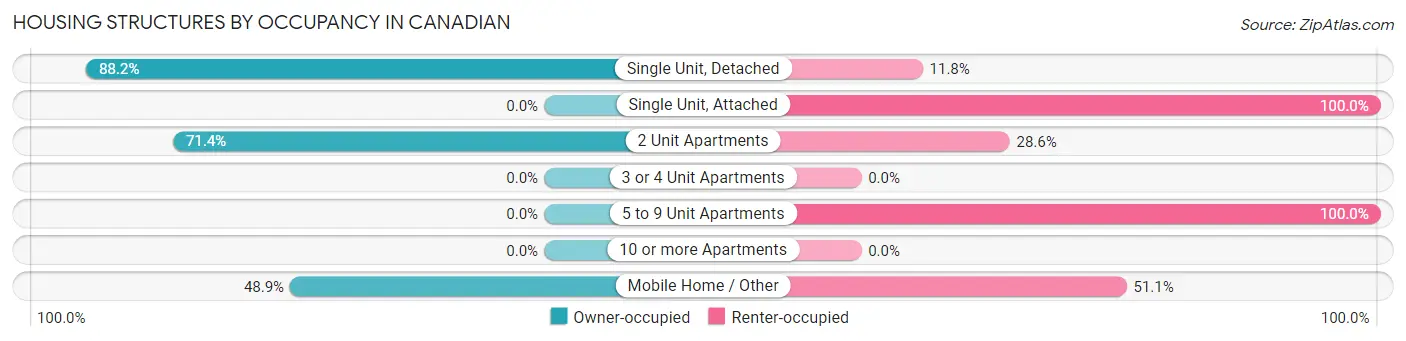
| Structure Type | Owner-occupied | Renter-occupied |
| Single Unit, Detached | 529 (88.2%) | 71 (11.8%) |
| Single Unit, Attached | 0 (0.0%) | 6 (100.0%) |
| 2 Unit Apartments | 10 (71.4%) | 4 (28.6%) |
| 3 or 4 Unit Apartments | 0 (0.0%) | 0 (0.0%) |
| 5 to 9 Unit Apartments | 0 (0.0%) | 63 (100.0%) |
| 10 or more Apartments | 0 (0.0%) | 0 (0.0%) |
| Mobile Home / Other | 90 (48.9%) | 94 (51.1%) |
| Total | 629 (72.6%) | 238 (27.5%) |
Housing Structures by Number of Rooms in Canadian
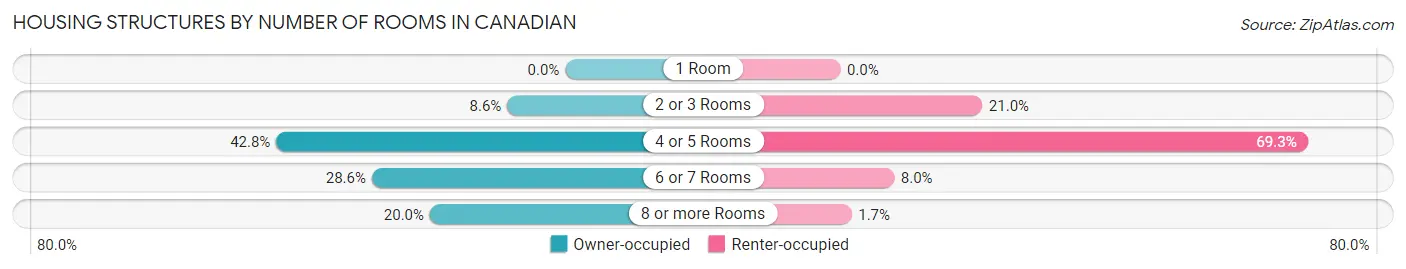
| Number of Rooms | Owner-occupied | Renter-occupied |
| 1 Room | 0 (0.0%) | 0 (0.0%) |
| 2 or 3 Rooms | 54 (8.6%) | 50 (21.0%) |
| 4 or 5 Rooms | 269 (42.8%) | 165 (69.3%) |
| 6 or 7 Rooms | 180 (28.6%) | 19 (8.0%) |
| 8 or more Rooms | 126 (20.0%) | 4 (1.7%) |
| Total | 629 (100.0%) | 238 (100.0%) |
Housing Structure by Heating Type in Canadian
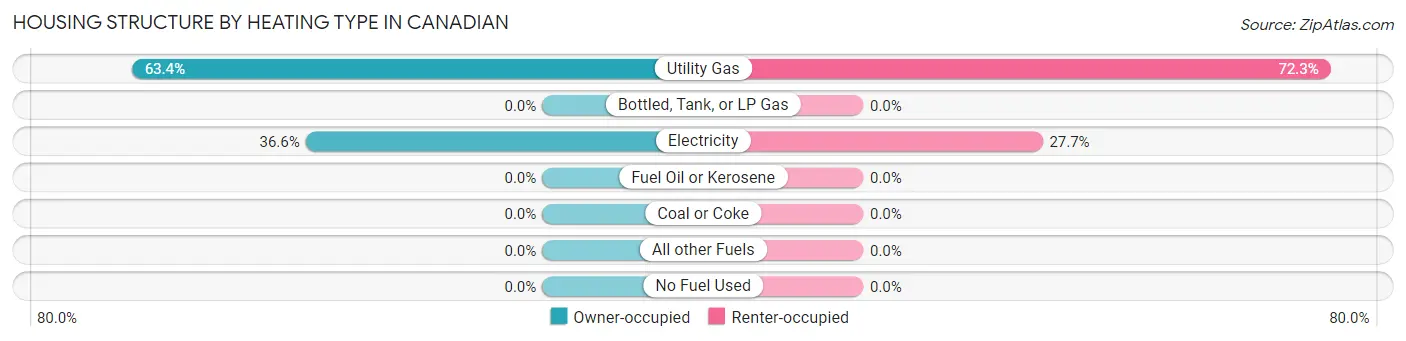
| Heating Type | Owner-occupied | Renter-occupied |
| Utility Gas | 399 (63.4%) | 172 (72.3%) |
| Bottled, Tank, or LP Gas | 0 (0.0%) | 0 (0.0%) |
| Electricity | 230 (36.6%) | 66 (27.7%) |
| Fuel Oil or Kerosene | 0 (0.0%) | 0 (0.0%) |
| Coal or Coke | 0 (0.0%) | 0 (0.0%) |
| All other Fuels | 0 (0.0%) | 0 (0.0%) |
| No Fuel Used | 0 (0.0%) | 0 (0.0%) |
| Total | 629 (100.0%) | 238 (100.0%) |
Household Vehicle Usage in Canadian
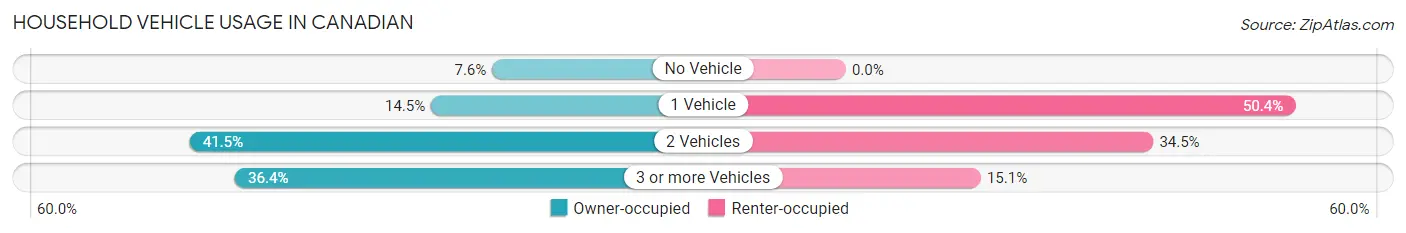
| Vehicles per Household | Owner-occupied | Renter-occupied |
| No Vehicle | 48 (7.6%) | 0 (0.0%) |
| 1 Vehicle | 91 (14.5%) | 120 (50.4%) |
| 2 Vehicles | 261 (41.5%) | 82 (34.4%) |
| 3 or more Vehicles | 229 (36.4%) | 36 (15.1%) |
| Total | 629 (100.0%) | 238 (100.0%) |
Real Estate & Mortgages in Canadian
Real Estate and Mortgage Overview in Canadian
| Characteristic | Without Mortgage | With Mortgage |
| Housing Units | 374 | 255 |
| Median Property Value | $94,000 | $179,600 |
| Median Household Income | $55,000 | $38 |
| Monthly Housing Costs | $483 | $2 |
| Real Estate Taxes | $2,161 | $13 |
Property Value by Mortgage Status in Canadian
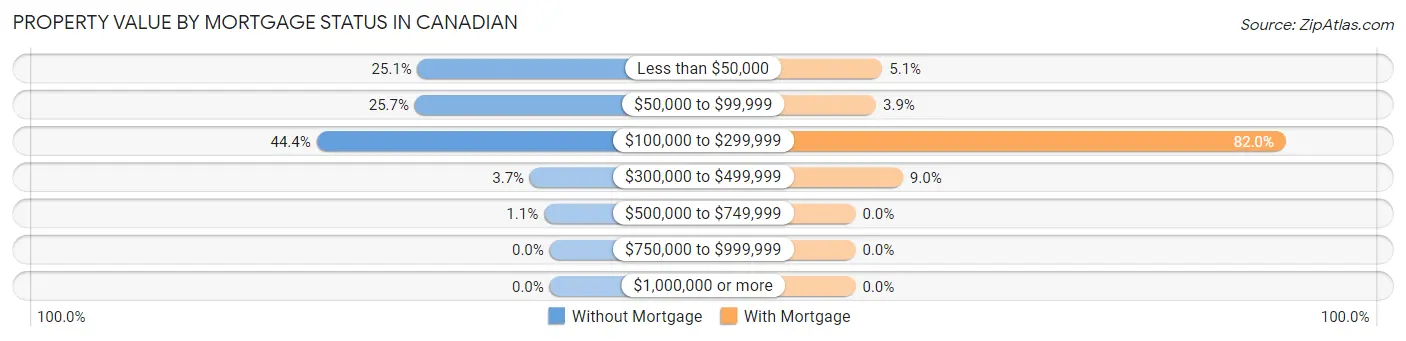
| Property Value | Without Mortgage | With Mortgage |
| Less than $50,000 | 94 (25.1%) | 13 (5.1%) |
| $50,000 to $99,999 | 96 (25.7%) | 10 (3.9%) |
| $100,000 to $299,999 | 166 (44.4%) | 209 (82.0%) |
| $300,000 to $499,999 | 14 (3.7%) | 23 (9.0%) |
| $500,000 to $749,999 | 4 (1.1%) | 0 (0.0%) |
| $750,000 to $999,999 | 0 (0.0%) | 0 (0.0%) |
| $1,000,000 or more | 0 (0.0%) | 0 (0.0%) |
| Total | 374 (100.0%) | 255 (100.0%) |
Household Income by Mortgage Status in Canadian
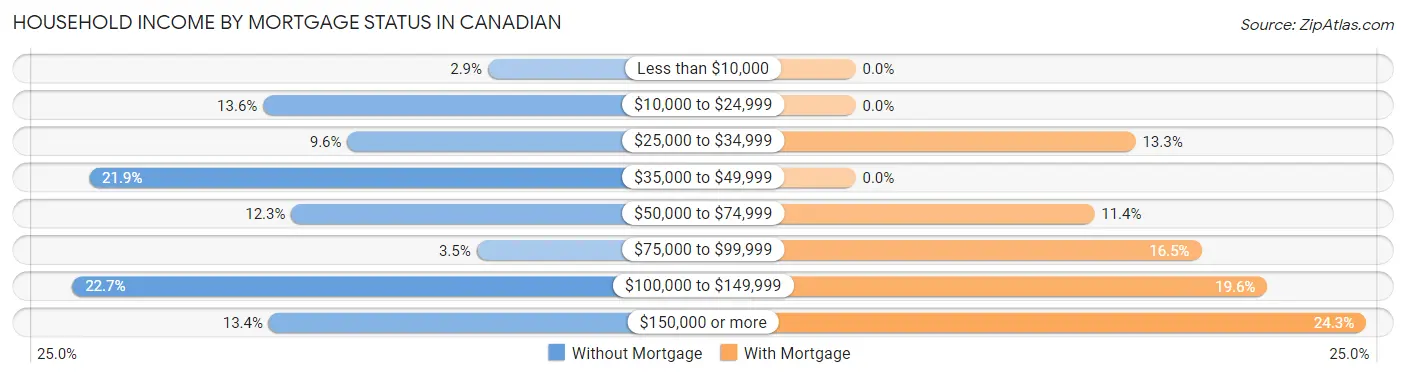
| Household Income | Without Mortgage | With Mortgage |
| Less than $10,000 | 11 (2.9%) | 0 (0.0%) |
| $10,000 to $24,999 | 51 (13.6%) | 0 (0.0%) |
| $25,000 to $34,999 | 36 (9.6%) | 34 (13.3%) |
| $35,000 to $49,999 | 82 (21.9%) | 0 (0.0%) |
| $50,000 to $74,999 | 46 (12.3%) | 29 (11.4%) |
| $75,000 to $99,999 | 13 (3.5%) | 42 (16.5%) |
| $100,000 to $149,999 | 85 (22.7%) | 50 (19.6%) |
| $150,000 or more | 50 (13.4%) | 62 (24.3%) |
| Total | 374 (100.0%) | 255 (100.0%) |
Property Value to Household Income Ratio in Canadian
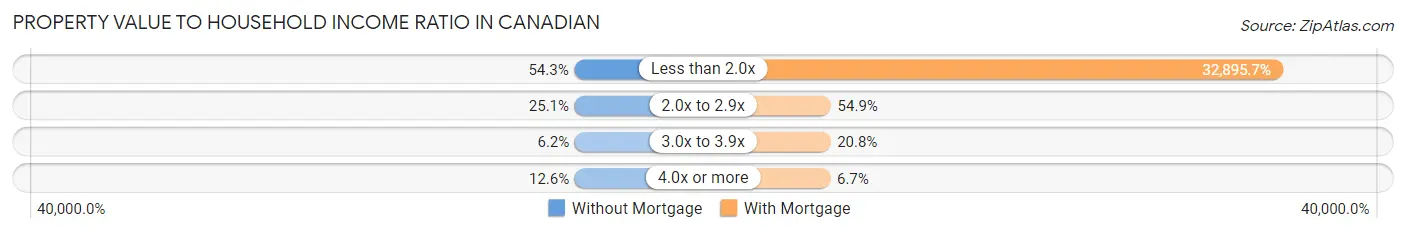
| Value-to-Income Ratio | Without Mortgage | With Mortgage |
| Less than 2.0x | 203 (54.3%) | 83,884 (32,895.7%) |
| 2.0x to 2.9x | 94 (25.1%) | 140 (54.9%) |
| 3.0x to 3.9x | 23 (6.1%) | 53 (20.8%) |
| 4.0x or more | 47 (12.6%) | 17 (6.7%) |
| Total | 374 (100.0%) | 255 (100.0%) |
Real Estate Taxes by Mortgage Status in Canadian
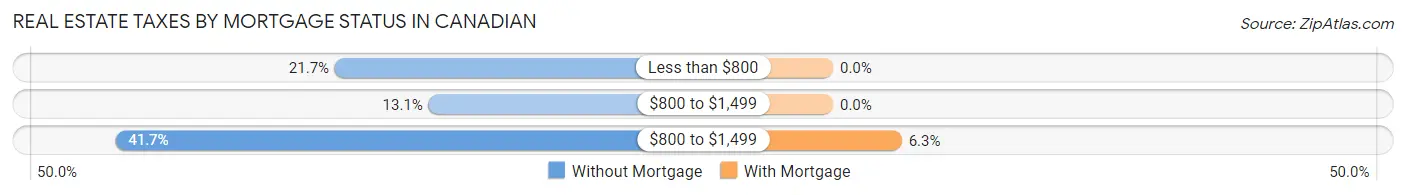
| Property Taxes | Without Mortgage | With Mortgage |
| Less than $800 | 81 (21.7%) | 0 (0.0%) |
| $800 to $1,499 | 49 (13.1%) | 0 (0.0%) |
| $800 to $1,499 | 156 (41.7%) | 16 (6.3%) |
| Total | 374 (100.0%) | 255 (100.0%) |
Health & Disability in Canadian
Health Insurance Coverage by Age in Canadian
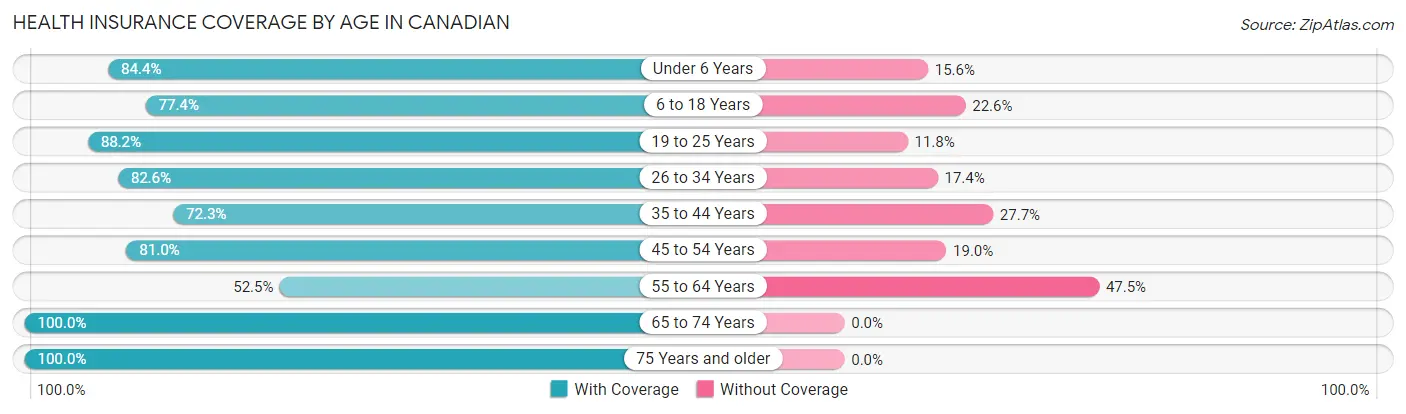
| Age Bracket | With Coverage | Without Coverage |
| Under 6 Years | 103 (84.4%) | 19 (15.6%) |
| 6 to 18 Years | 415 (77.4%) | 121 (22.6%) |
| 19 to 25 Years | 172 (88.2%) | 23 (11.8%) |
| 26 to 34 Years | 114 (82.6%) | 24 (17.4%) |
| 35 to 44 Years | 313 (72.3%) | 120 (27.7%) |
| 45 to 54 Years | 290 (81.0%) | 68 (19.0%) |
| 55 to 64 Years | 115 (52.5%) | 104 (47.5%) |
| 65 to 74 Years | 171 (100.0%) | 0 (0.0%) |
| 75 Years and older | 109 (100.0%) | 0 (0.0%) |
| Total | 1,802 (79.0%) | 479 (21.0%) |
Health Insurance Coverage by Citizenship Status in Canadian
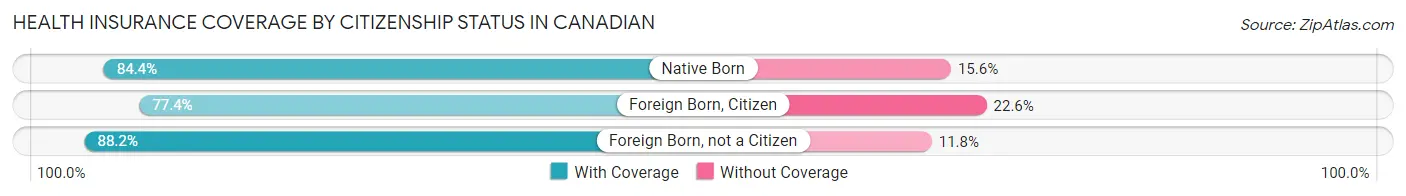
| Citizenship Status | With Coverage | Without Coverage |
| Native Born | 103 (84.4%) | 19 (15.6%) |
| Foreign Born, Citizen | 415 (77.4%) | 121 (22.6%) |
| Foreign Born, not a Citizen | 172 (88.2%) | 23 (11.8%) |
Health Insurance Coverage by Household Income in Canadian
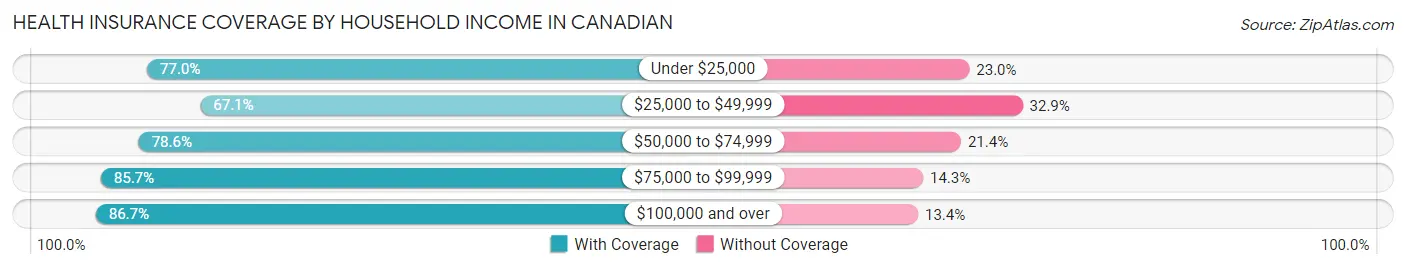
| Household Income | With Coverage | Without Coverage |
| Under $25,000 | 104 (77.0%) | 31 (23.0%) |
| $25,000 to $49,999 | 452 (67.1%) | 222 (32.9%) |
| $50,000 to $74,999 | 261 (78.6%) | 71 (21.4%) |
| $75,000 to $99,999 | 258 (85.7%) | 43 (14.3%) |
| $100,000 and over | 727 (86.7%) | 112 (13.4%) |
Public vs Private Health Insurance Coverage by Age in Canadian
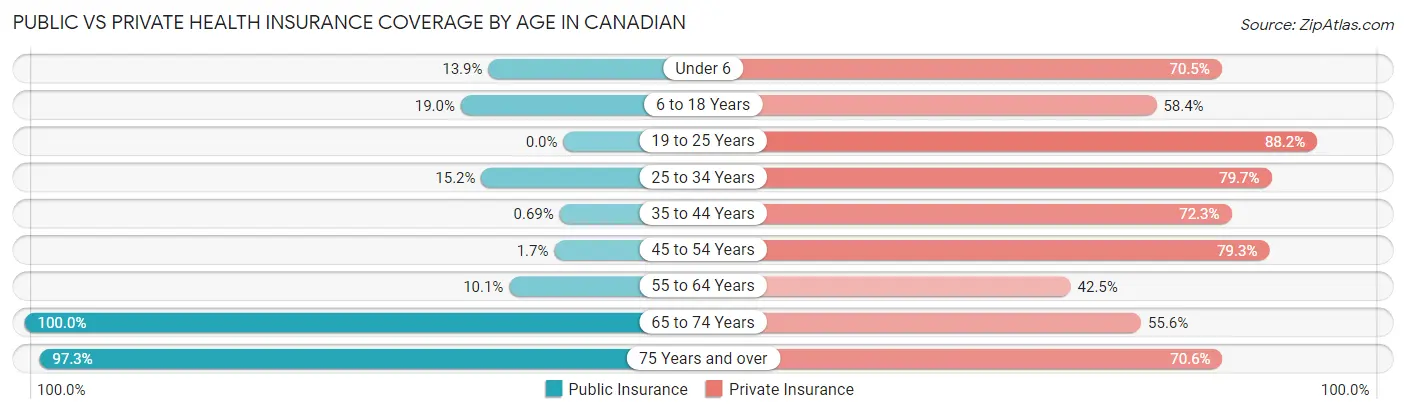
| Age Bracket | Public Insurance | Private Insurance |
| Under 6 | 17 (13.9%) | 86 (70.5%) |
| 6 to 18 Years | 102 (19.0%) | 313 (58.4%) |
| 19 to 25 Years | 0 (0.0%) | 172 (88.2%) |
| 25 to 34 Years | 21 (15.2%) | 110 (79.7%) |
| 35 to 44 Years | 3 (0.7%) | 313 (72.3%) |
| 45 to 54 Years | 6 (1.7%) | 284 (79.3%) |
| 55 to 64 Years | 22 (10.1%) | 93 (42.5%) |
| 65 to 74 Years | 171 (100.0%) | 95 (55.6%) |
| 75 Years and over | 106 (97.3%) | 77 (70.6%) |
| Total | 448 (19.6%) | 1,543 (67.6%) |
Disability Status by Sex by Age in Canadian
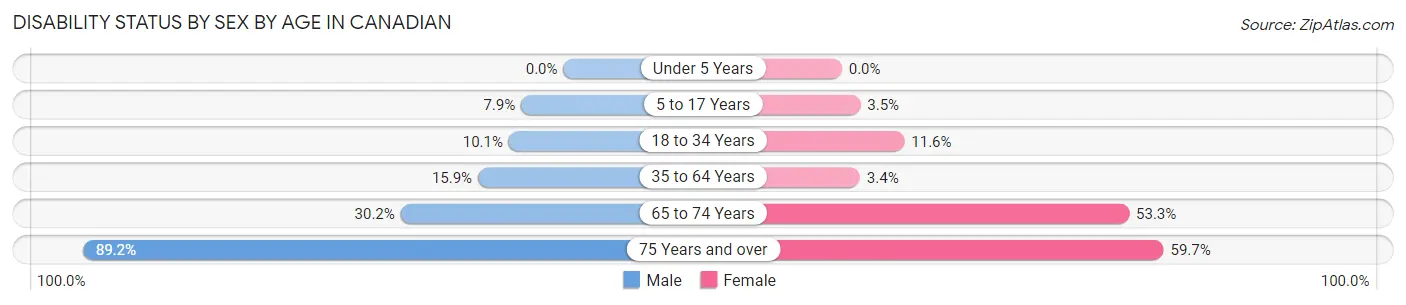
| Age Bracket | Male | Female |
| Under 5 Years | 0 (0.0%) | 0 (0.0%) |
| 5 to 17 Years | 23 (7.9%) | 7 (3.5%) |
| 18 to 34 Years | 23 (10.1%) | 18 (11.6%) |
| 35 to 64 Years | 94 (15.9%) | 14 (3.4%) |
| 65 to 74 Years | 29 (30.2%) | 40 (53.3%) |
| 75 Years and over | 33 (89.2%) | 43 (59.7%) |
Disability Class by Sex by Age in Canadian
Disability Class: Hearing Difficulty
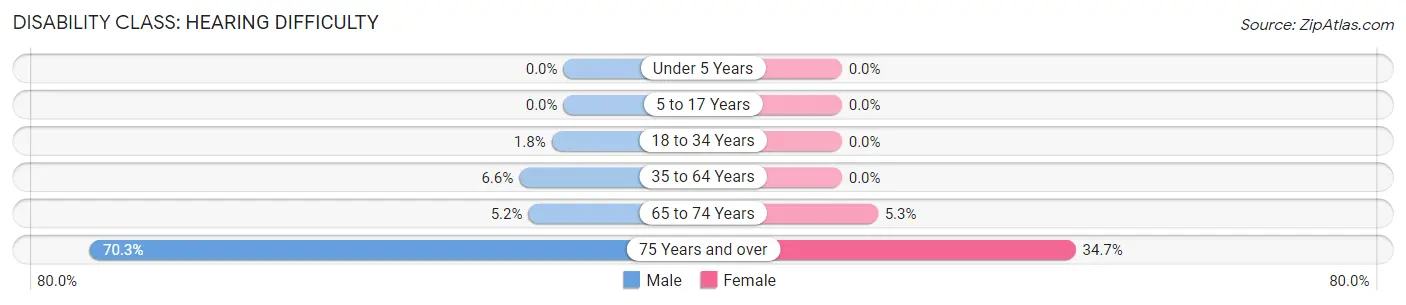
| Age Bracket | Male | Female |
| Under 5 Years | 0 (0.0%) | 0 (0.0%) |
| 5 to 17 Years | 0 (0.0%) | 0 (0.0%) |
| 18 to 34 Years | 4 (1.8%) | 0 (0.0%) |
| 35 to 64 Years | 39 (6.6%) | 0 (0.0%) |
| 65 to 74 Years | 5 (5.2%) | 4 (5.3%) |
| 75 Years and over | 26 (70.3%) | 25 (34.7%) |
Disability Class: Vision Difficulty
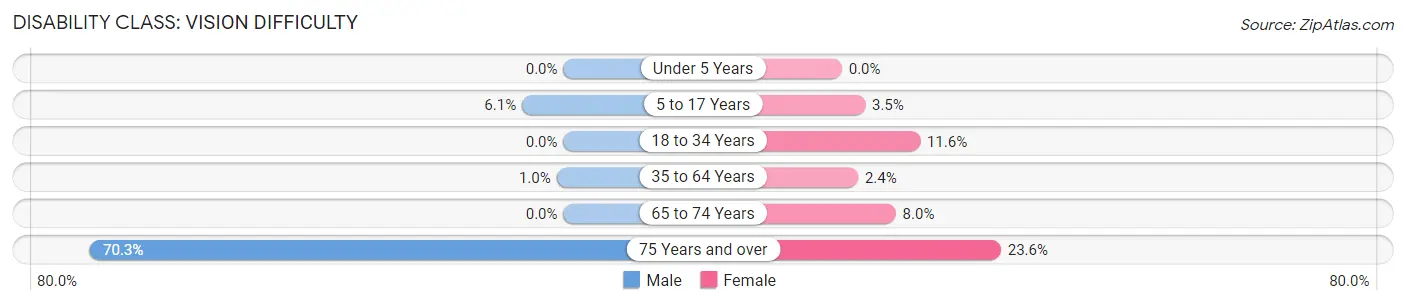
| Age Bracket | Male | Female |
| Under 5 Years | 0 (0.0%) | 0 (0.0%) |
| 5 to 17 Years | 18 (6.1%) | 7 (3.5%) |
| 18 to 34 Years | 0 (0.0%) | 18 (11.6%) |
| 35 to 64 Years | 6 (1.0%) | 10 (2.4%) |
| 65 to 74 Years | 0 (0.0%) | 6 (8.0%) |
| 75 Years and over | 26 (70.3%) | 17 (23.6%) |
Disability Class: Cognitive Difficulty
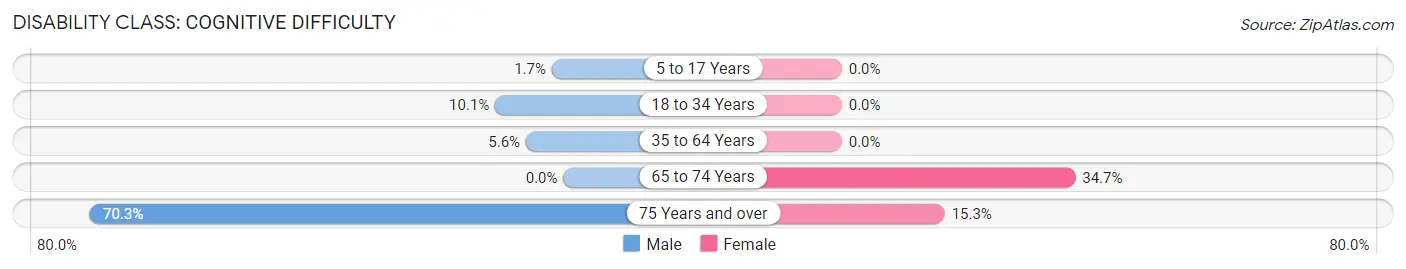
| Age Bracket | Male | Female |
| 5 to 17 Years | 5 (1.7%) | 0 (0.0%) |
| 18 to 34 Years | 23 (10.1%) | 0 (0.0%) |
| 35 to 64 Years | 33 (5.6%) | 0 (0.0%) |
| 65 to 74 Years | 0 (0.0%) | 26 (34.7%) |
| 75 Years and over | 26 (70.3%) | 11 (15.3%) |
Disability Class: Ambulatory Difficulty
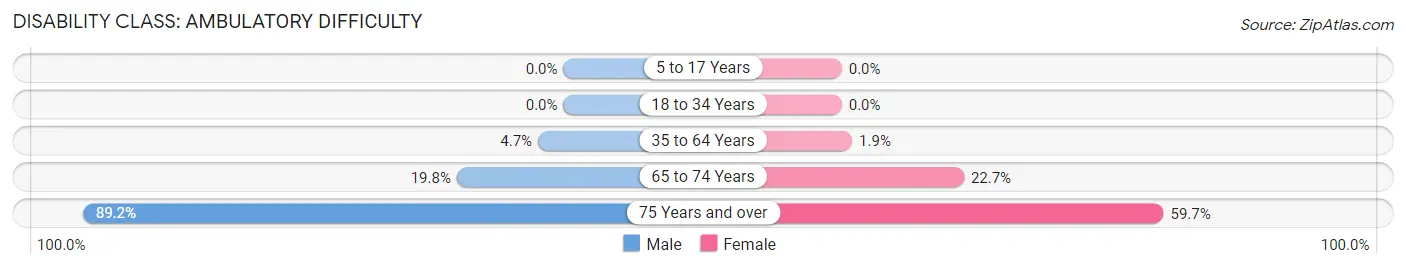
| Age Bracket | Male | Female |
| 5 to 17 Years | 0 (0.0%) | 0 (0.0%) |
| 18 to 34 Years | 0 (0.0%) | 0 (0.0%) |
| 35 to 64 Years | 28 (4.7%) | 8 (1.9%) |
| 65 to 74 Years | 19 (19.8%) | 17 (22.7%) |
| 75 Years and over | 33 (89.2%) | 43 (59.7%) |
Disability Class: Self-Care Difficulty
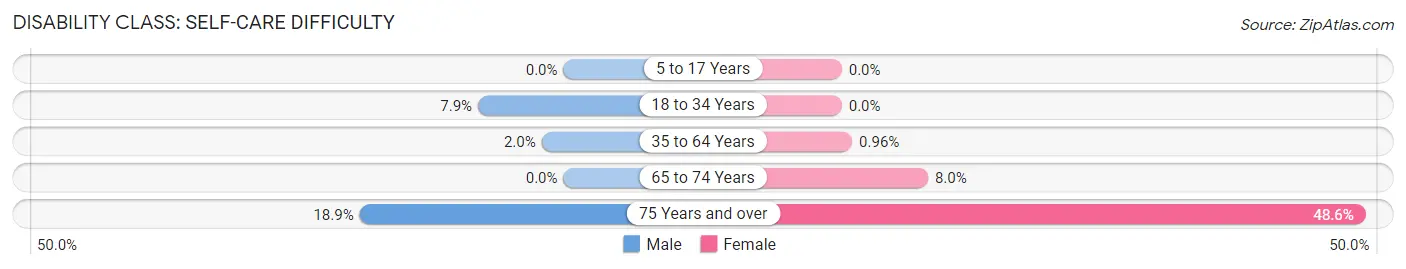
| Age Bracket | Male | Female |
| 5 to 17 Years | 0 (0.0%) | 0 (0.0%) |
| 18 to 34 Years | 18 (7.9%) | 0 (0.0%) |
| 35 to 64 Years | 12 (2.0%) | 4 (1.0%) |
| 65 to 74 Years | 0 (0.0%) | 6 (8.0%) |
| 75 Years and over | 7 (18.9%) | 35 (48.6%) |
Technology Access in Canadian
Computing Device Access in Canadian
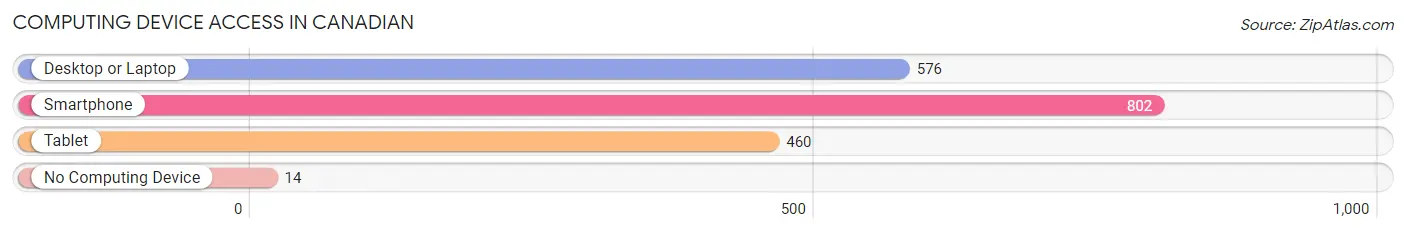
| Device Type | # Households | % Households |
| Desktop or Laptop | 576 | 66.4% |
| Smartphone | 802 | 92.5% |
| Tablet | 460 | 53.1% |
| No Computing Device | 14 | 1.6% |
| Total | 867 | 100.0% |
Internet Access in Canadian
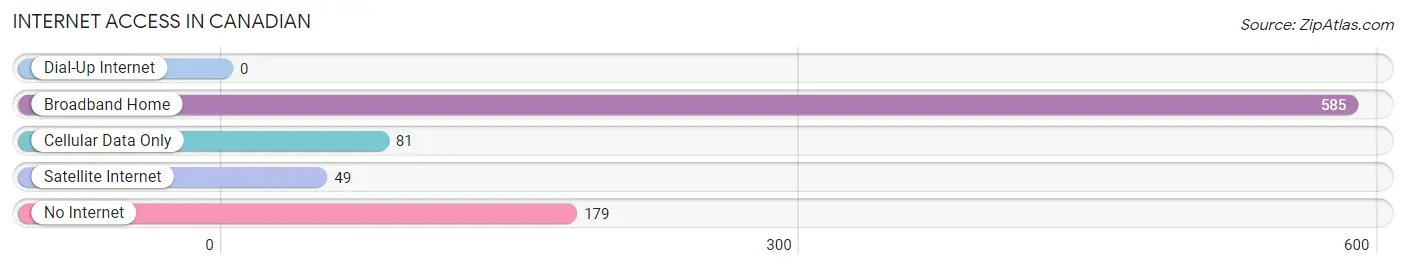
| Internet Type | # Households | % Households |
| Dial-Up Internet | 0 | 0.0% |
| Broadband Home | 585 | 67.5% |
| Cellular Data Only | 81 | 9.3% |
| Satellite Internet | 49 | 5.7% |
| No Internet | 179 | 20.6% |
| Total | 867 | 100.0% |
Canadian Summary
Canada is a country located in North America, bordered by the United States to the south and the Arctic Ocean to the north. It is the world's second-largest country by total area, and its population of approximately 37 million people makes it the world's fourth-most populous nation. Canada is a federal parliamentary democracy and a constitutional monarchy, with Queen Elizabeth II as its head of state.
Texas is a state located in the south-central region of the United States. It is the second-largest state in the country by both area and population, with an estimated population of 28 million people in 2020. Texas is bordered by the states of Oklahoma to the north, Arkansas to the northeast, Louisiana to the east, New Mexico to the west, and Mexico to the south.
Geography
Canada is the world's second-largest country by total area, covering an area of 3,855,100 square miles. It is bordered by the United States to the south and the Arctic Ocean to the north. Canada is divided into ten provinces and three territories, each with its own unique geography. The country is home to a variety of landscapes, including mountains, forests, lakes, rivers, and coastlines.
Texas is the second-largest state in the United States, covering an area of 268,820 square miles. It is bordered by the states of Oklahoma to the north, Arkansas to the northeast, Louisiana to the east, New Mexico to the west, and Mexico to the south. Texas is home to a variety of landscapes, including mountains, forests, deserts, and coastlines.
Economy
Canada has a highly developed economy and is one of the world's wealthiest nations. The country is a major exporter of natural resources, including oil, natural gas, and timber. Canada is also a major producer of agricultural products, such as wheat, corn, and livestock. The country is home to a number of major industries, including automotive, aerospace, and telecommunications.
Texas has a diversified economy and is one of the largest economies in the United States. The state is a major producer of oil and natural gas, and is home to a number of major industries, including aerospace, technology, and healthcare. Texas is also a major producer of agricultural products, such as cotton, cattle, and citrus fruits.
Demographics
Canada has a population of approximately 37 million people, with the majority of the population living in the southern provinces. The country is home to a diverse population, with the largest ethnic groups being British, French, and Aboriginal. The official languages of Canada are English and French.
Texas has an estimated population of 28 million people, with the majority of the population living in the southern and western parts of the state. The largest ethnic groups in Texas are Hispanic, African American, and White. The official language of Texas is English.
Common Questions
What is Per Capita Income in Canadian?
Per Capita income in Canadian is $30,235.
What is the Median Family Income in Canadian?
Median Family Income in Canadian is $76,875.
What is the Median Household income in Canadian?
Median Household Income in Canadian is $54,013.
What is Income or Wage Gap in Canadian?
Income or Wage Gap in Canadian is 33.9%.
Women in Canadian earn 66.1 cents for every dollar earned by a man.
What is Inequality or Gini Index in Canadian?
Inequality or Gini Index in Canadian is 0.40.
What is the Total Population of Canadian?
Total Population of Canadian is 2,330.
What is the Total Male Population of Canadian?
Total Male Population of Canadian is 1,338.
What is the Total Female Population of Canadian?
Total Female Population of Canadian is 992.
What is the Ratio of Males per 100 Females in Canadian?
There are 134.88 Males per 100 Females in Canadian.
What is the Ratio of Females per 100 Males in Canadian?
There are 74.14 Females per 100 Males in Canadian.
What is the Median Population Age in Canadian?
Median Population Age in Canadian is 38.2 Years.
What is the Average Family Size in Canadian
Average Family Size in Canadian is 3.3 People.
What is the Average Household Size in Canadian
Average Household Size in Canadian is 2.6 People.
How Large is the Labor Force in Canadian?
There are 1,172 People in the Labor Forcein in Canadian.
What is the Percentage of People in the Labor Force in Canadian?
66.2% of People are in the Labor Force in Canadian.
What is the Unemployment Rate in Canadian?
Unemployment Rate in Canadian is 3.5%.