Louise, TX Map & Demographics
Louise Map
Louise Overview
$20,451
PER CAPITA INCOME
$61,107
AVG FAMILY INCOME
$59,043
AVG HOUSEHOLD INCOME
79.9%
WAGE / INCOME GAP [ % ]
20.1¢/ $1
WAGE / INCOME GAP [ $ ]
0.42
INEQUALITY / GINI INDEX
961
TOTAL POPULATION
404
MALE POPULATION
557
FEMALE POPULATION
72.53
MALES / 100 FEMALES
137.87
FEMALES / 100 MALES
24.7
MEDIAN AGE
3.6
AVG FAMILY SIZE
2.9
AVG HOUSEHOLD SIZE
458
LABOR FORCE [ PEOPLE ]
71.6%
PERCENT IN LABOR FORCE
Louise Zip Codes
Income in Louise
Income Overview in Louise
Per Capita Income in Louise is $20,451, while median incomes of families and households are $61,107 and $59,043 respectively.
| Characteristic | Number | Measure |
| Per Capita Income | 961 | $20,451 |
| Median Family Income | 167 | $61,107 |
| Mean Family Income | 167 | $75,578 |
| Median Household Income | 328 | $59,043 |
| Mean Household Income | 328 | $57,294 |
| Income Deficit | 167 | $0 |
| Wage / Income Gap (%) | 961 | 79.94% |
| Wage / Income Gap ($) | 961 | 20.06¢ per $1 |
| Gini / Inequality Index | 961 | 0.42 |
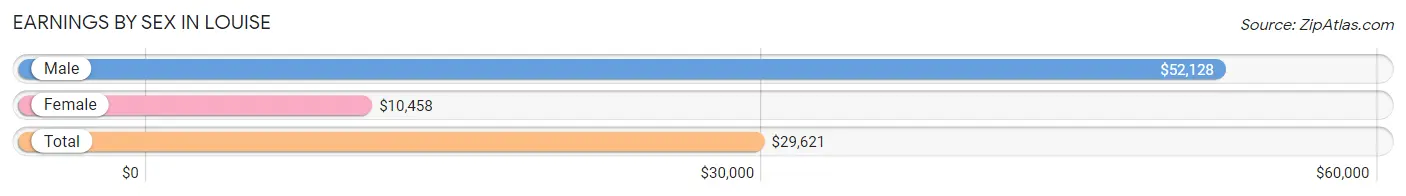
Earnings by Sex in Louise
Average Earnings in Louise are $29,621, $52,128 for men and $10,458 for women, a difference of 79.9%.
| Sex | Number | Average Earnings |
| Male | 216 (43.4%) | $52,128 |
| Female | 282 (56.6%) | $10,458 |
| Total | 498 (100.0%) | $29,621 |
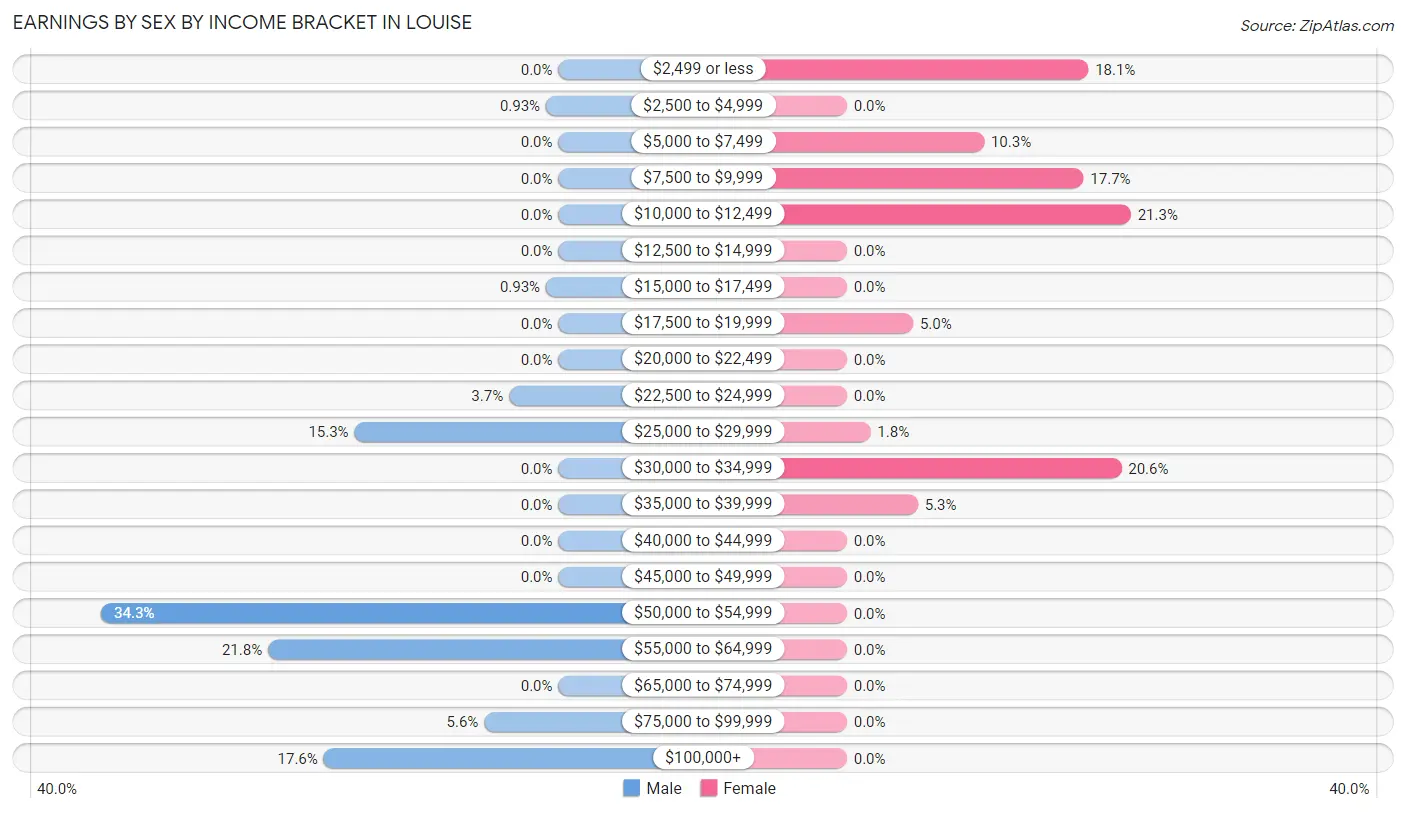
Earnings by Sex by Income Bracket in Louise
The most common earnings brackets in Louise are $50,000 to $54,999 for men (74 | 34.3%) and $10,000 to $12,499 for women (60 | 21.3%).
| Income | Male | Female |
| $2,499 or less | 0 (0.0%) | 51 (18.1%) |
| $2,500 to $4,999 | 2 (0.9%) | 0 (0.0%) |
| $5,000 to $7,499 | 0 (0.0%) | 29 (10.3%) |
| $7,500 to $9,999 | 0 (0.0%) | 50 (17.7%) |
| $10,000 to $12,499 | 0 (0.0%) | 60 (21.3%) |
| $12,500 to $14,999 | 0 (0.0%) | 0 (0.0%) |
| $15,000 to $17,499 | 2 (0.9%) | 0 (0.0%) |
| $17,500 to $19,999 | 0 (0.0%) | 14 (5.0%) |
| $20,000 to $22,499 | 0 (0.0%) | 0 (0.0%) |
| $22,500 to $24,999 | 8 (3.7%) | 0 (0.0%) |
| $25,000 to $29,999 | 33 (15.3%) | 5 (1.8%) |
| $30,000 to $34,999 | 0 (0.0%) | 58 (20.6%) |
| $35,000 to $39,999 | 0 (0.0%) | 15 (5.3%) |
| $40,000 to $44,999 | 0 (0.0%) | 0 (0.0%) |
| $45,000 to $49,999 | 0 (0.0%) | 0 (0.0%) |
| $50,000 to $54,999 | 74 (34.3%) | 0 (0.0%) |
| $55,000 to $64,999 | 47 (21.8%) | 0 (0.0%) |
| $65,000 to $74,999 | 0 (0.0%) | 0 (0.0%) |
| $75,000 to $99,999 | 12 (5.6%) | 0 (0.0%) |
| $100,000+ | 38 (17.6%) | 0 (0.0%) |
| Total | 216 (100.0%) | 282 (100.0%) |
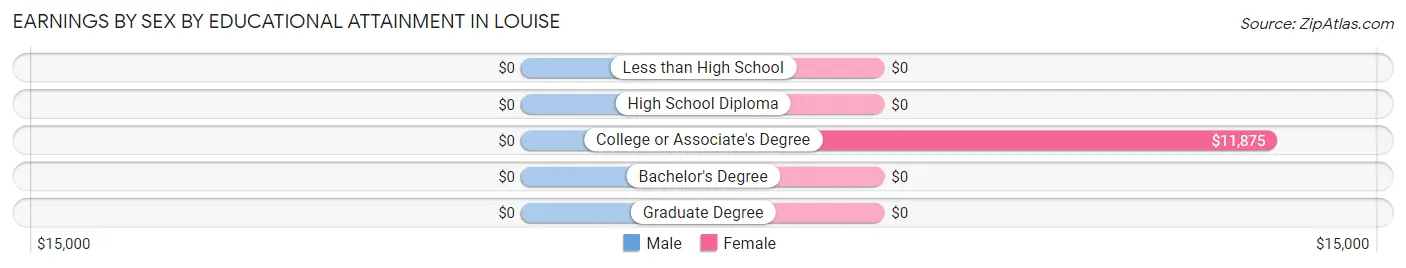
Earnings by Sex by Educational Attainment in Louise
| Educational Attainment | Male Income | Female Income |
| Less than High School | - | - |
| High School Diploma | - | - |
| College or Associate's Degree | - | - |
| Bachelor's Degree | - | - |
| Graduate Degree | - | - |
| Total | $51,985 | $26,000 |
Family Income in Louise
Family Income Brackets in Louise
According to the Louise family income data, there are 92 families falling into the $50,000 to $74,999 income range, which is the most common income bracket and makes up 55.1% of all families.
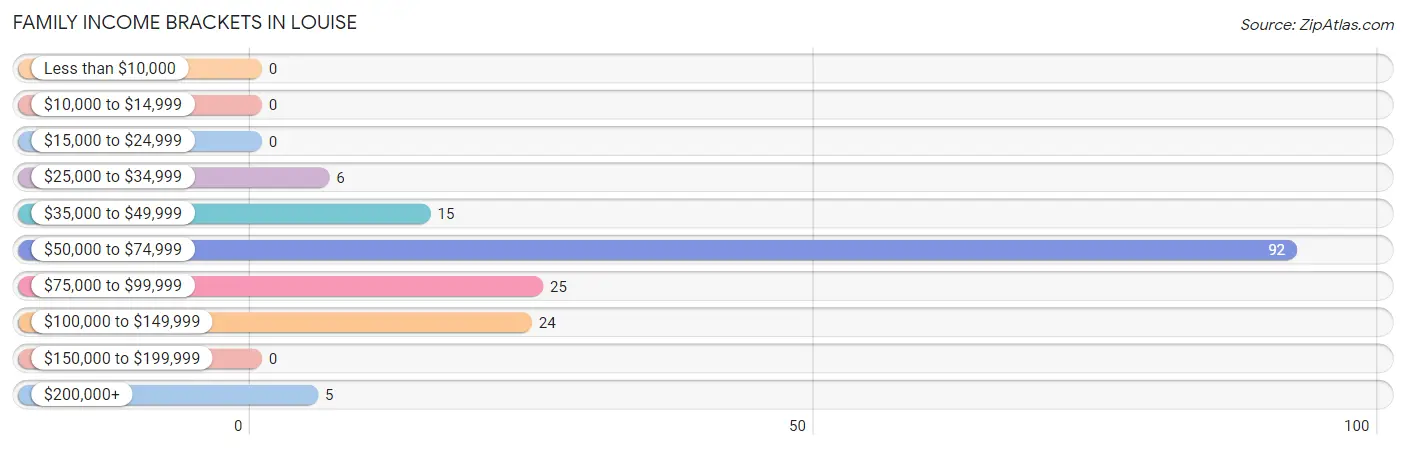
| Income Bracket | # Families | % Families |
| Less than $10,000 | 0 | 0.0% |
| $10,000 to $14,999 | 0 | 0.0% |
| $15,000 to $24,999 | 0 | 0.0% |
| $25,000 to $34,999 | 6 | 3.6% |
| $35,000 to $49,999 | 15 | 9.0% |
| $50,000 to $74,999 | 92 | 55.1% |
| $75,000 to $99,999 | 25 | 15.0% |
| $100,000 to $149,999 | 24 | 14.4% |
| $150,000 to $199,999 | 0 | 0.0% |
| $200,000+ | 5 | 3.0% |
Family Income by Famaliy Size in Louise
2-person families (89 | 53.3%) account for the highest median family income in Louise with $57,048 per family, while 2-person families (89 | 53.3%) have the highest median income of $28,524 per family member.
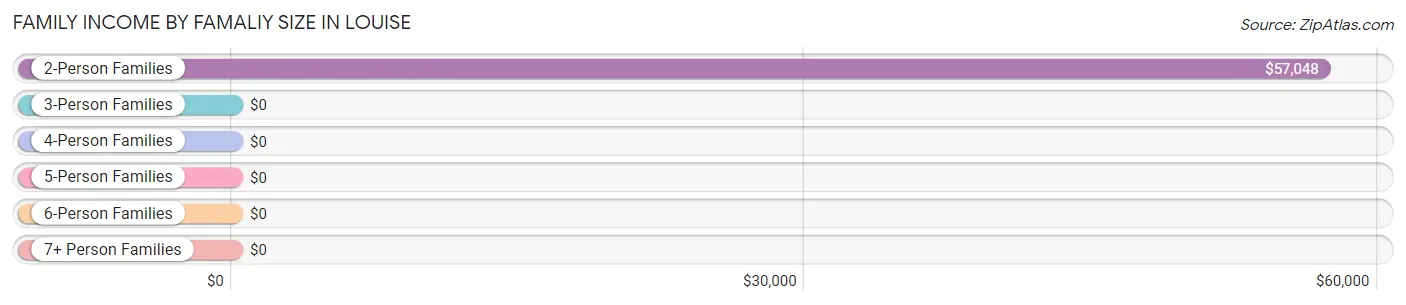
| Income Bracket | # Families | Median Income |
| 2-Person Families | 89 (53.3%) | $57,048 |
| 3-Person Families | 15 (9.0%) | $0 |
| 4-Person Families | 25 (15.0%) | $0 |
| 5-Person Families | 5 (3.0%) | $0 |
| 6-Person Families | 0 (0.0%) | $0 |
| 7+ Person Families | 33 (19.8%) | $0 |
| Total | 167 (100.0%) | $61,107 |
Family Income by Number of Earners in Louise
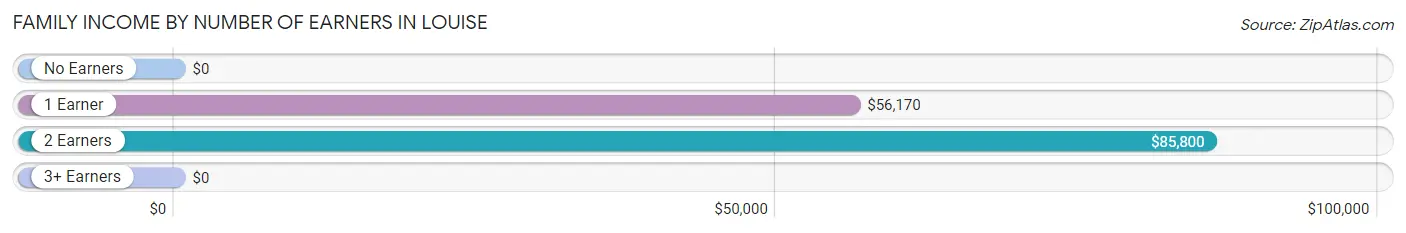
| Number of Earners | # Families | Median Income |
| No Earners | 6 (3.6%) | $0 |
| 1 Earner | 74 (44.3%) | $56,170 |
| 2 Earners | 82 (49.1%) | $85,800 |
| 3+ Earners | 5 (3.0%) | $0 |
| Total | 167 (100.0%) | $61,107 |
Household Income in Louise
Household Income Brackets in Louise
With 115 households falling in the category, the $50,000 to $74,999 income range is the most frequent in Louise, accounting for 35.1% of all households.
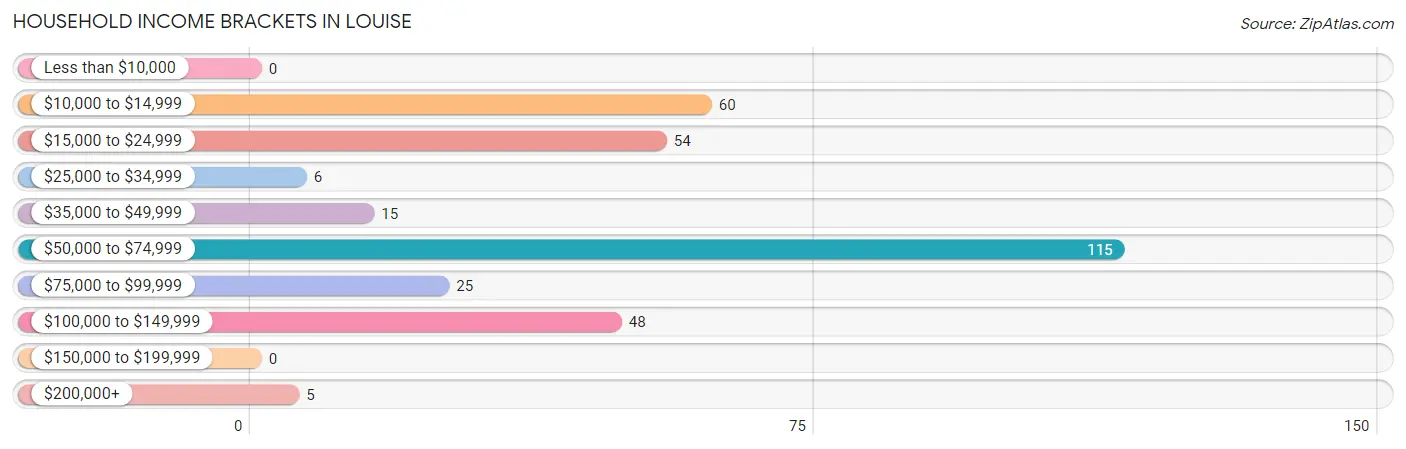
| Income Bracket | # Households | % Households |
| Less than $10,000 | 0 | 0.0% |
| $10,000 to $14,999 | 60 | 18.3% |
| $15,000 to $24,999 | 54 | 16.5% |
| $25,000 to $34,999 | 6 | 1.8% |
| $35,000 to $49,999 | 15 | 4.6% |
| $50,000 to $74,999 | 115 | 35.1% |
| $75,000 to $99,999 | 25 | 7.6% |
| $100,000 to $149,999 | 48 | 14.6% |
| $150,000 to $199,999 | 0 | 0.0% |
| $200,000+ | 5 | 1.5% |
Household Income by Householder Age in Louise
The median household income in Louise is $59,043, with the highest median household income of $59,202 found in the 25 to 44 years age bracket for the primary householder. A total of 170 households (51.8%) fall into this category. Meanwhile, the 15 to 24 years age bracket for the primary householder has the lowest median household income of $0, with 47 households (14.3%) in this group.
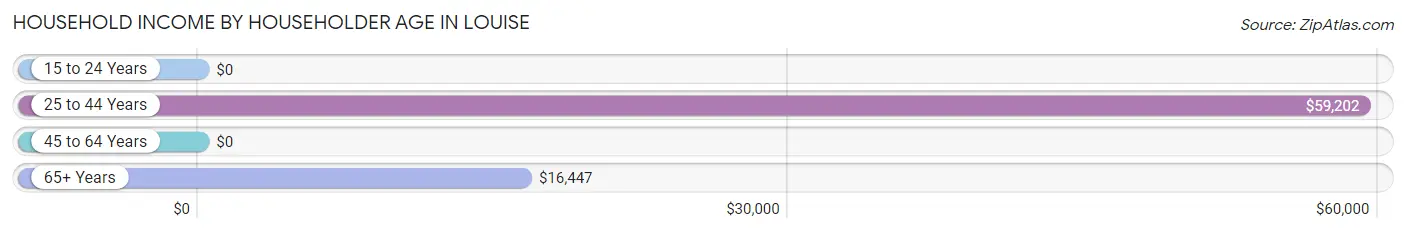
| Income Bracket | # Households | Median Income |
| 15 to 24 Years | 47 (14.3%) | $0 |
| 25 to 44 Years | 170 (51.8%) | $59,202 |
| 45 to 64 Years | 23 (7.0%) | $0 |
| 65+ Years | 88 (26.8%) | $16,447 |
| Total | 328 (100.0%) | $59,043 |
Poverty in Louise
Income Below Poverty by Sex and Age in Louise
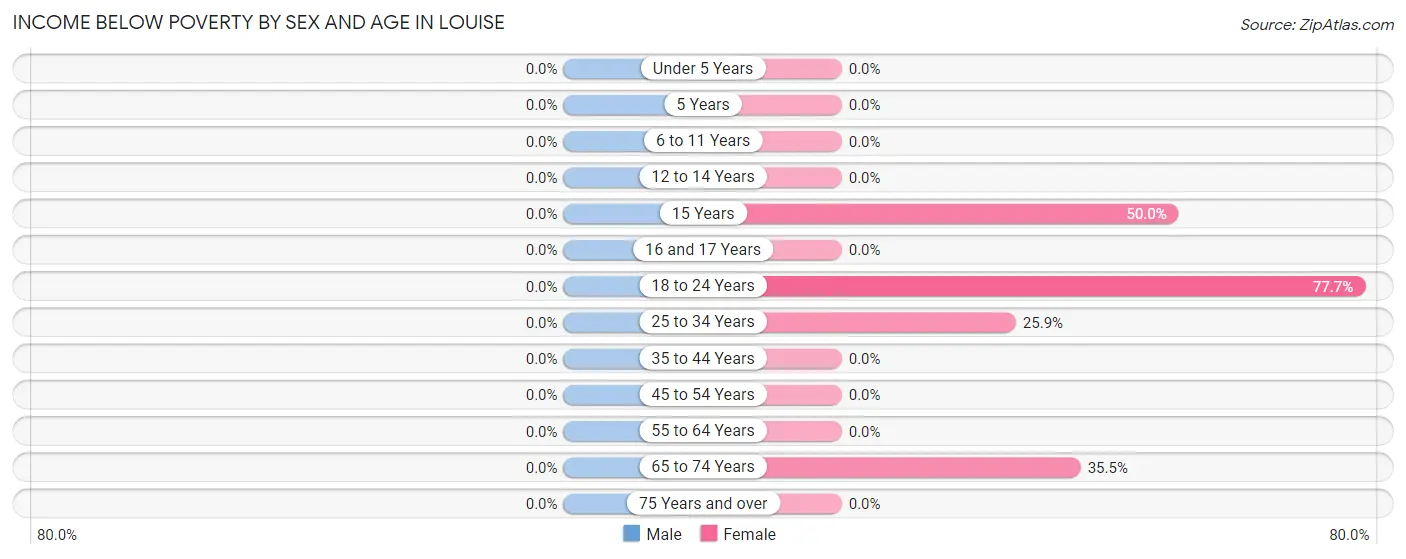
| Age Bracket | Male | Female |
| Under 5 Years | 0 (0.0%) | 0 (0.0%) |
| 5 Years | 0 (0.0%) | 0 (0.0%) |
| 6 to 11 Years | 0 (0.0%) | 0 (0.0%) |
| 12 to 14 Years | 0 (0.0%) | 0 (0.0%) |
| 15 Years | 0 (0.0%) | 2 (50.0%) |
| 16 and 17 Years | 0 (0.0%) | 0 (0.0%) |
| 18 to 24 Years | 0 (0.0%) | 101 (77.7%) |
| 25 to 34 Years | 0 (0.0%) | 38 (25.9%) |
| 35 to 44 Years | 0 (0.0%) | 0 (0.0%) |
| 45 to 54 Years | 0 (0.0%) | 0 (0.0%) |
| 55 to 64 Years | 0 (0.0%) | 0 (0.0%) |
| 65 to 74 Years | 0 (0.0%) | 22 (35.5%) |
| 75 Years and over | 0 (0.0%) | 0 (0.0%) |
| Total | 0 (0.0%) | 163 (33.1%) |
Income Above Poverty by Sex and Age in Louise
According to the poverty statistics in Louise, males aged under 5 years and females aged under 5 years are the age groups that are most secure financially, with 100.0% of males and 100.0% of females in these age groups living above the poverty line.
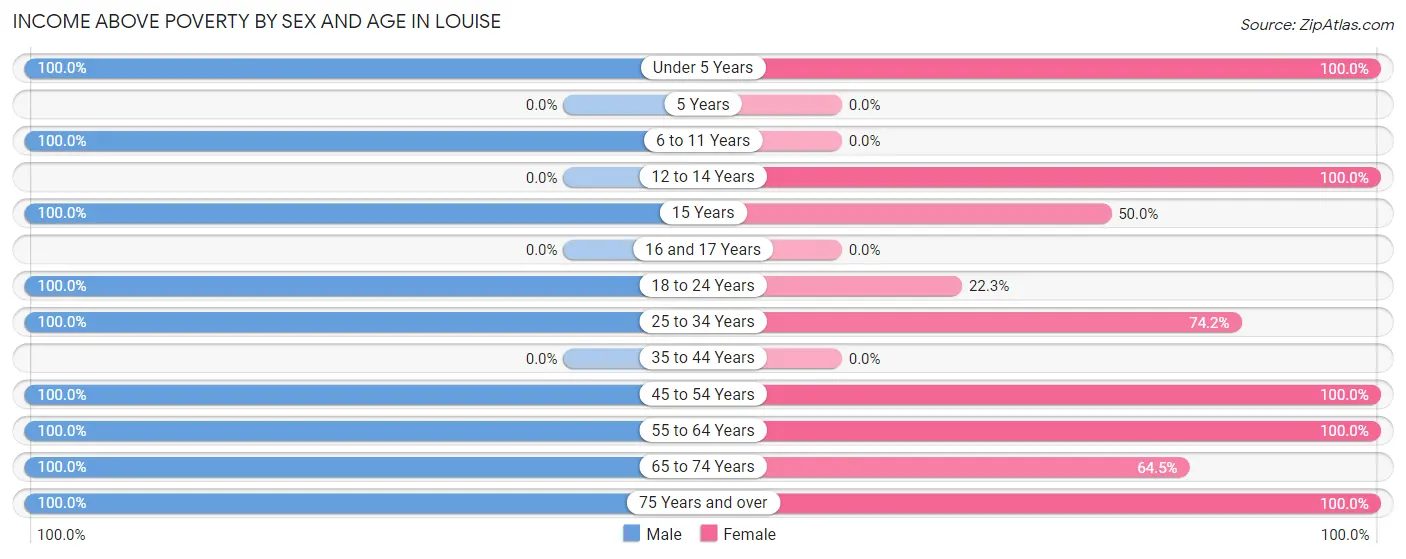
| Age Bracket | Male | Female |
| Under 5 Years | 54 (100.0%) | 82 (100.0%) |
| 5 Years | 0 (0.0%) | 0 (0.0%) |
| 6 to 11 Years | 47 (100.0%) | 0 (0.0%) |
| 12 to 14 Years | 0 (0.0%) | 27 (100.0%) |
| 15 Years | 42 (100.0%) | 2 (50.0%) |
| 16 and 17 Years | 0 (0.0%) | 0 (0.0%) |
| 18 to 24 Years | 49 (100.0%) | 29 (22.3%) |
| 25 to 34 Years | 143 (100.0%) | 109 (74.2%) |
| 35 to 44 Years | 0 (0.0%) | 0 (0.0%) |
| 45 to 54 Years | 35 (100.0%) | 5 (100.0%) |
| 55 to 64 Years | 14 (100.0%) | 17 (100.0%) |
| 65 to 74 Years | 4 (100.0%) | 40 (64.5%) |
| 75 Years and over | 16 (100.0%) | 18 (100.0%) |
| Total | 404 (100.0%) | 329 (66.9%) |
Income Below Poverty Among Married-Couple Families in Louise
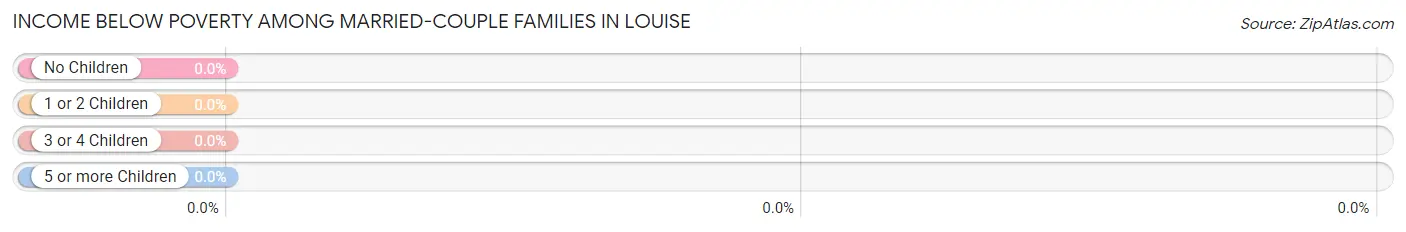
| Children | Above Poverty | Below Poverty |
| No Children | 20 (100.0%) | 0 (0.0%) |
| 1 or 2 Children | 30 (100.0%) | 0 (0.0%) |
| 3 or 4 Children | 0 (0.0%) | 0 (0.0%) |
| 5 or more Children | 33 (100.0%) | 0 (0.0%) |
| Total | 83 (100.0%) | 0 (0.0%) |
Income Below Poverty Among Single-Parent Households in Louise
| Children | Single Father | Single Mother |
| No Children | 0 (0.0%) | 0 (0.0%) |
| 1 or 2 Children | 0 (0.0%) | 0 (0.0%) |
| 3 or 4 Children | 0 (0.0%) | 0 (0.0%) |
| 5 or more Children | 0 (0.0%) | 0 (0.0%) |
| Total | 0 (0.0%) | 0 (0.0%) |
Income Below Poverty Among Married-Couple vs Single-Parent Households in Louise
| Children | Married-Couple Families | Single-Parent Households |
| No Children | 0 (0.0%) | 0 (0.0%) |
| 1 or 2 Children | 0 (0.0%) | 0 (0.0%) |
| 3 or 4 Children | 0 (0.0%) | 0 (0.0%) |
| 5 or more Children | 0 (0.0%) | 0 (0.0%) |
| Total | 0 (0.0%) | 0 (0.0%) |
Race in Louise
The most populous races in Louise are White / Caucasian (784 | 81.6%), Hispanic or Latino (422 | 43.9%), and Two or more Races (123 | 12.8%).
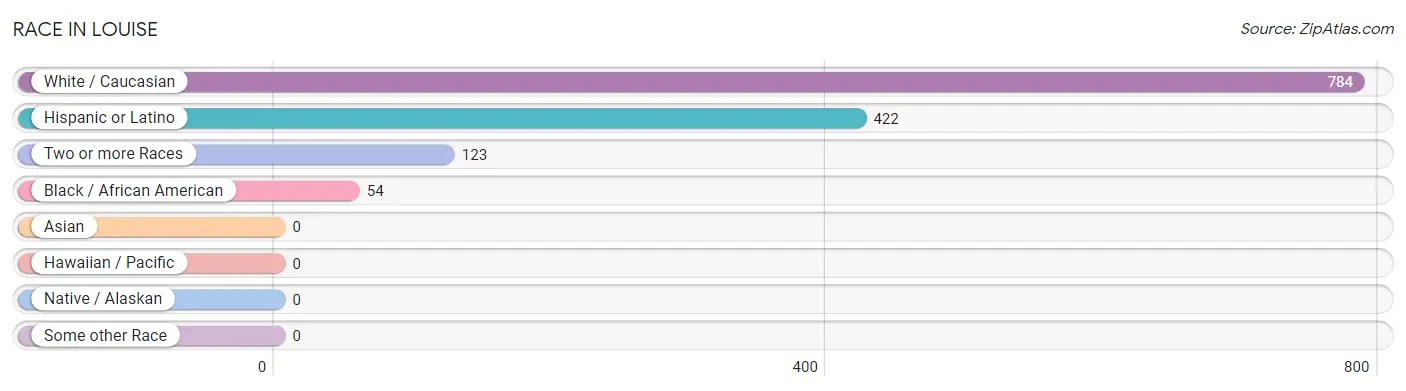
| Race | # Population | % Population |
| Asian | 0 | 0.0% |
| Black / African American | 54 | 5.6% |
| Hawaiian / Pacific | 0 | 0.0% |
| Hispanic or Latino | 422 | 43.9% |
| Native / Alaskan | 0 | 0.0% |
| White / Caucasian | 784 | 81.6% |
| Two or more Races | 123 | 12.8% |
| Some other Race | 0 | 0.0% |
| Total | 961 | 100.0% |
Ancestry in Louise
The most populous ancestries reported in Louise are Mexican (420 | 43.7%), English (96 | 10.0%), German (88 | 9.2%), Czech (70 | 7.3%), and Irish (30 | 3.1%), together accounting for 73.3% of all Louise residents.
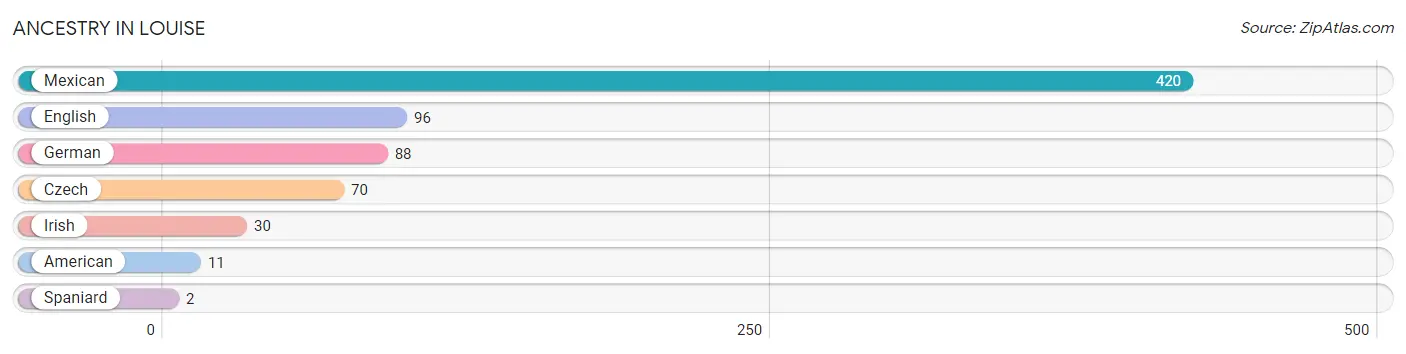
| Ancestry | # Population | % Population |
| American | 11 | 1.1% |
| Czech | 70 | 7.3% |
| English | 96 | 10.0% |
| German | 88 | 9.2% |
| Irish | 30 | 3.1% |
| Mexican | 420 | 43.7% |
| Spaniard | 2 | 0.2% | View All 7 Rows |
Immigrants in Louise
The most numerous immigrant groups reported in Louise came from Central America (104 | 10.8%), Latin America (104 | 10.8%), Mexico (104 | 10.8%), Europe (2 | 0.2%), and Southern Europe (2 | 0.2%), together accounting for 32.9% of all Louise residents.
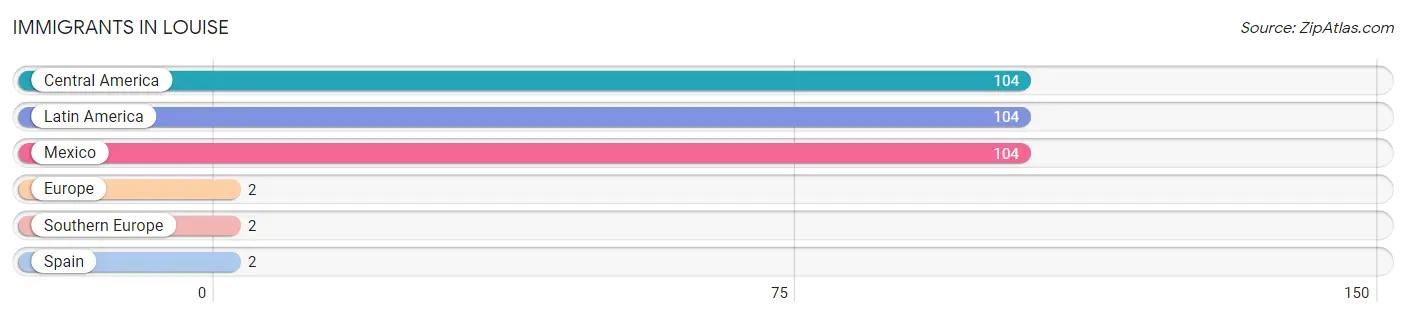
| Immigration Origin | # Population | % Population |
| Central America | 104 | 10.8% |
| Europe | 2 | 0.2% |
| Latin America | 104 | 10.8% |
| Mexico | 104 | 10.8% |
| Southern Europe | 2 | 0.2% |
| Spain | 2 | 0.2% | View All 6 Rows |
Sex and Age in Louise
Sex and Age in Louise
The most populous age groups in Louise are 25 to 29 Years (98 | 24.3%) for men and Under 5 Years (120 | 21.5%) for women.
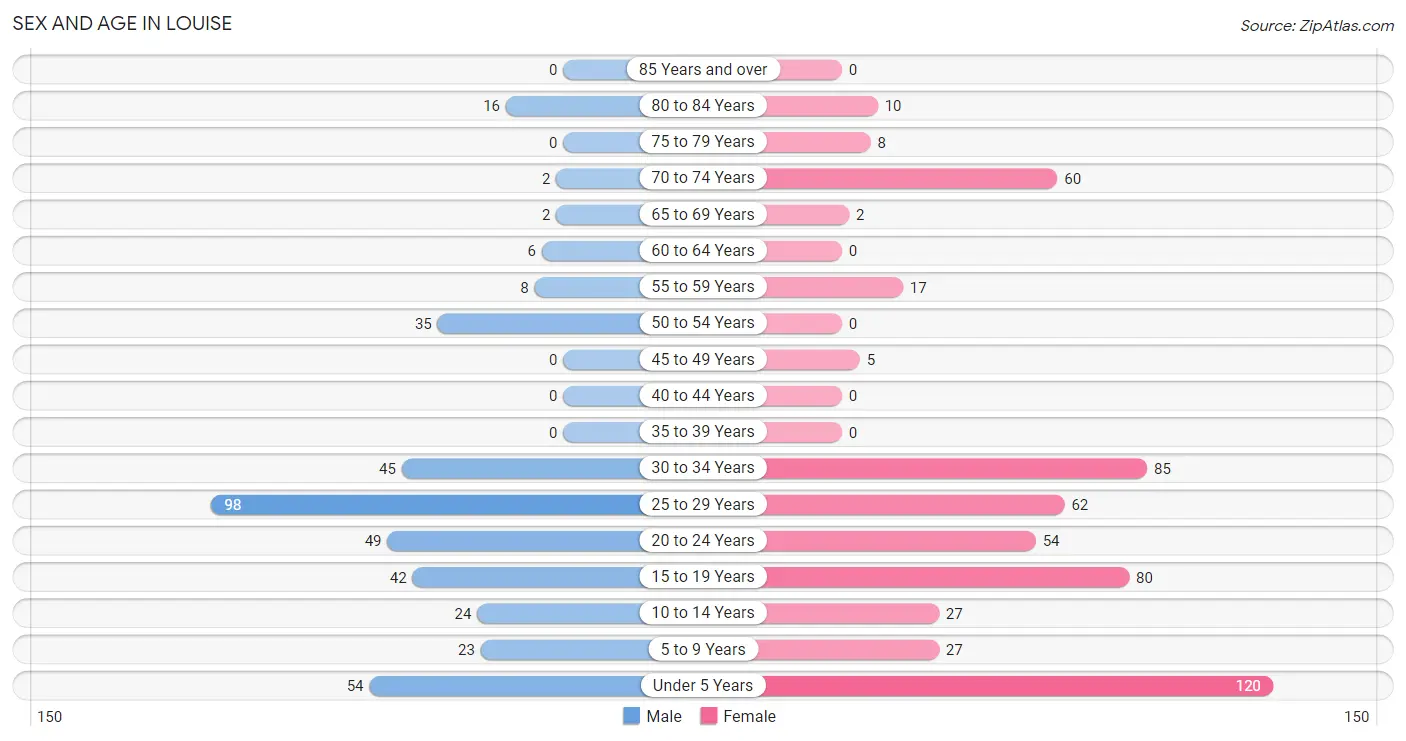
| Age Bracket | Male | Female |
| Under 5 Years | 54 (13.4%) | 120 (21.5%) |
| 5 to 9 Years | 23 (5.7%) | 27 (4.9%) |
| 10 to 14 Years | 24 (5.9%) | 27 (4.9%) |
| 15 to 19 Years | 42 (10.4%) | 80 (14.4%) |
| 20 to 24 Years | 49 (12.1%) | 54 (9.7%) |
| 25 to 29 Years | 98 (24.3%) | 62 (11.1%) |
| 30 to 34 Years | 45 (11.1%) | 85 (15.3%) |
| 35 to 39 Years | 0 (0.0%) | 0 (0.0%) |
| 40 to 44 Years | 0 (0.0%) | 0 (0.0%) |
| 45 to 49 Years | 0 (0.0%) | 5 (0.9%) |
| 50 to 54 Years | 35 (8.7%) | 0 (0.0%) |
| 55 to 59 Years | 8 (2.0%) | 17 (3.0%) |
| 60 to 64 Years | 6 (1.5%) | 0 (0.0%) |
| 65 to 69 Years | 2 (0.5%) | 2 (0.4%) |
| 70 to 74 Years | 2 (0.5%) | 60 (10.8%) |
| 75 to 79 Years | 0 (0.0%) | 8 (1.4%) |
| 80 to 84 Years | 16 (4.0%) | 10 (1.8%) |
| 85 Years and over | 0 (0.0%) | 0 (0.0%) |
| Total | 404 (100.0%) | 557 (100.0%) |
Families and Households in Louise
Median Family Size in Louise
The median family size in Louise is 3.65 persons per family, with married-couple families (83 | 49.7%) accounting for the largest median family size of 5.14 persons per family. On the other hand, single male/father families (59 | 35.3%) represent the smallest median family size with 1.86 persons per family.
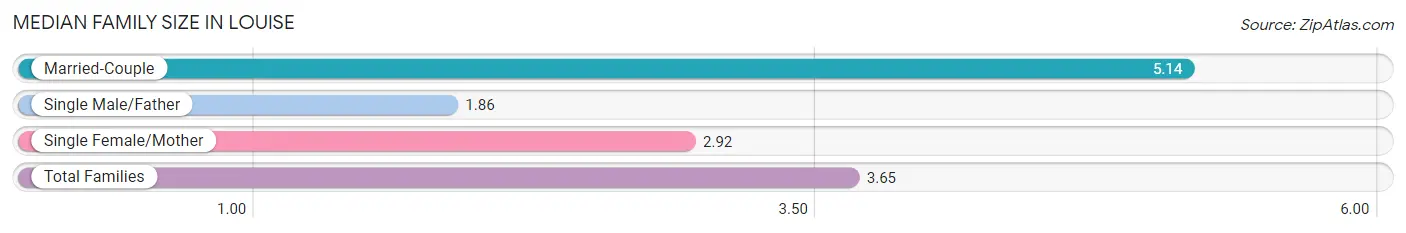
| Family Type | # Families | Family Size |
| Married-Couple | 83 (49.7%) | 5.14 |
| Single Male/Father | 59 (35.3%) | 1.86 |
| Single Female/Mother | 25 (15.0%) | 2.92 |
| Total Families | 167 (100.0%) | 3.65 |
Median Household Size in Louise
The median household size in Louise is 2.93 persons per household, with married-couple households (83 | 25.3%) accounting for the largest median household size of 5.17 persons per household. non-family households (161 | 49.1%) represent the smallest median household size with 1.85 persons per household.
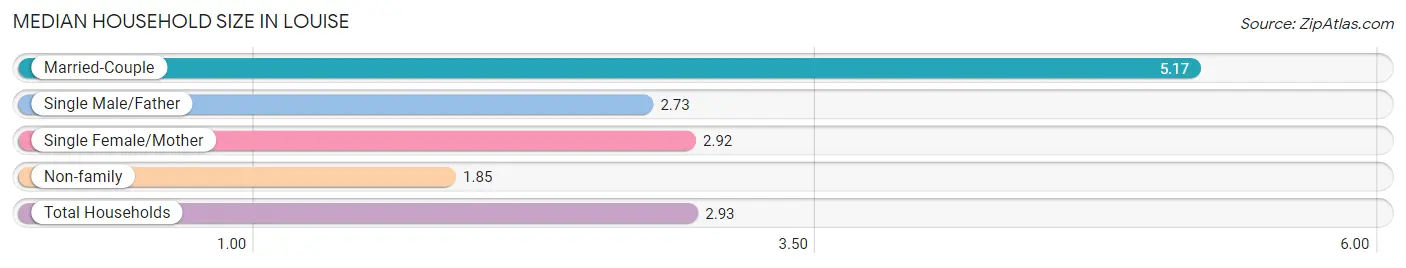
| Household Type | # Households | Household Size |
| Married-Couple | 83 (25.3%) | 5.17 |
| Single Male/Father | 59 (18.0%) | 2.73 |
| Single Female/Mother | 25 (7.6%) | 2.92 |
| Non-family | 161 (49.1%) | 1.85 |
| Total Households | 328 (100.0%) | 2.93 |
Household Size by Marriage Status in Louise
Out of a total of 328 households in Louise, 167 (50.9%) are family households, while 161 (49.1%) are nonfamily households. The most numerous type of family households are 3-person households, comprising 62, and the most common type of nonfamily households are 1-person households, comprising 114.
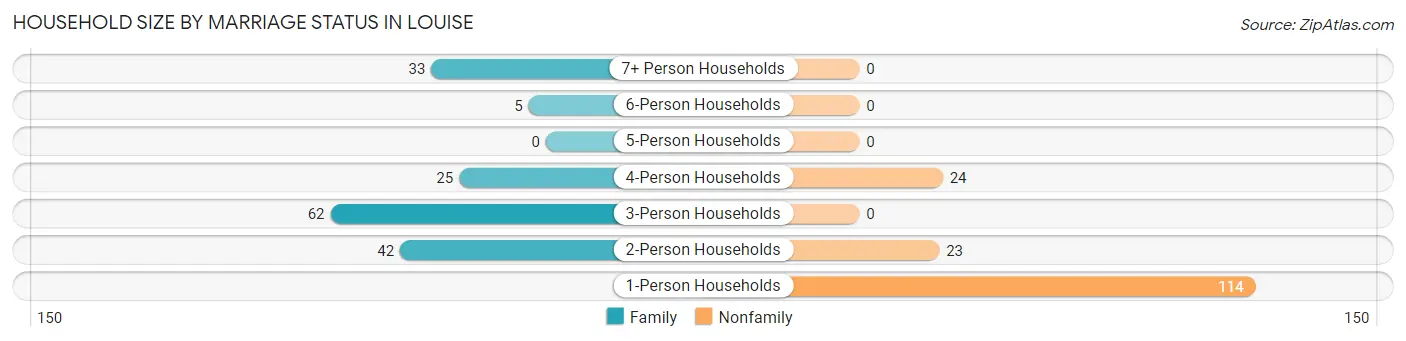
| Household Size | Family Households | Nonfamily Households |
| 1-Person Households | - | 114 (34.8%) |
| 2-Person Households | 42 (12.8%) | 23 (7.0%) |
| 3-Person Households | 62 (18.9%) | 0 (0.0%) |
| 4-Person Households | 25 (7.6%) | 24 (7.3%) |
| 5-Person Households | 0 (0.0%) | 0 (0.0%) |
| 6-Person Households | 5 (1.5%) | 0 (0.0%) |
| 7+ Person Households | 33 (10.1%) | 0 (0.0%) |
| Total | 167 (50.9%) | 161 (49.1%) |
Female Fertility in Louise
Fertility by Age in Louise
Average fertility rate in Louise is 381.0 births per 1,000 women. Women in the age bracket of 20 to 34 years have the highest fertility rate with 542.0 births per 1,000 women. Women in the age bracket of 20 to 34 years acount for 100.0% of all women with births.
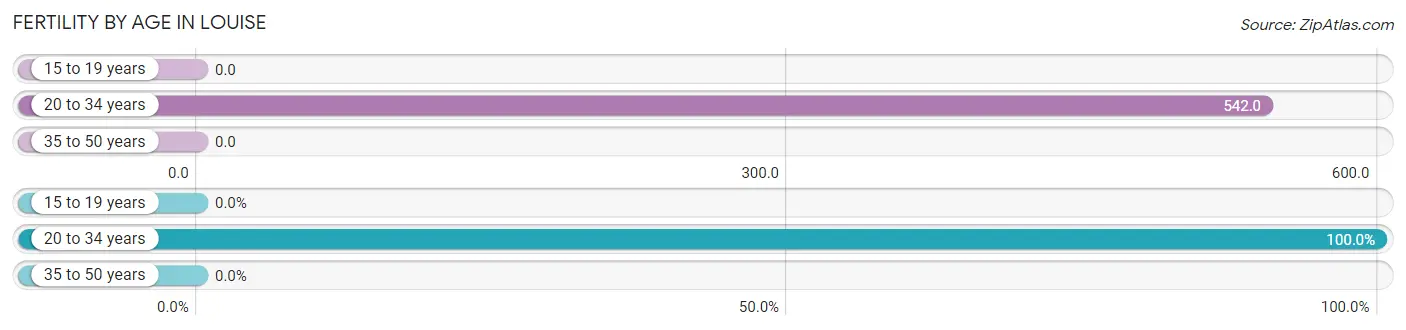
| Age Bracket | Women with Births | Births / 1,000 Women |
| 15 to 19 years | 0 (0.0%) | 0.0 |
| 20 to 34 years | 109 (100.0%) | 542.0 |
| 35 to 50 years | 0 (0.0%) | 0.0 |
| Total | 109 (100.0%) | 381.0 |
Fertility by Age by Marriage Status in Louise
53.2% of women with births (109) in Louise are married. The highest percentage of unmarried women with births falls into 20 to 34 years age bracket with 46.8% of them unmarried at the time of birth, while the lowest percentage of unmarried women with births belong to 20 to 34 years age bracket with 46.8% of them unmarried.
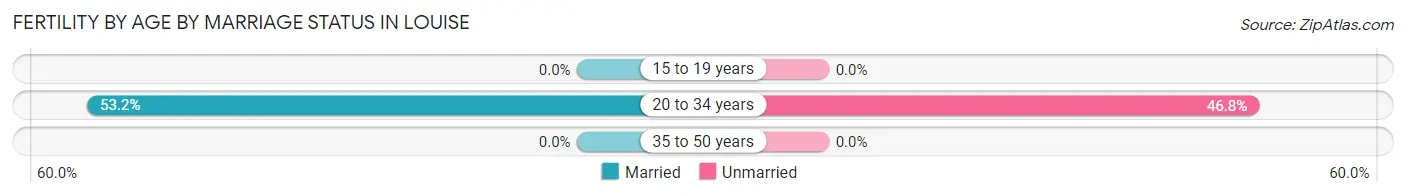
| Age Bracket | Married | Unmarried |
| 15 to 19 years | 0 (0.0%) | 0 (0.0%) |
| 20 to 34 years | 58 (53.2%) | 51 (46.8%) |
| 35 to 50 years | 0 (0.0%) | 0 (0.0%) |
| Total | 58 (53.2%) | 51 (46.8%) |
Fertility by Education in Louise
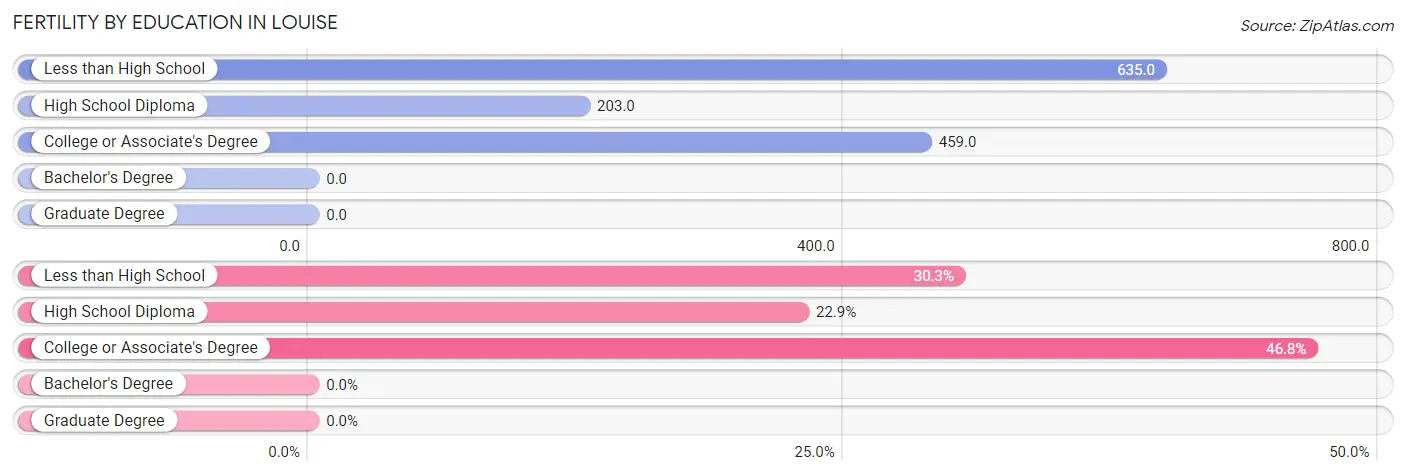
| Educational Attainment | Women with Births | Births / 1,000 Women |
| Less than High School | 33 (30.3%) | 635.0 |
| High School Diploma | 25 (22.9%) | 203.0 |
| College or Associate's Degree | 51 (46.8%) | 459.0 |
| Bachelor's Degree | 0 (0.0%) | 0.0 |
| Graduate Degree | 0 (0.0%) | 0.0 |
| Total | 109 (100.0%) | 381.0 |
Fertility by Education by Marriage Status in Louise
46.8% of women with births in Louise are unmarried. Women with the educational attainment of less than high school are most likely to be married with 100.0% of them married at childbirth, while women with the educational attainment of college or associate's degree are least likely to be married with 100.0% of them unmarried at childbirth.
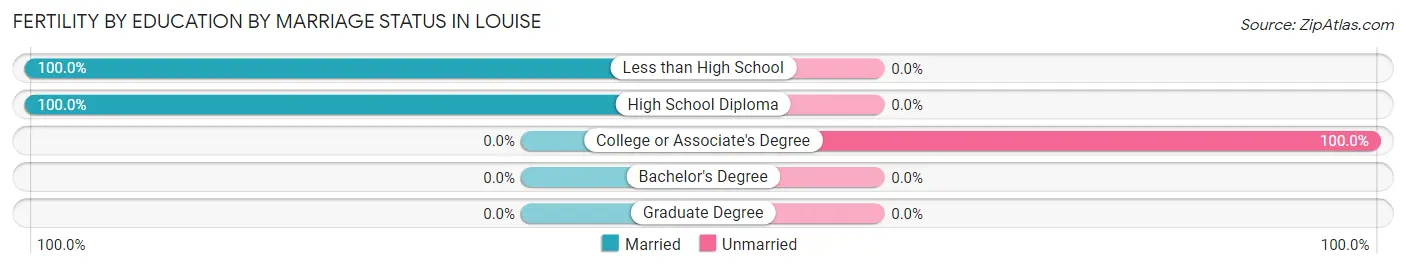
| Educational Attainment | Married | Unmarried |
| Less than High School | 33 (100.0%) | 0 (0.0%) |
| High School Diploma | 25 (100.0%) | 0 (0.0%) |
| College or Associate's Degree | 0 (0.0%) | 51 (100.0%) |
| Bachelor's Degree | 0 (0.0%) | 0 (0.0%) |
| Graduate Degree | 0 (0.0%) | 0 (0.0%) |
| Total | 58 (53.2%) | 51 (46.8%) |
Employment Characteristics in Louise
Employment by Class of Employer in Louise
Among the 425 employed individuals in Louise, private company employees (338 | 79.5%), not-for-profit organizations (53 | 12.5%), and self-employed (not incorporated) (22 | 5.2%) make up the most common classes of employment.
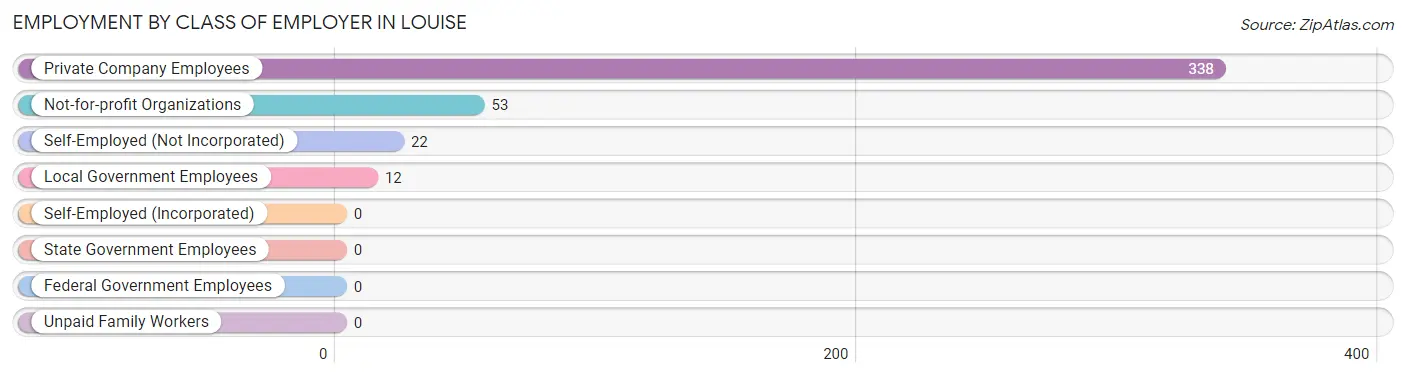
| Employer Class | # Employees | % Employees |
| Private Company Employees | 338 | 79.5% |
| Self-Employed (Incorporated) | 0 | 0.0% |
| Self-Employed (Not Incorporated) | 22 | 5.2% |
| Not-for-profit Organizations | 53 | 12.5% |
| Local Government Employees | 12 | 2.8% |
| State Government Employees | 0 | 0.0% |
| Federal Government Employees | 0 | 0.0% |
| Unpaid Family Workers | 0 | 0.0% |
| Total | 425 | 100.0% |
Employment Status by Age in Louise
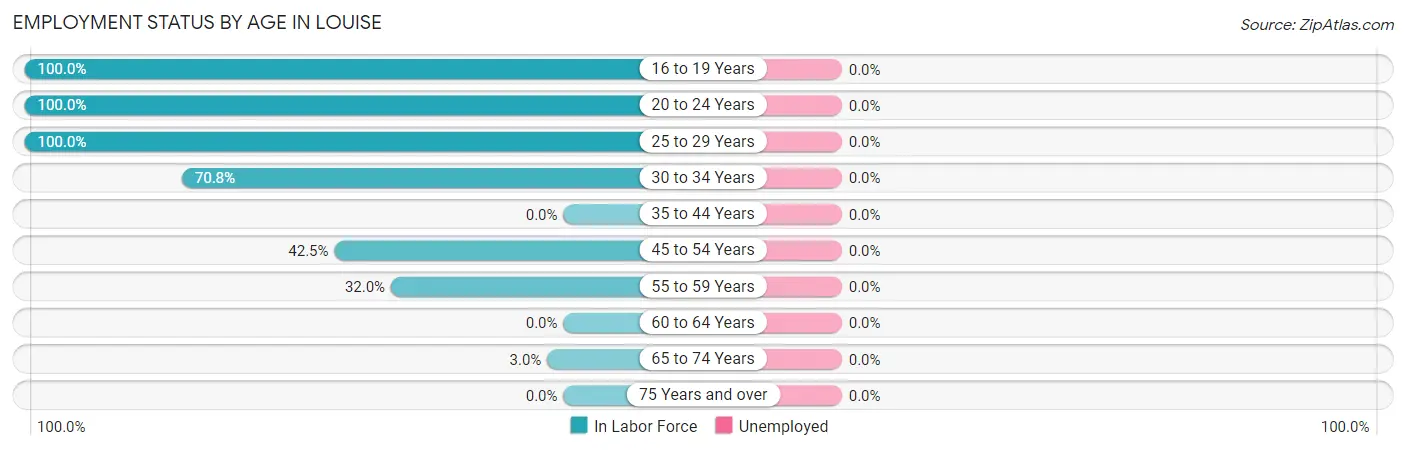
| Age Bracket | In Labor Force | Unemployed |
| 16 to 19 Years | 76 (100.0%) | 0 (0.0%) |
| 20 to 24 Years | 103 (100.0%) | 0 (0.0%) |
| 25 to 29 Years | 160 (100.0%) | 0 (0.0%) |
| 30 to 34 Years | 92 (70.8%) | 0 (0.0%) |
| 35 to 44 Years | 0 (0.0%) | 0 (0.0%) |
| 45 to 54 Years | 17 (42.5%) | 0 (0.0%) |
| 55 to 59 Years | 8 (32.0%) | 0 (0.0%) |
| 60 to 64 Years | 0 (0.0%) | 0 (0.0%) |
| 65 to 74 Years | 2 (3.0%) | 0 (0.0%) |
| 75 Years and over | 0 (0.0%) | 0 (0.0%) |
| Total | 458 (71.6%) | 0 (0.0%) |
Employment Status by Educational Attainment in Louise
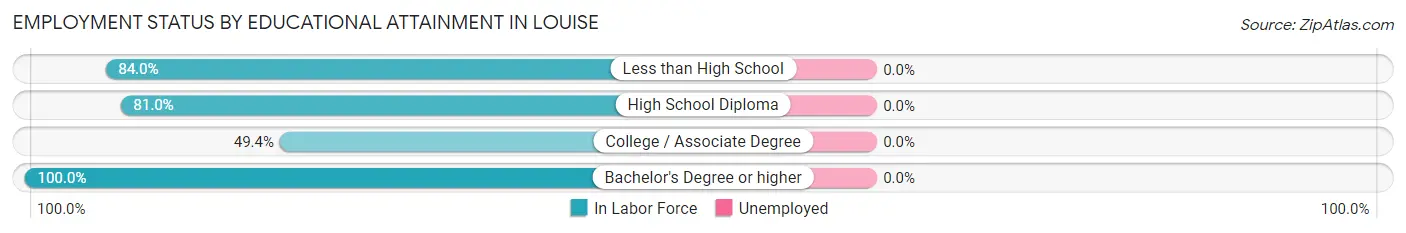
| Educational Attainment | In Labor Force | Unemployed |
| Less than High School | 89 (84.0%) | 0 (0.0%) |
| High School Diploma | 98 (81.0%) | 0 (0.0%) |
| College / Associate Degree | 43 (49.4%) | 0 (0.0%) |
| Bachelor's Degree or higher | 47 (100.0%) | 0 (0.0%) |
| Total | 277 (76.7%) | 0 (0.0%) |
Employment Occupations by Sex in Louise
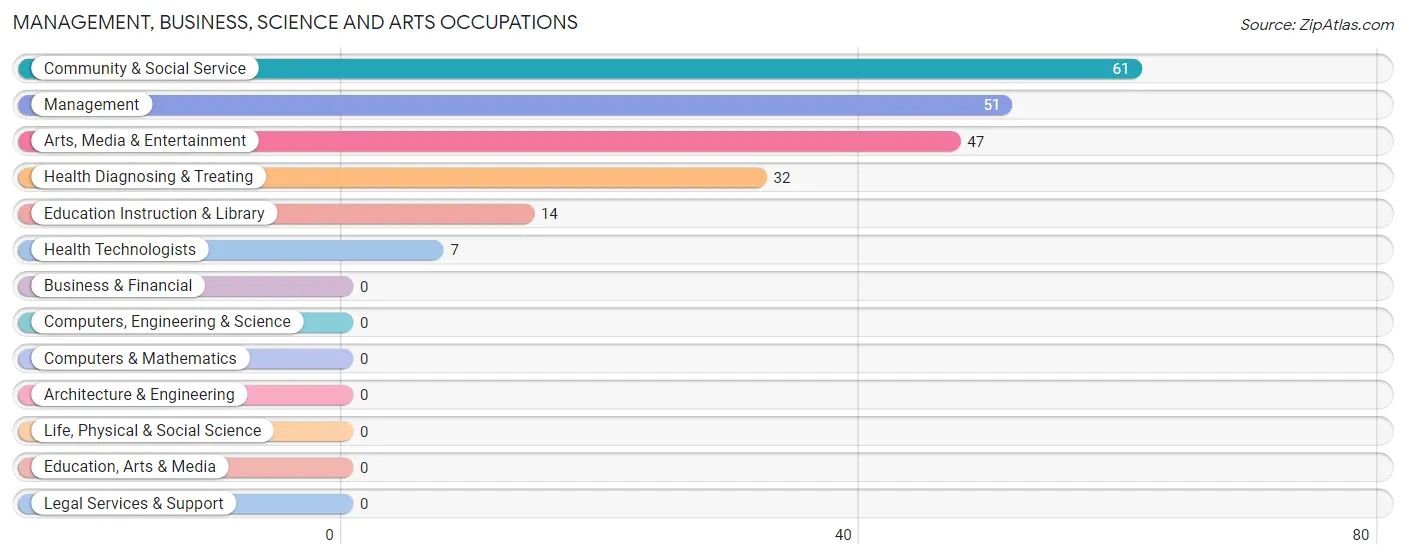
Management, Business, Science and Arts Occupations
The most common Management, Business, Science and Arts occupations in Louise are Community & Social Service (61 | 13.3%), Management (51 | 11.1%), Arts, Media & Entertainment (47 | 10.3%), Health Diagnosing & Treating (32 | 7.0%), and Education Instruction & Library (14 | 3.1%).
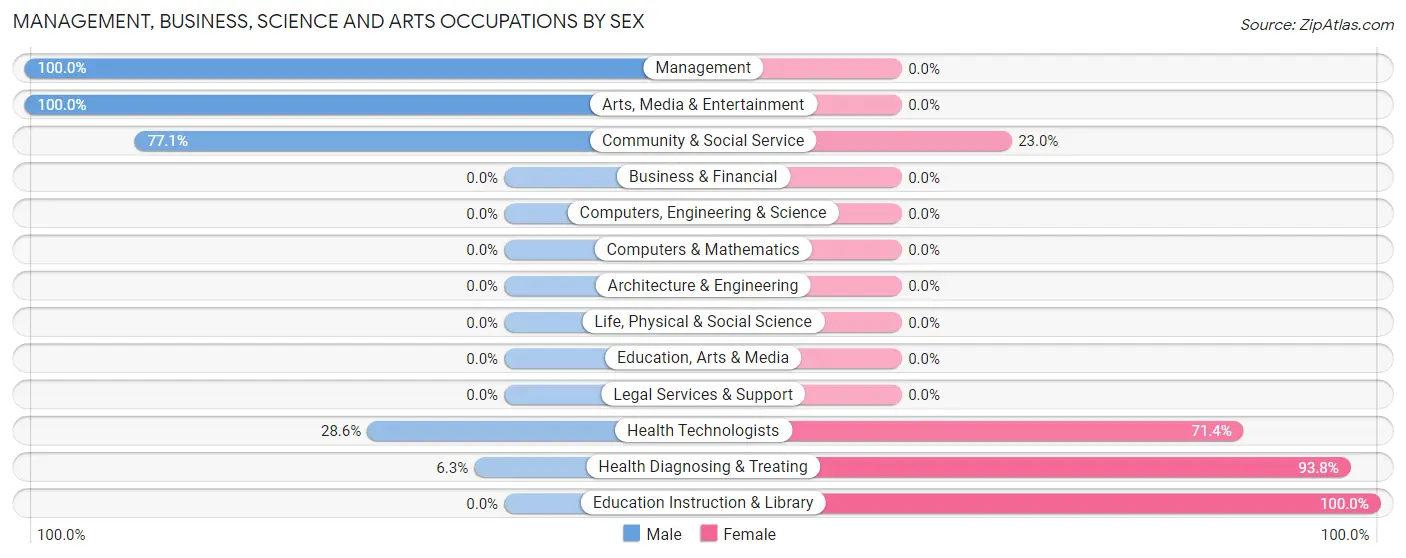
Management, Business, Science and Arts Occupations by Sex
Within the Management, Business, Science and Arts occupations in Louise, the most male-oriented occupations are Management (100.0%), Arts, Media & Entertainment (100.0%), and Community & Social Service (77.0%), while the most female-oriented occupations are Education Instruction & Library (100.0%), Health Diagnosing & Treating (93.8%), and Health Technologists (71.4%).
| Occupation | Male | Female |
| Management | 51 (100.0%) | 0 (0.0%) |
| Business & Financial | 0 (0.0%) | 0 (0.0%) |
| Computers, Engineering & Science | 0 (0.0%) | 0 (0.0%) |
| Computers & Mathematics | 0 (0.0%) | 0 (0.0%) |
| Architecture & Engineering | 0 (0.0%) | 0 (0.0%) |
| Life, Physical & Social Science | 0 (0.0%) | 0 (0.0%) |
| Community & Social Service | 47 (77.0%) | 14 (23.0%) |
| Education, Arts & Media | 0 (0.0%) | 0 (0.0%) |
| Legal Services & Support | 0 (0.0%) | 0 (0.0%) |
| Education Instruction & Library | 0 (0.0%) | 14 (100.0%) |
| Arts, Media & Entertainment | 47 (100.0%) | 0 (0.0%) |
| Health Diagnosing & Treating | 2 (6.2%) | 30 (93.8%) |
| Health Technologists | 2 (28.6%) | 5 (71.4%) |
| Total (Category) | 100 (69.4%) | 44 (30.6%) |
| Total (Overall) | 214 (46.7%) | 244 (53.3%) |
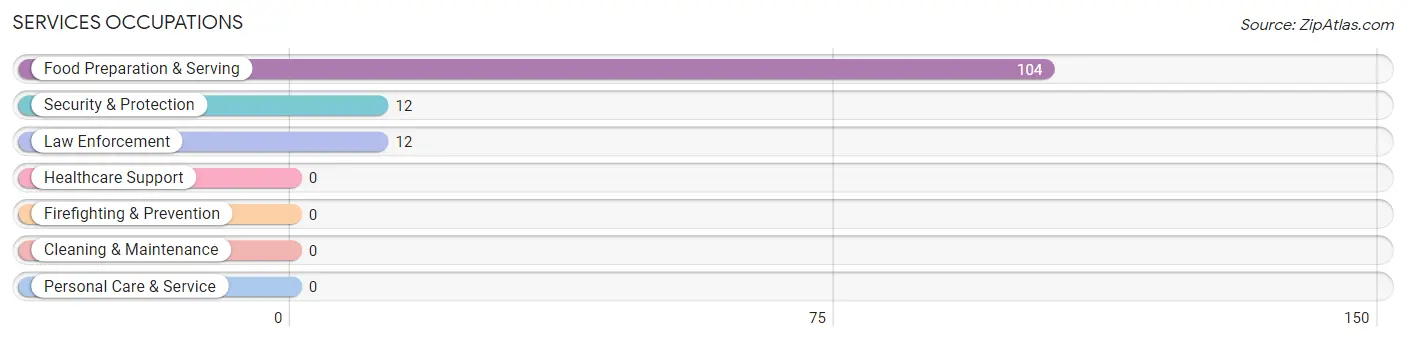
Services Occupations
The most common Services occupations in Louise are Food Preparation & Serving (104 | 22.7%), Security & Protection (12 | 2.6%), and Law Enforcement (12 | 2.6%).
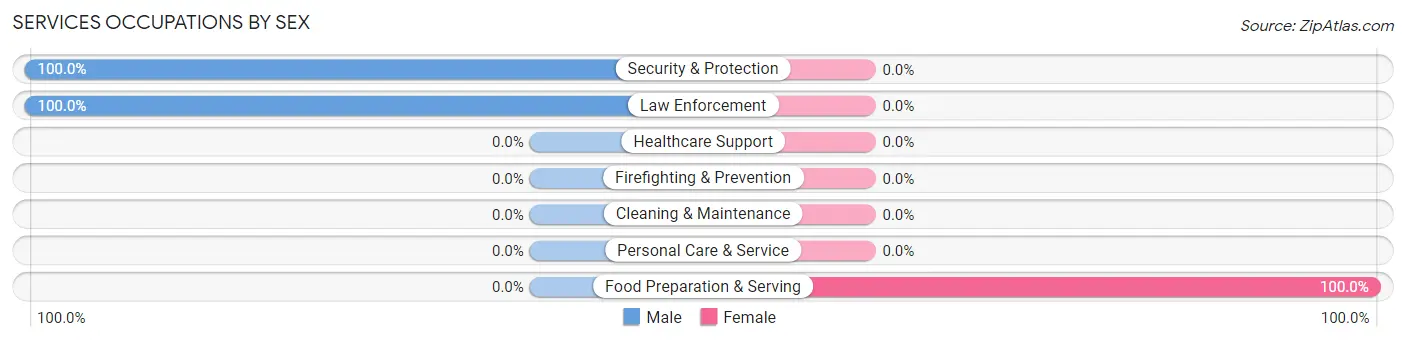
Services Occupations by Sex
| Occupation | Male | Female |
| Healthcare Support | 0 (0.0%) | 0 (0.0%) |
| Security & Protection | 12 (100.0%) | 0 (0.0%) |
| Firefighting & Prevention | 0 (0.0%) | 0 (0.0%) |
| Law Enforcement | 12 (100.0%) | 0 (0.0%) |
| Food Preparation & Serving | 0 (0.0%) | 104 (100.0%) |
| Cleaning & Maintenance | 0 (0.0%) | 0 (0.0%) |
| Personal Care & Service | 0 (0.0%) | 0 (0.0%) |
| Total (Category) | 12 (10.3%) | 104 (89.7%) |
| Total (Overall) | 214 (46.7%) | 244 (53.3%) |
Sales and Office Occupations
The most common Sales and Office occupations in Louise are Sales & Related (48 | 10.5%), and Office & Administration (15 | 3.3%).
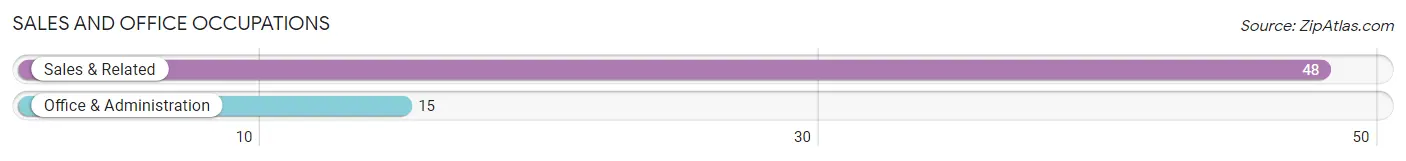
Sales and Office Occupations by Sex
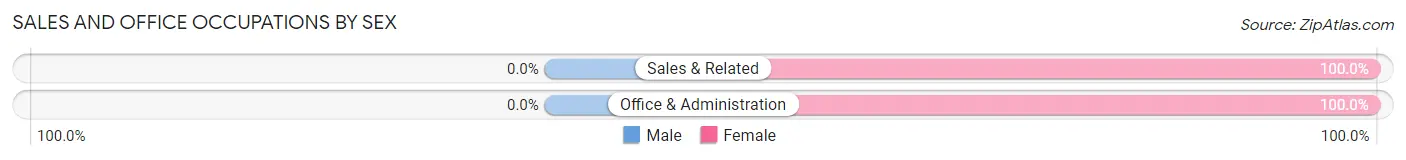
| Occupation | Male | Female |
| Sales & Related | 0 (0.0%) | 48 (100.0%) |
| Office & Administration | 0 (0.0%) | 15 (100.0%) |
| Total (Category) | 0 (0.0%) | 63 (100.0%) |
| Total (Overall) | 214 (46.7%) | 244 (53.3%) |
Natural Resources, Construction and Maintenance Occupations
The most common Natural Resources, Construction and Maintenance occupations in Louise are Farming, Fishing & Forestry (66 | 14.4%), and Installation, Maintenance & Repair (43 | 9.4%).
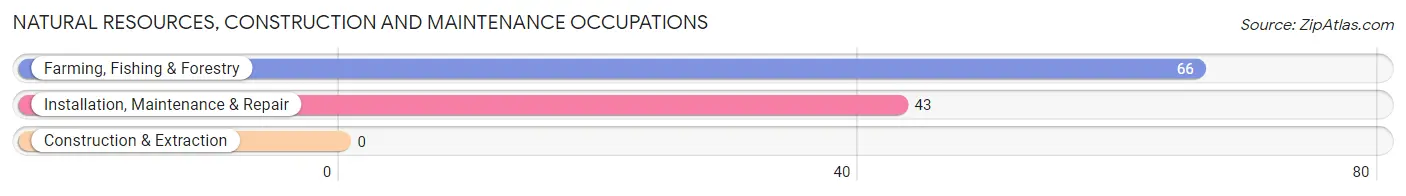
Natural Resources, Construction and Maintenance Occupations by Sex
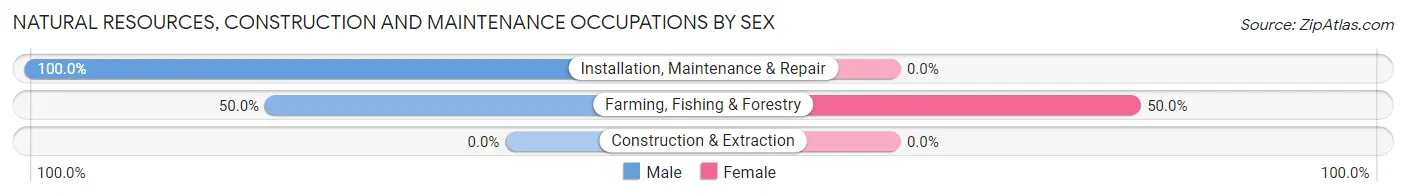
| Occupation | Male | Female |
| Farming, Fishing & Forestry | 33 (50.0%) | 33 (50.0%) |
| Construction & Extraction | 0 (0.0%) | 0 (0.0%) |
| Installation, Maintenance & Repair | 43 (100.0%) | 0 (0.0%) |
| Total (Category) | 76 (69.7%) | 33 (30.3%) |
| Total (Overall) | 214 (46.7%) | 244 (53.3%) |
Production, Transportation and Moving Occupations
The most common Production, Transportation and Moving occupations in Louise are Production (24 | 5.2%), and Material Moving (2 | 0.4%).
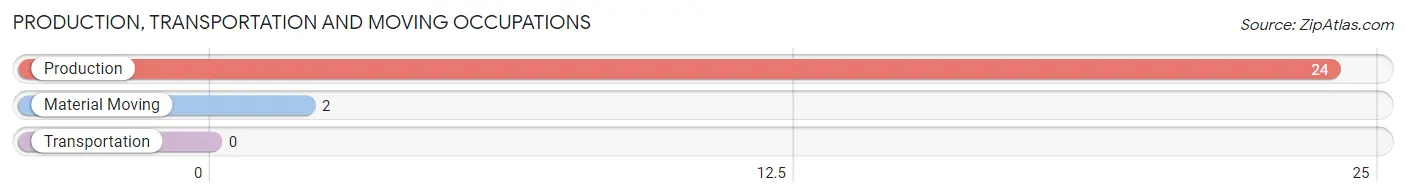
Production, Transportation and Moving Occupations by Sex
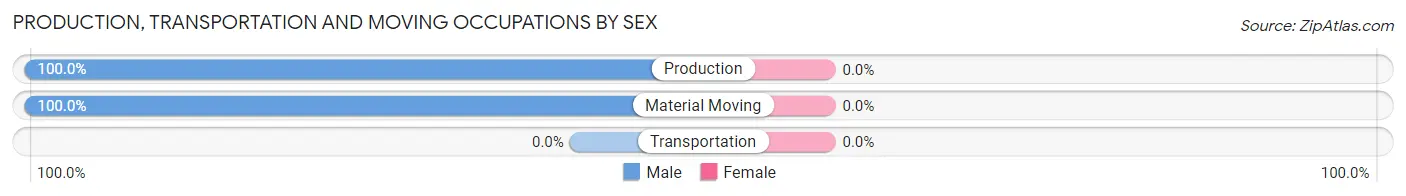
| Occupation | Male | Female |
| Production | 24 (100.0%) | 0 (0.0%) |
| Transportation | 0 (0.0%) | 0 (0.0%) |
| Material Moving | 2 (100.0%) | 0 (0.0%) |
| Total (Category) | 26 (100.0%) | 0 (0.0%) |
| Total (Overall) | 214 (46.7%) | 244 (53.3%) |
Employment Industries by Sex in Louise
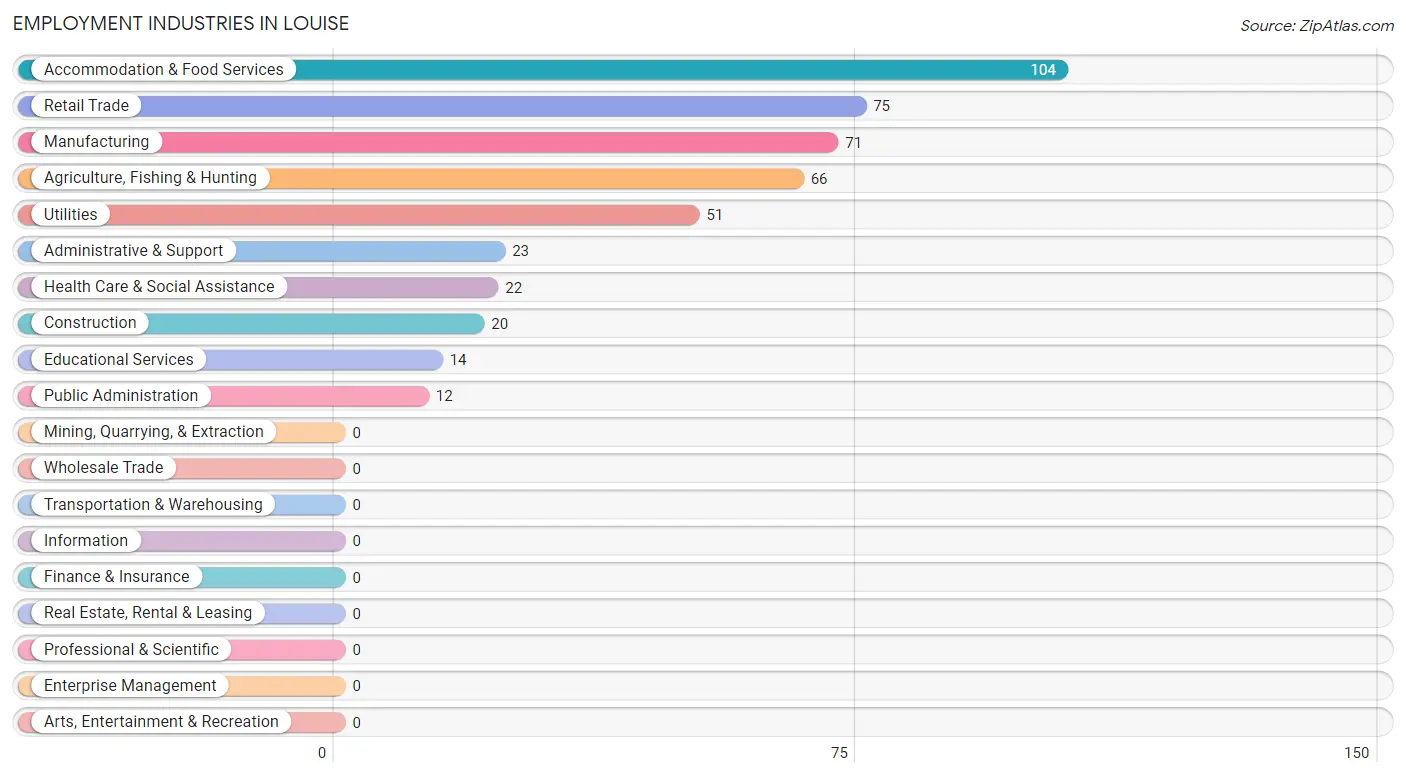
Employment Industries in Louise
The major employment industries in Louise include Accommodation & Food Services (104 | 22.7%), Retail Trade (75 | 16.4%), Manufacturing (71 | 15.5%), Agriculture, Fishing & Hunting (66 | 14.4%), and Utilities (51 | 11.1%).
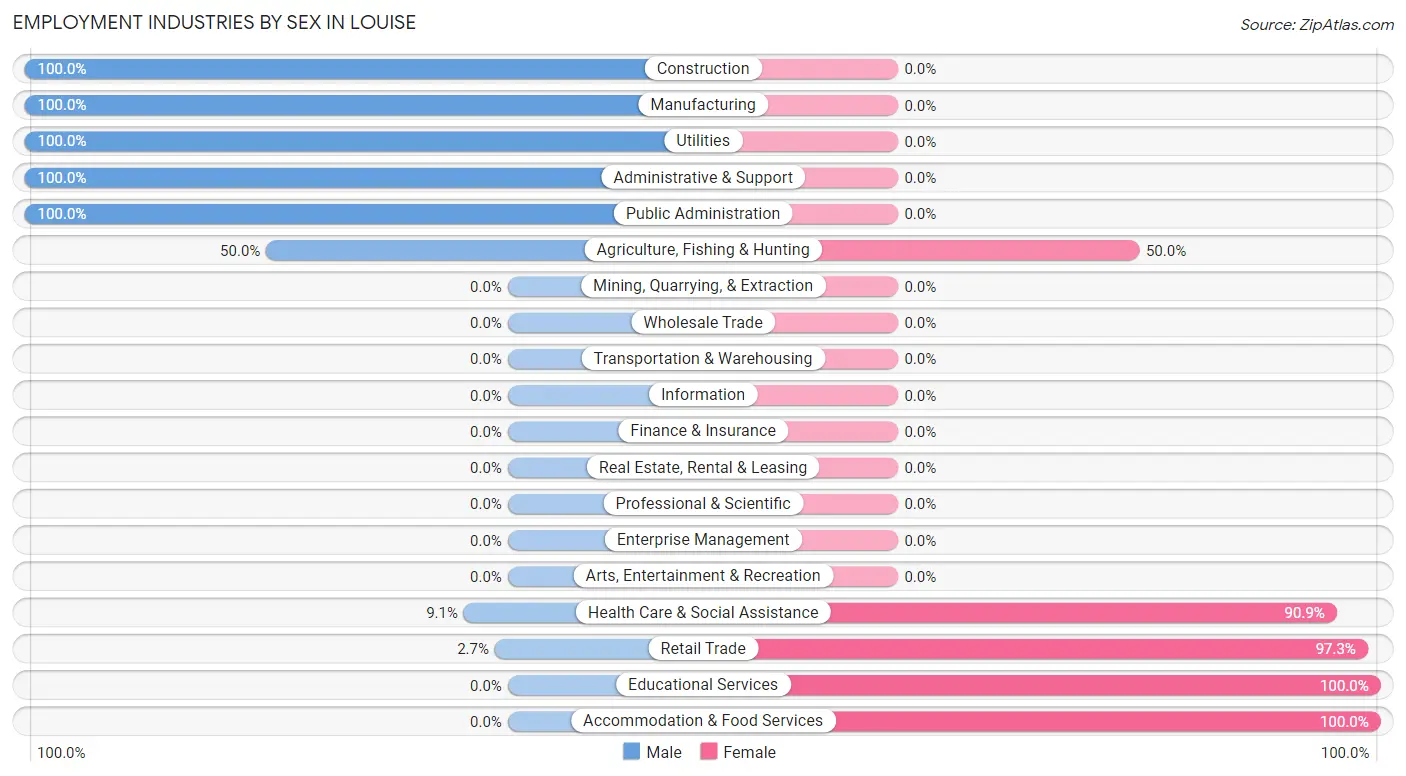
Employment Industries by Sex in Louise
The Louise industries that see more men than women are Construction (100.0%), Manufacturing (100.0%), and Utilities (100.0%), whereas the industries that tend to have a higher number of women are Educational Services (100.0%), Accommodation & Food Services (100.0%), and Retail Trade (97.3%).
| Industry | Male | Female |
| Agriculture, Fishing & Hunting | 33 (50.0%) | 33 (50.0%) |
| Mining, Quarrying, & Extraction | 0 (0.0%) | 0 (0.0%) |
| Construction | 20 (100.0%) | 0 (0.0%) |
| Manufacturing | 71 (100.0%) | 0 (0.0%) |
| Wholesale Trade | 0 (0.0%) | 0 (0.0%) |
| Retail Trade | 2 (2.7%) | 73 (97.3%) |
| Transportation & Warehousing | 0 (0.0%) | 0 (0.0%) |
| Utilities | 51 (100.0%) | 0 (0.0%) |
| Information | 0 (0.0%) | 0 (0.0%) |
| Finance & Insurance | 0 (0.0%) | 0 (0.0%) |
| Real Estate, Rental & Leasing | 0 (0.0%) | 0 (0.0%) |
| Professional & Scientific | 0 (0.0%) | 0 (0.0%) |
| Enterprise Management | 0 (0.0%) | 0 (0.0%) |
| Administrative & Support | 23 (100.0%) | 0 (0.0%) |
| Educational Services | 0 (0.0%) | 14 (100.0%) |
| Health Care & Social Assistance | 2 (9.1%) | 20 (90.9%) |
| Arts, Entertainment & Recreation | 0 (0.0%) | 0 (0.0%) |
| Accommodation & Food Services | 0 (0.0%) | 104 (100.0%) |
| Public Administration | 12 (100.0%) | 0 (0.0%) |
| Total | 214 (46.7%) | 244 (53.3%) |
Education in Louise
School Enrollment in Louise
The most common levels of schooling among the 149 students in Louise are elementary school (74 | 49.7%), high school (46 | 30.9%), and middle school (27 | 18.1%).
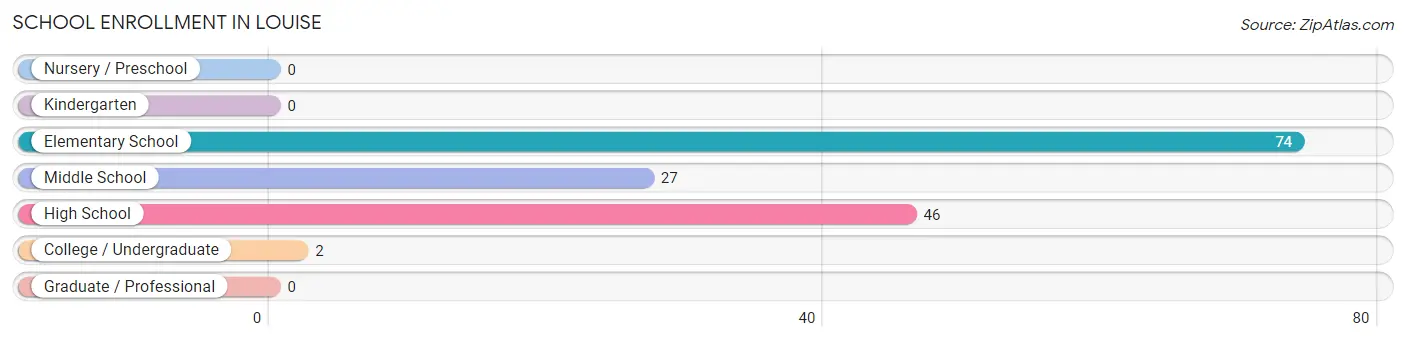
| School Level | # Students | % Students |
| Nursery / Preschool | 0 | 0.0% |
| Kindergarten | 0 | 0.0% |
| Elementary School | 74 | 49.7% |
| Middle School | 27 | 18.1% |
| High School | 46 | 30.9% |
| College / Undergraduate | 2 | 1.3% |
| Graduate / Professional | 0 | 0.0% |
| Total | 149 | 100.0% |
School Enrollment by Age by Funding Source in Louise
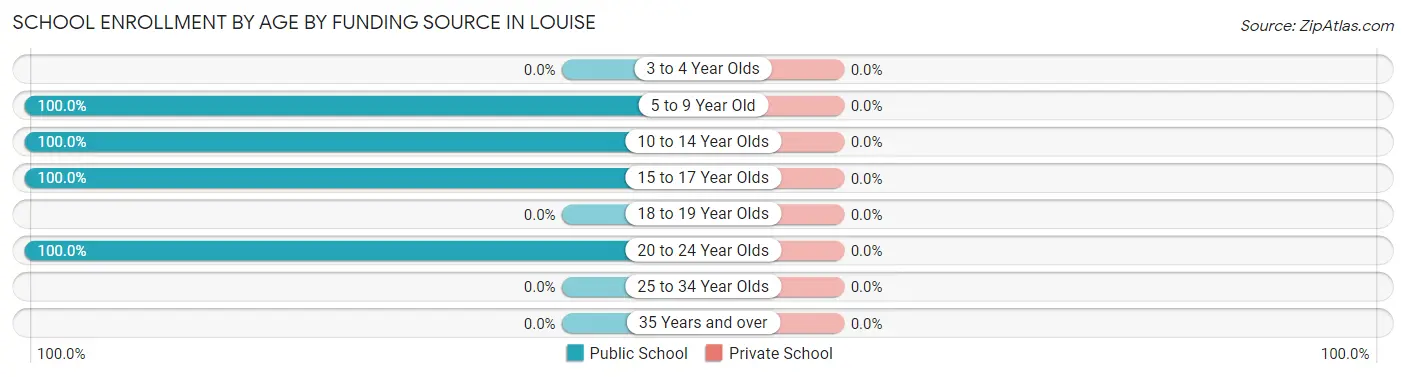
| Age Bracket | Public School | Private School |
| 3 to 4 Year Olds | 0 (0.0%) | 0 (0.0%) |
| 5 to 9 Year Old | 50 (100.0%) | 0 (0.0%) |
| 10 to 14 Year Olds | 51 (100.0%) | 0 (0.0%) |
| 15 to 17 Year Olds | 46 (100.0%) | 0 (0.0%) |
| 18 to 19 Year Olds | 0 (0.0%) | 0 (0.0%) |
| 20 to 24 Year Olds | 2 (100.0%) | 0 (0.0%) |
| 25 to 34 Year Olds | 0 (0.0%) | 0 (0.0%) |
| 35 Years and over | 0 (0.0%) | 0 (0.0%) |
| Total | 149 (100.0%) | 0 (0.0%) |
Educational Attainment by Field of Study in Louise
Business (47 | 39.8%), arts & humanities (47 | 39.8%), education (22 | 18.6%), and bio, nature & agricultural (2 | 1.7%) are the most common fields of study among 118 individuals in Louise who have obtained a bachelor's degree or higher.
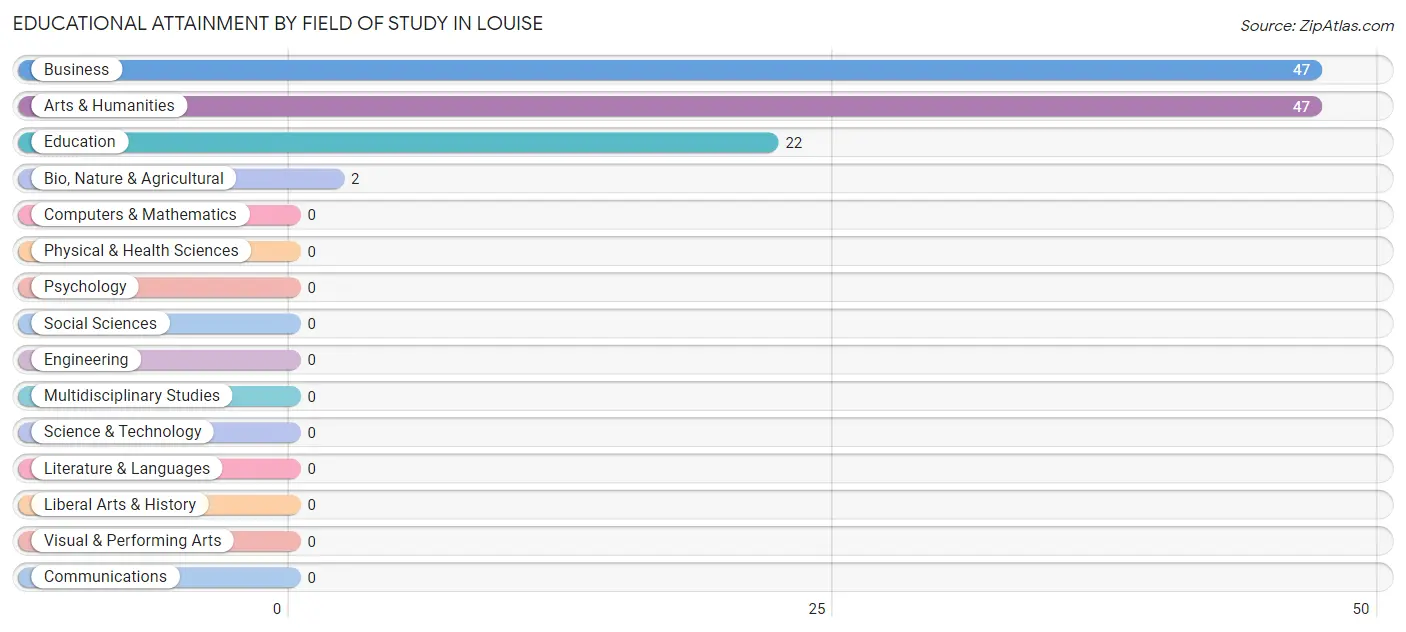
| Field of Study | # Graduates | % Graduates |
| Computers & Mathematics | 0 | 0.0% |
| Bio, Nature & Agricultural | 2 | 1.7% |
| Physical & Health Sciences | 0 | 0.0% |
| Psychology | 0 | 0.0% |
| Social Sciences | 0 | 0.0% |
| Engineering | 0 | 0.0% |
| Multidisciplinary Studies | 0 | 0.0% |
| Science & Technology | 0 | 0.0% |
| Business | 47 | 39.8% |
| Education | 22 | 18.6% |
| Literature & Languages | 0 | 0.0% |
| Liberal Arts & History | 0 | 0.0% |
| Visual & Performing Arts | 0 | 0.0% |
| Communications | 0 | 0.0% |
| Arts & Humanities | 47 | 39.8% |
| Total | 118 | 100.0% |
Transportation & Commute in Louise
Vehicle Availability by Sex in Louise
The most prevalent vehicle ownership categories in Louise are males with 2 vehicles (147, accounting for 68.7%) and females with 2 vehicles (164, making up 69.7%).
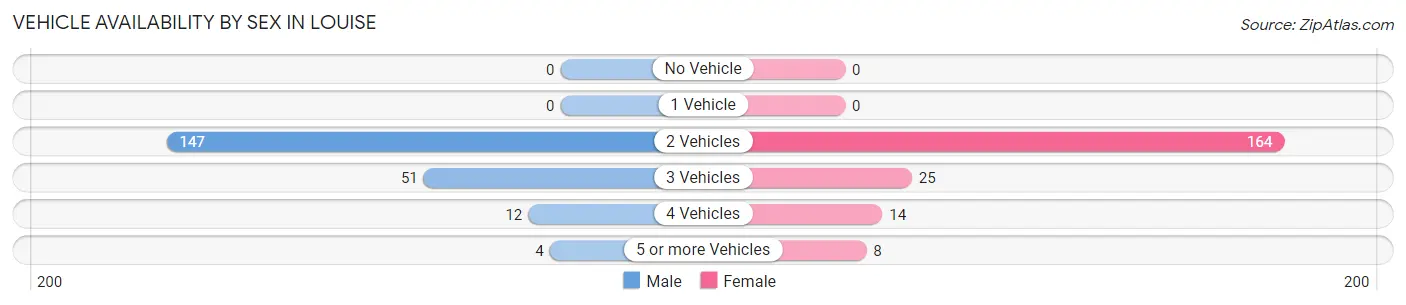
| Vehicles Available | Male | Female |
| No Vehicle | 0 (0.0%) | 0 (0.0%) |
| 1 Vehicle | 0 (0.0%) | 0 (0.0%) |
| 2 Vehicles | 147 (68.7%) | 164 (77.7%) |
| 3 Vehicles | 51 (23.8%) | 25 (11.8%) |
| 4 Vehicles | 12 (5.6%) | 14 (6.6%) |
| 5 or more Vehicles | 4 (1.9%) | 8 (3.8%) |
| Total | 214 (100.0%) | 211 (100.0%) |
Commute Time in Louise
The most frequently occuring commute durations in Louise are 10 to 14 minutes (102 commuters, 25.3%), 15 to 19 minutes (72 commuters, 17.9%), and 20 to 24 minutes (69 commuters, 17.1%).
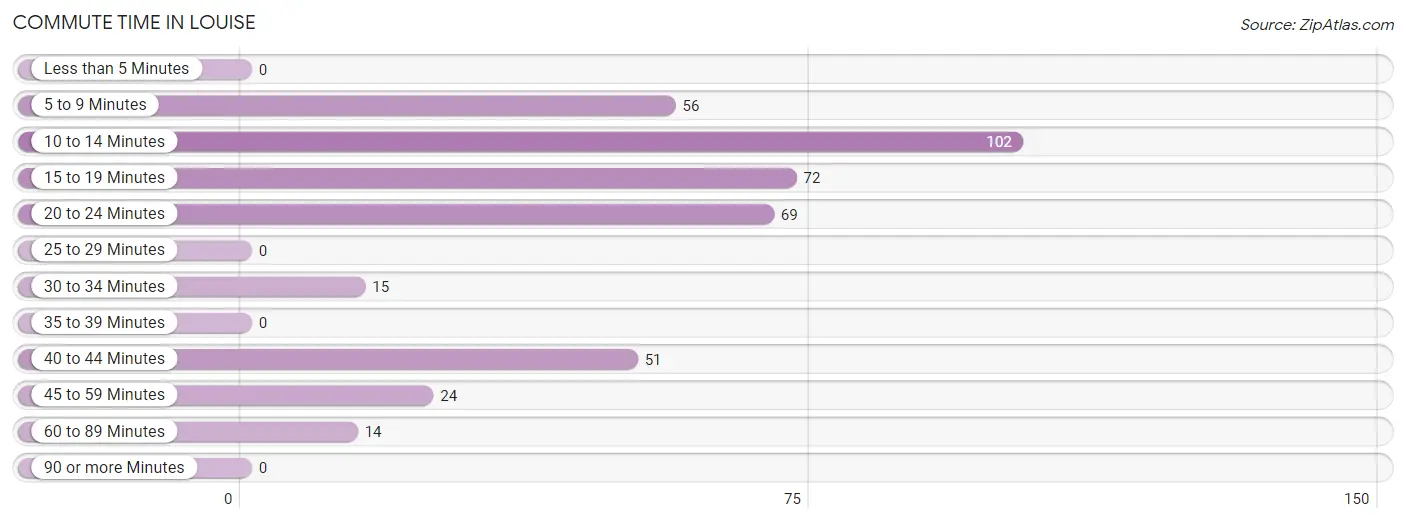
| Commute Time | # Commuters | % Commuters |
| Less than 5 Minutes | 0 | 0.0% |
| 5 to 9 Minutes | 56 | 13.9% |
| 10 to 14 Minutes | 102 | 25.3% |
| 15 to 19 Minutes | 72 | 17.9% |
| 20 to 24 Minutes | 69 | 17.1% |
| 25 to 29 Minutes | 0 | 0.0% |
| 30 to 34 Minutes | 15 | 3.7% |
| 35 to 39 Minutes | 0 | 0.0% |
| 40 to 44 Minutes | 51 | 12.7% |
| 45 to 59 Minutes | 24 | 6.0% |
| 60 to 89 Minutes | 14 | 3.5% |
| 90 or more Minutes | 0 | 0.0% |
Commute Time by Sex in Louise
The most common commute times in Louise are 5 to 9 minutes (56 commuters, 26.2%) for males and 10 to 14 minutes (90 commuters, 47.6%) for females.
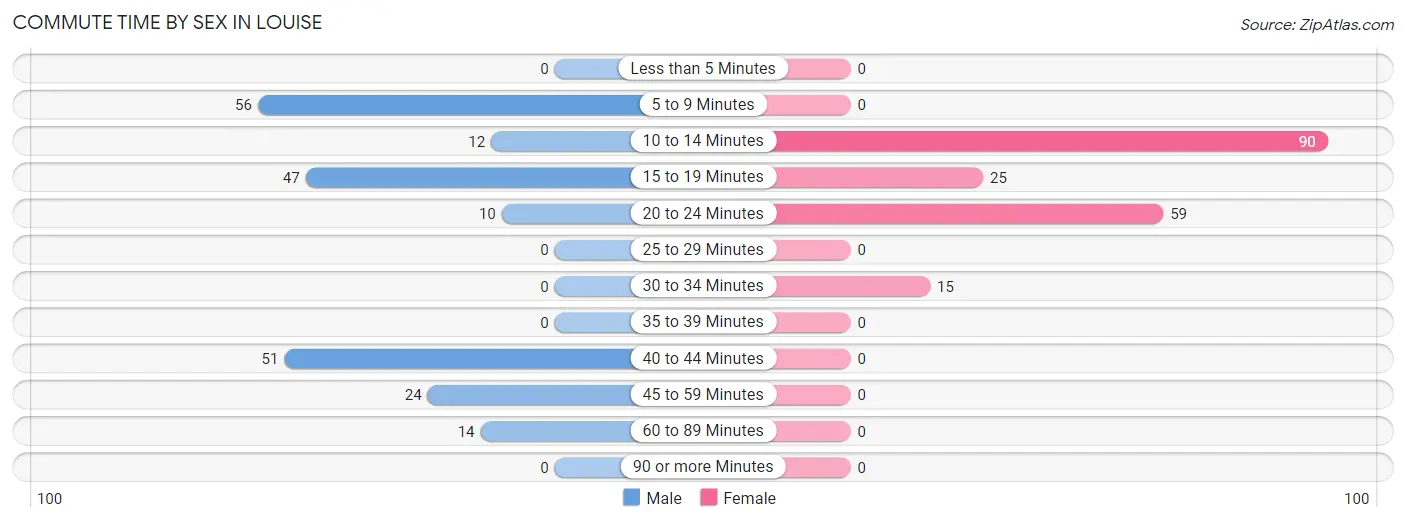
| Commute Time | Male | Female |
| Less than 5 Minutes | 0 (0.0%) | 0 (0.0%) |
| 5 to 9 Minutes | 56 (26.2%) | 0 (0.0%) |
| 10 to 14 Minutes | 12 (5.6%) | 90 (47.6%) |
| 15 to 19 Minutes | 47 (22.0%) | 25 (13.2%) |
| 20 to 24 Minutes | 10 (4.7%) | 59 (31.2%) |
| 25 to 29 Minutes | 0 (0.0%) | 0 (0.0%) |
| 30 to 34 Minutes | 0 (0.0%) | 15 (7.9%) |
| 35 to 39 Minutes | 0 (0.0%) | 0 (0.0%) |
| 40 to 44 Minutes | 51 (23.8%) | 0 (0.0%) |
| 45 to 59 Minutes | 24 (11.2%) | 0 (0.0%) |
| 60 to 89 Minutes | 14 (6.5%) | 0 (0.0%) |
| 90 or more Minutes | 0 (0.0%) | 0 (0.0%) |
Time of Departure to Work by Sex in Louise
The most frequent times of departure to work in Louise are 7:30 AM to 7:59 AM (59, 27.6%) for males and 12:00 PM to 3:59 PM (76, 40.2%) for females.
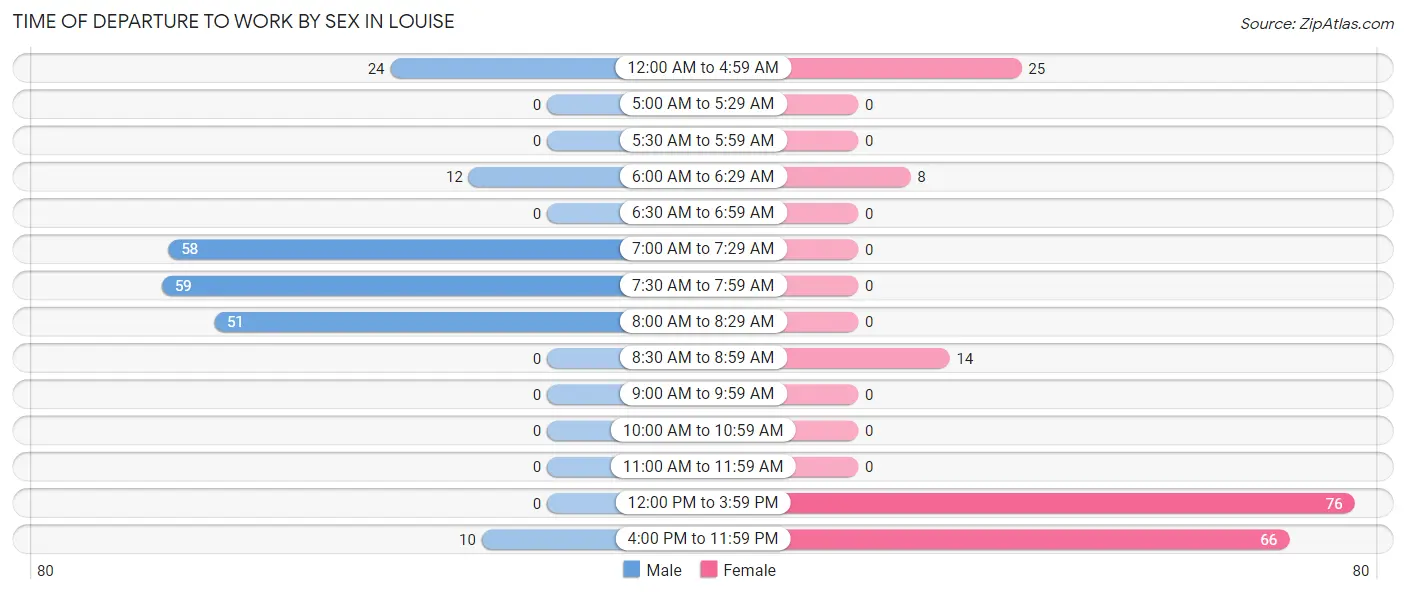
| Time of Departure | Male | Female |
| 12:00 AM to 4:59 AM | 24 (11.2%) | 25 (13.2%) |
| 5:00 AM to 5:29 AM | 0 (0.0%) | 0 (0.0%) |
| 5:30 AM to 5:59 AM | 0 (0.0%) | 0 (0.0%) |
| 6:00 AM to 6:29 AM | 12 (5.6%) | 8 (4.2%) |
| 6:30 AM to 6:59 AM | 0 (0.0%) | 0 (0.0%) |
| 7:00 AM to 7:29 AM | 58 (27.1%) | 0 (0.0%) |
| 7:30 AM to 7:59 AM | 59 (27.6%) | 0 (0.0%) |
| 8:00 AM to 8:29 AM | 51 (23.8%) | 0 (0.0%) |
| 8:30 AM to 8:59 AM | 0 (0.0%) | 14 (7.4%) |
| 9:00 AM to 9:59 AM | 0 (0.0%) | 0 (0.0%) |
| 10:00 AM to 10:59 AM | 0 (0.0%) | 0 (0.0%) |
| 11:00 AM to 11:59 AM | 0 (0.0%) | 0 (0.0%) |
| 12:00 PM to 3:59 PM | 0 (0.0%) | 76 (40.2%) |
| 4:00 PM to 11:59 PM | 10 (4.7%) | 66 (34.9%) |
| Total | 214 (100.0%) | 189 (100.0%) |
Housing Occupancy in Louise
Occupancy by Ownership in Louise
Of the total 328 dwellings in Louise, owner-occupied units account for 234 (71.3%), while renter-occupied units make up 94 (28.7%).
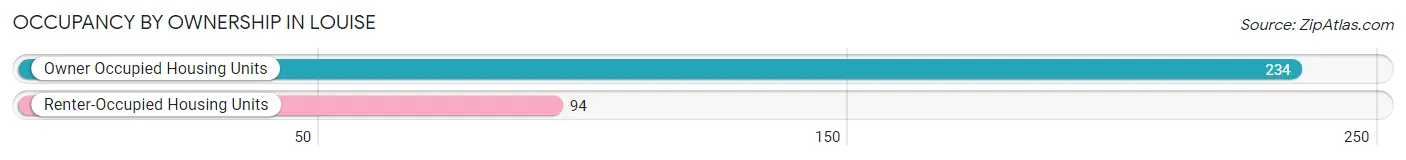
| Occupancy | # Housing Units | % Housing Units |
| Owner Occupied Housing Units | 234 | 71.3% |
| Renter-Occupied Housing Units | 94 | 28.7% |
| Total Occupied Housing Units | 328 | 100.0% |
Occupancy by Household Size in Louise
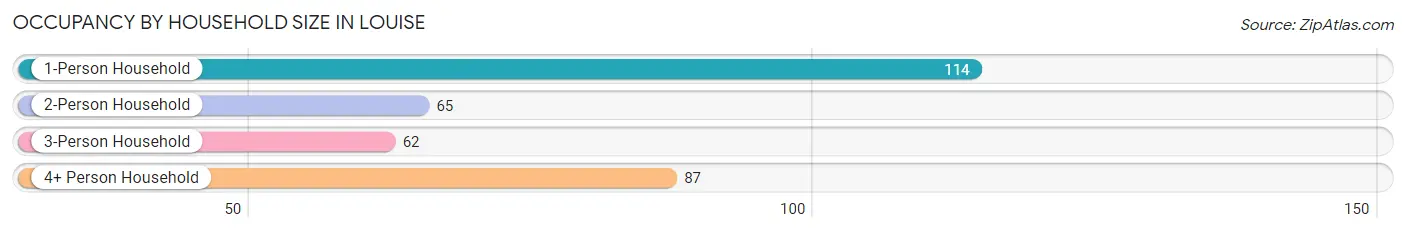
| Household Size | # Housing Units | % Housing Units |
| 1-Person Household | 114 | 34.8% |
| 2-Person Household | 65 | 19.8% |
| 3-Person Household | 62 | 18.9% |
| 4+ Person Household | 87 | 26.5% |
| Total Housing Units | 328 | 100.0% |
Occupancy by Ownership by Household Size in Louise
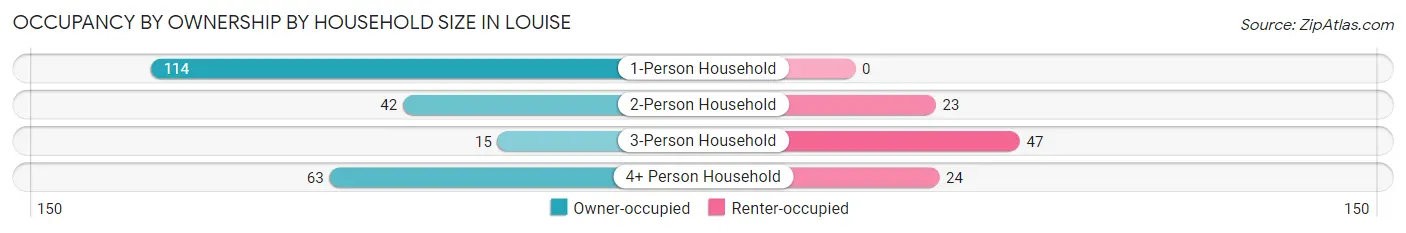
| Household Size | Owner-occupied | Renter-occupied |
| 1-Person Household | 114 (100.0%) | 0 (0.0%) |
| 2-Person Household | 42 (64.6%) | 23 (35.4%) |
| 3-Person Household | 15 (24.2%) | 47 (75.8%) |
| 4+ Person Household | 63 (72.4%) | 24 (27.6%) |
| Total Housing Units | 234 (71.3%) | 94 (28.7%) |
Occupancy by Educational Attainment in Louise
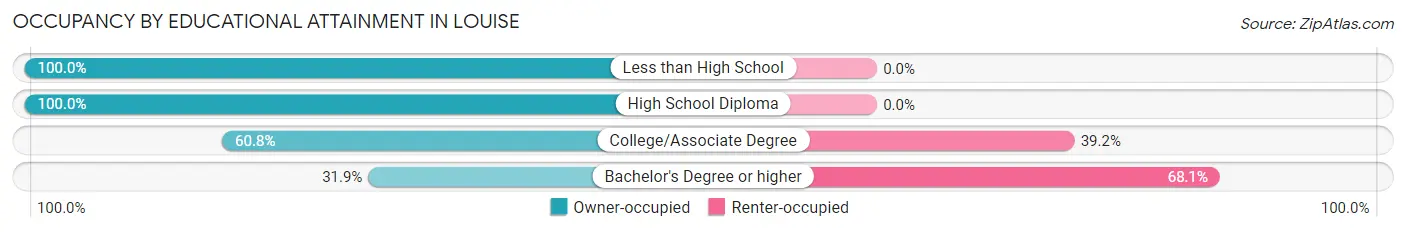
| Household Size | Owner-occupied | Renter-occupied |
| Less than High School | 102 (100.0%) | 0 (0.0%) |
| High School Diploma | 37 (100.0%) | 0 (0.0%) |
| College/Associate Degree | 73 (60.8%) | 47 (39.2%) |
| Bachelor's Degree or higher | 22 (31.9%) | 47 (68.1%) |
Occupancy by Age of Householder in Louise
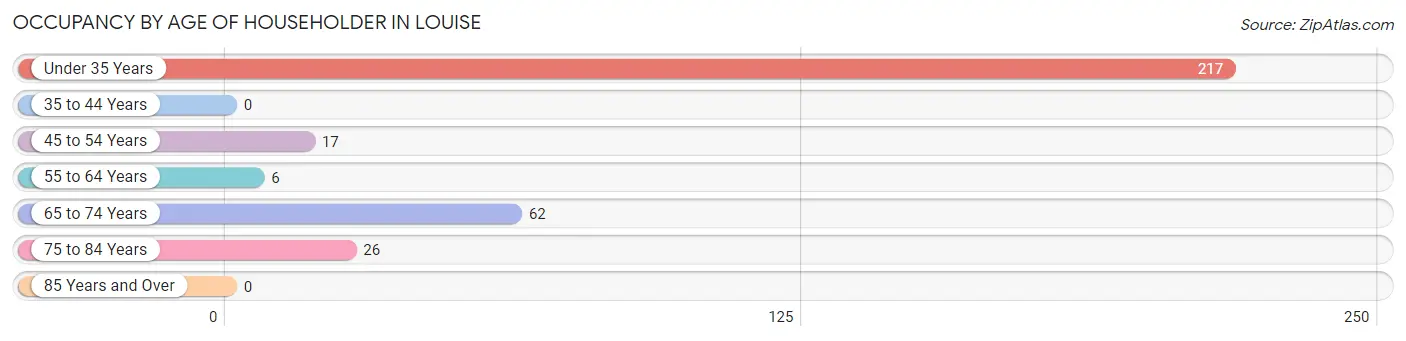
| Age Bracket | # Households | % Households |
| Under 35 Years | 217 | 66.2% |
| 35 to 44 Years | 0 | 0.0% |
| 45 to 54 Years | 17 | 5.2% |
| 55 to 64 Years | 6 | 1.8% |
| 65 to 74 Years | 62 | 18.9% |
| 75 to 84 Years | 26 | 7.9% |
| 85 Years and Over | 0 | 0.0% |
| Total | 328 | 100.0% |
Housing Finances in Louise
Median Income by Occupancy in Louise
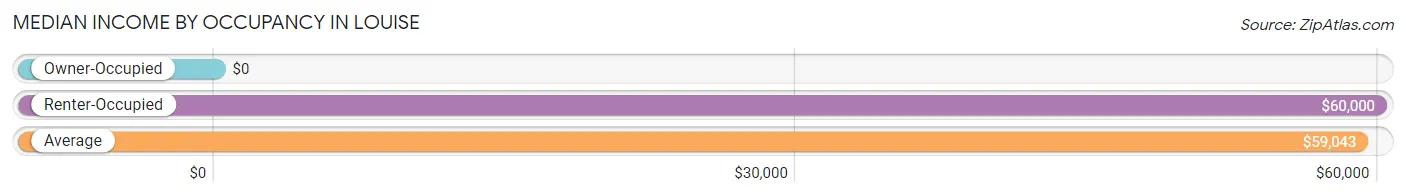
| Occupancy Type | # Households | Median Income |
| Owner-Occupied | 234 (71.3%) | $0 |
| Renter-Occupied | 94 (28.7%) | $60,000 |
| Average | 328 (100.0%) | $59,043 |
Occupancy by Householder Income Bracket in Louise
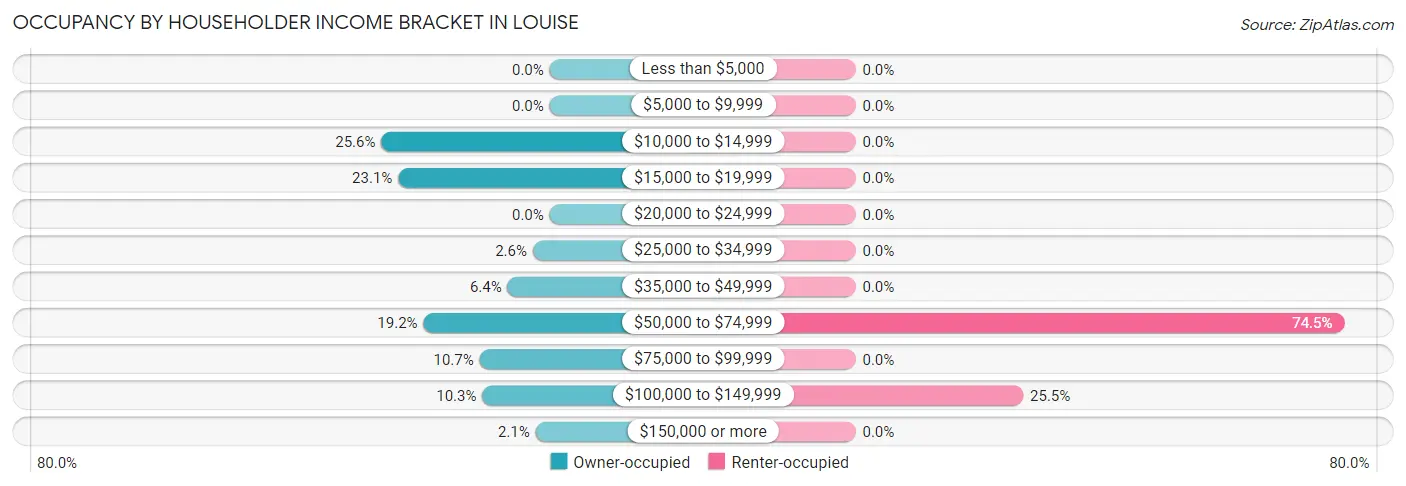
| Income Bracket | Owner-occupied | Renter-occupied |
| Less than $5,000 | 0 (0.0%) | 0 (0.0%) |
| $5,000 to $9,999 | 0 (0.0%) | 0 (0.0%) |
| $10,000 to $14,999 | 60 (25.6%) | 0 (0.0%) |
| $15,000 to $19,999 | 54 (23.1%) | 0 (0.0%) |
| $20,000 to $24,999 | 0 (0.0%) | 0 (0.0%) |
| $25,000 to $34,999 | 6 (2.6%) | 0 (0.0%) |
| $35,000 to $49,999 | 15 (6.4%) | 0 (0.0%) |
| $50,000 to $74,999 | 45 (19.2%) | 70 (74.5%) |
| $75,000 to $99,999 | 25 (10.7%) | 0 (0.0%) |
| $100,000 to $149,999 | 24 (10.3%) | 24 (25.5%) |
| $150,000 or more | 5 (2.1%) | 0 (0.0%) |
| Total | 234 (100.0%) | 94 (100.0%) |
Monthly Housing Cost Tiers in Louise
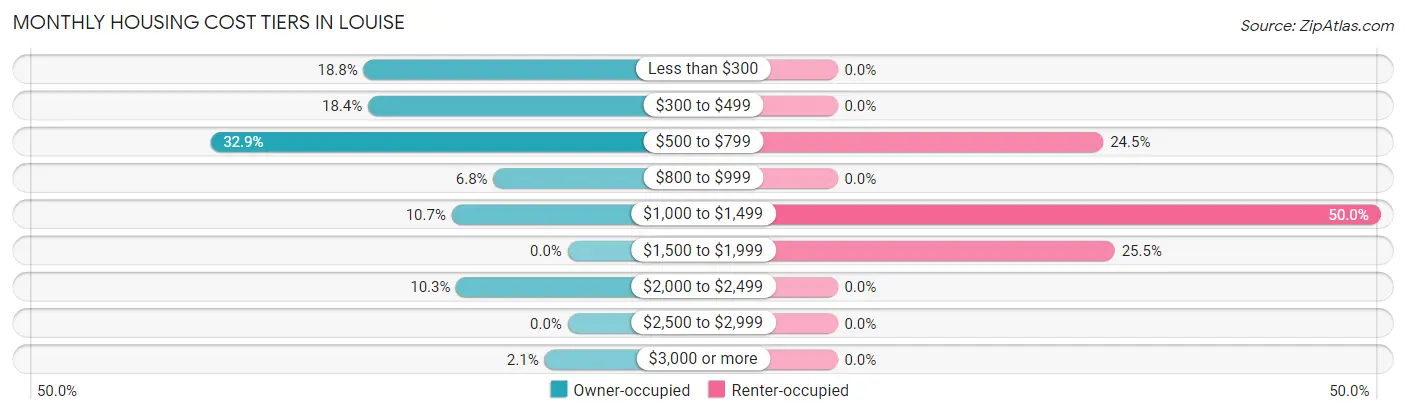
| Monthly Cost | Owner-occupied | Renter-occupied |
| Less than $300 | 44 (18.8%) | 0 (0.0%) |
| $300 to $499 | 43 (18.4%) | 0 (0.0%) |
| $500 to $799 | 77 (32.9%) | 23 (24.5%) |
| $800 to $999 | 16 (6.8%) | 0 (0.0%) |
| $1,000 to $1,499 | 25 (10.7%) | 47 (50.0%) |
| $1,500 to $1,999 | 0 (0.0%) | 24 (25.5%) |
| $2,000 to $2,499 | 24 (10.3%) | 0 (0.0%) |
| $2,500 to $2,999 | 0 (0.0%) | 0 (0.0%) |
| $3,000 or more | 5 (2.1%) | 0 (0.0%) |
| Total | 234 (100.0%) | 94 (100.0%) |
Physical Housing Characteristics in Louise
Housing Structures in Louise
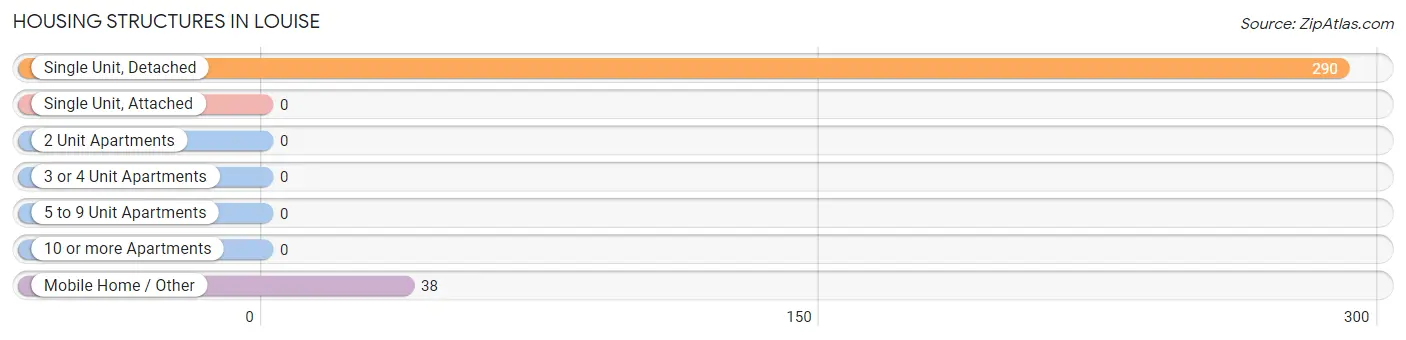
| Structure Type | # Housing Units | % Housing Units |
| Single Unit, Detached | 290 | 88.4% |
| Single Unit, Attached | 0 | 0.0% |
| 2 Unit Apartments | 0 | 0.0% |
| 3 or 4 Unit Apartments | 0 | 0.0% |
| 5 to 9 Unit Apartments | 0 | 0.0% |
| 10 or more Apartments | 0 | 0.0% |
| Mobile Home / Other | 38 | 11.6% |
| Total | 328 | 100.0% |
Housing Structures by Occupancy in Louise
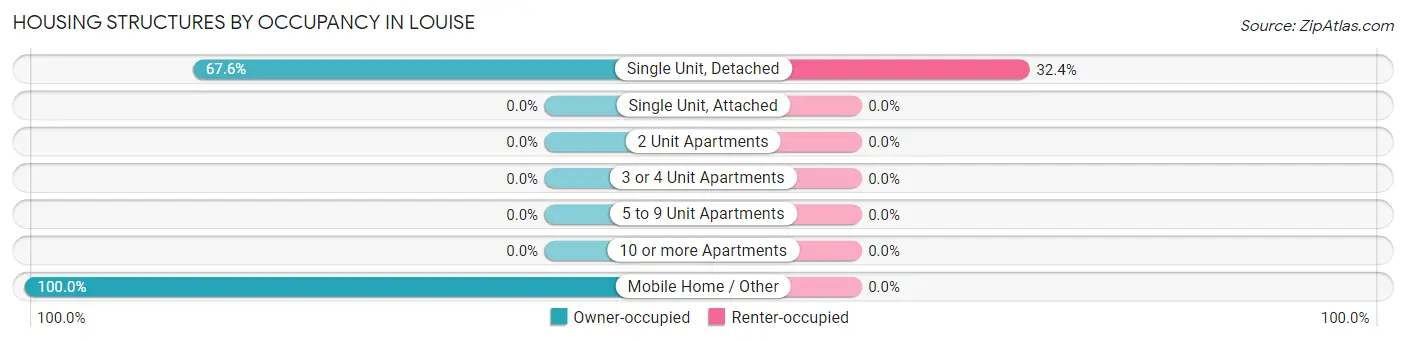
| Structure Type | Owner-occupied | Renter-occupied |
| Single Unit, Detached | 196 (67.6%) | 94 (32.4%) |
| Single Unit, Attached | 0 (0.0%) | 0 (0.0%) |
| 2 Unit Apartments | 0 (0.0%) | 0 (0.0%) |
| 3 or 4 Unit Apartments | 0 (0.0%) | 0 (0.0%) |
| 5 to 9 Unit Apartments | 0 (0.0%) | 0 (0.0%) |
| 10 or more Apartments | 0 (0.0%) | 0 (0.0%) |
| Mobile Home / Other | 38 (100.0%) | 0 (0.0%) |
| Total | 234 (71.3%) | 94 (28.7%) |
Housing Structures by Number of Rooms in Louise
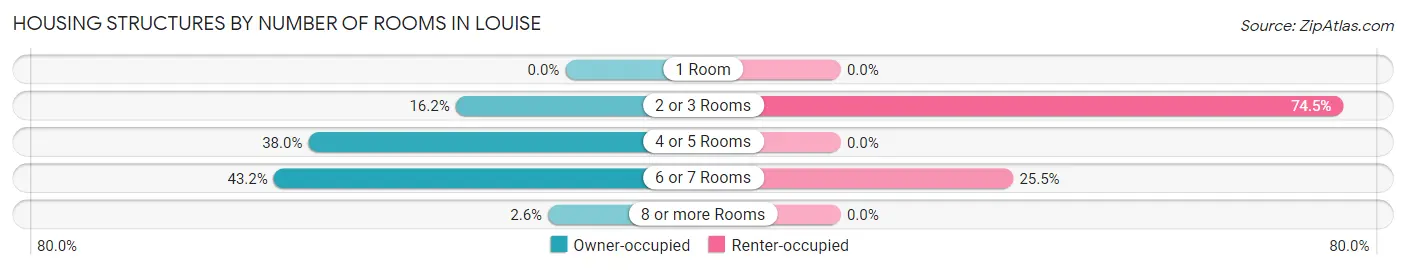
| Number of Rooms | Owner-occupied | Renter-occupied |
| 1 Room | 0 (0.0%) | 0 (0.0%) |
| 2 or 3 Rooms | 38 (16.2%) | 70 (74.5%) |
| 4 or 5 Rooms | 89 (38.0%) | 0 (0.0%) |
| 6 or 7 Rooms | 101 (43.2%) | 24 (25.5%) |
| 8 or more Rooms | 6 (2.6%) | 0 (0.0%) |
| Total | 234 (100.0%) | 94 (100.0%) |
Housing Structure by Heating Type in Louise
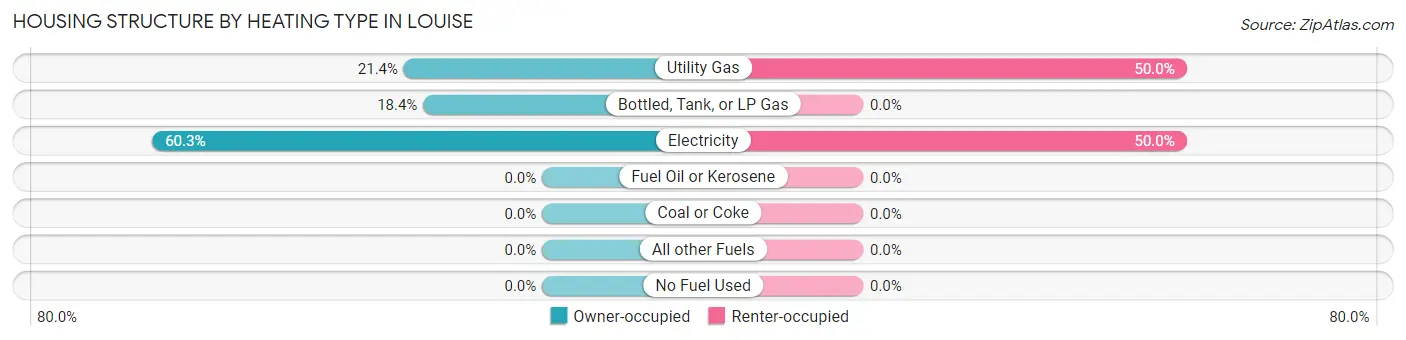
| Heating Type | Owner-occupied | Renter-occupied |
| Utility Gas | 50 (21.4%) | 47 (50.0%) |
| Bottled, Tank, or LP Gas | 43 (18.4%) | 0 (0.0%) |
| Electricity | 141 (60.3%) | 47 (50.0%) |
| Fuel Oil or Kerosene | 0 (0.0%) | 0 (0.0%) |
| Coal or Coke | 0 (0.0%) | 0 (0.0%) |
| All other Fuels | 0 (0.0%) | 0 (0.0%) |
| No Fuel Used | 0 (0.0%) | 0 (0.0%) |
| Total | 234 (100.0%) | 94 (100.0%) |
Household Vehicle Usage in Louise
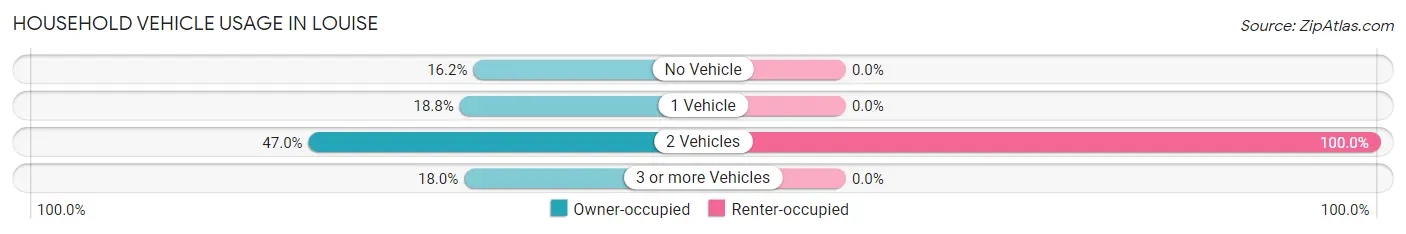
| Vehicles per Household | Owner-occupied | Renter-occupied |
| No Vehicle | 38 (16.2%) | 0 (0.0%) |
| 1 Vehicle | 44 (18.8%) | 0 (0.0%) |
| 2 Vehicles | 110 (47.0%) | 94 (100.0%) |
| 3 or more Vehicles | 42 (17.9%) | 0 (0.0%) |
| Total | 234 (100.0%) | 94 (100.0%) |
Real Estate & Mortgages in Louise
Real Estate and Mortgage Overview in Louise
| Characteristic | Without Mortgage | With Mortgage |
| Housing Units | 142 | 92 |
| Median Property Value | $85,200 | $0 |
| Median Household Income | - | - |
| Monthly Housing Costs | $381 | $5 |
| Real Estate Taxes | - | - |
Property Value by Mortgage Status in Louise
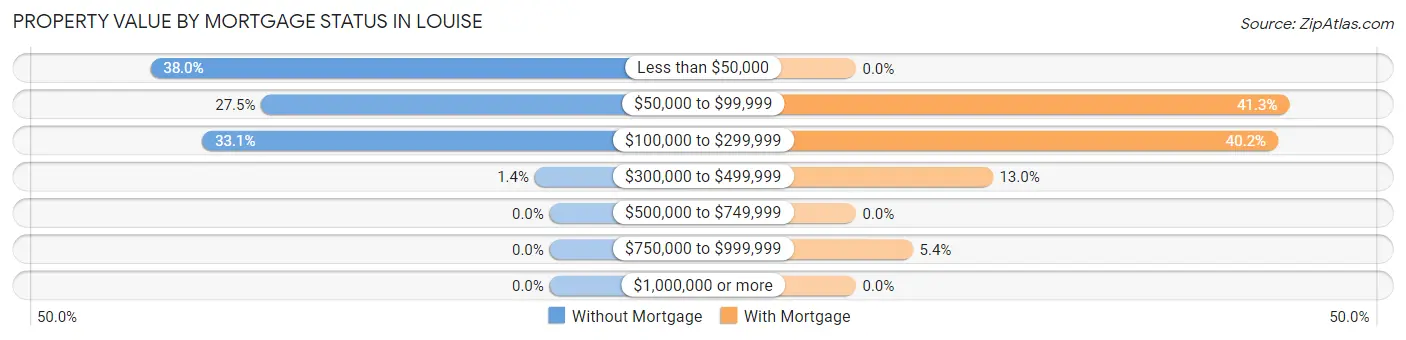
| Property Value | Without Mortgage | With Mortgage |
| Less than $50,000 | 54 (38.0%) | 0 (0.0%) |
| $50,000 to $99,999 | 39 (27.5%) | 38 (41.3%) |
| $100,000 to $299,999 | 47 (33.1%) | 37 (40.2%) |
| $300,000 to $499,999 | 2 (1.4%) | 12 (13.0%) |
| $500,000 to $749,999 | 0 (0.0%) | 0 (0.0%) |
| $750,000 to $999,999 | 0 (0.0%) | 5 (5.4%) |
| $1,000,000 or more | 0 (0.0%) | 0 (0.0%) |
| Total | 142 (100.0%) | 92 (100.0%) |
Household Income by Mortgage Status in Louise
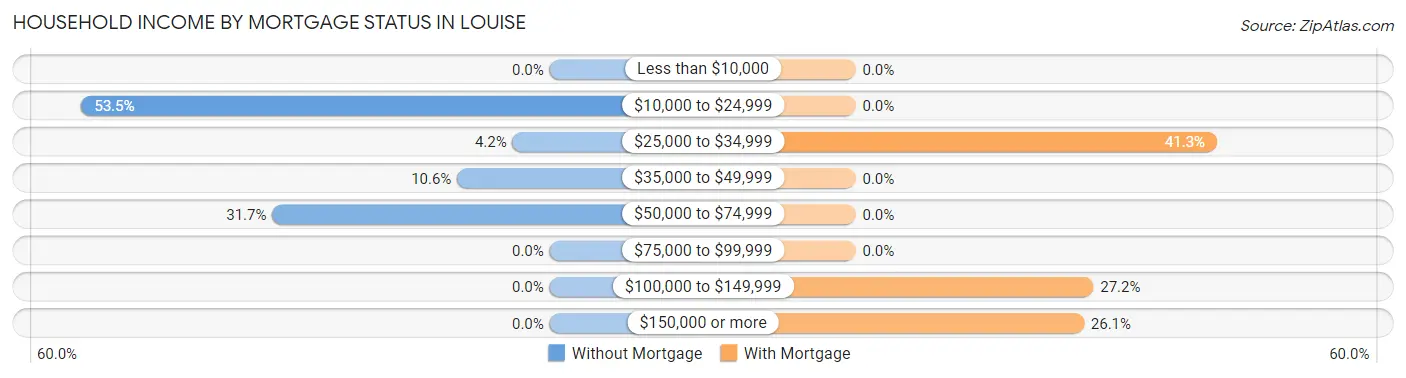
| Household Income | Without Mortgage | With Mortgage |
| Less than $10,000 | 0 (0.0%) | 0 (0.0%) |
| $10,000 to $24,999 | 76 (53.5%) | 0 (0.0%) |
| $25,000 to $34,999 | 6 (4.2%) | 38 (41.3%) |
| $35,000 to $49,999 | 15 (10.6%) | 0 (0.0%) |
| $50,000 to $74,999 | 45 (31.7%) | 0 (0.0%) |
| $75,000 to $99,999 | 0 (0.0%) | 0 (0.0%) |
| $100,000 to $149,999 | 0 (0.0%) | 25 (27.2%) |
| $150,000 or more | 0 (0.0%) | 24 (26.1%) |
| Total | 142 (100.0%) | 92 (100.0%) |
Property Value to Household Income Ratio in Louise
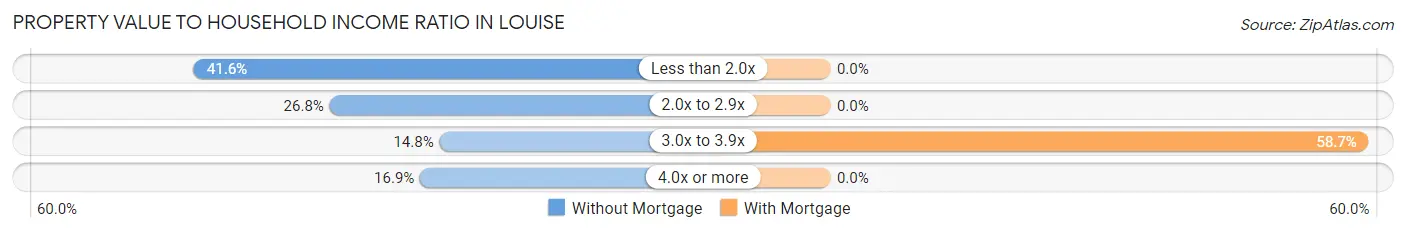
| Value-to-Income Ratio | Without Mortgage | With Mortgage |
| Less than 2.0x | 59 (41.5%) | 0 (0.0%) |
| 2.0x to 2.9x | 38 (26.8%) | 0 (0.0%) |
| 3.0x to 3.9x | 21 (14.8%) | 54 (58.7%) |
| 4.0x or more | 24 (16.9%) | 0 (0.0%) |
| Total | 142 (100.0%) | 92 (100.0%) |
Real Estate Taxes by Mortgage Status in Louise
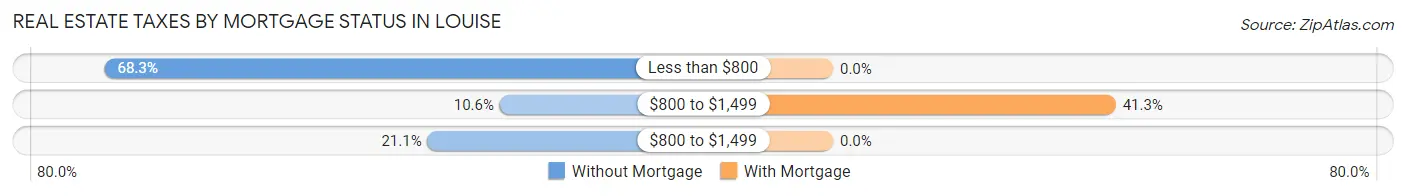
| Property Taxes | Without Mortgage | With Mortgage |
| Less than $800 | 97 (68.3%) | 0 (0.0%) |
| $800 to $1,499 | 15 (10.6%) | 38 (41.3%) |
| $800 to $1,499 | 30 (21.1%) | 0 (0.0%) |
| Total | 142 (100.0%) | 92 (100.0%) |
Health & Disability in Louise
Health Insurance Coverage by Age in Louise
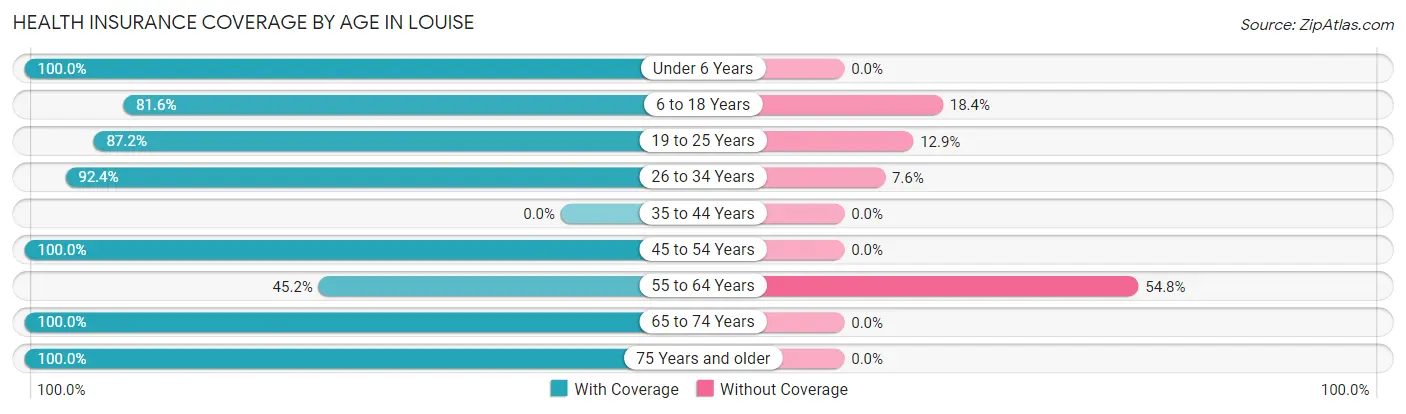
| Age Bracket | With Coverage | Without Coverage |
| Under 6 Years | 174 (100.0%) | 0 (0.0%) |
| 6 to 18 Years | 120 (81.6%) | 27 (18.4%) |
| 19 to 25 Years | 156 (87.2%) | 23 (12.9%) |
| 26 to 34 Years | 268 (92.4%) | 22 (7.6%) |
| 35 to 44 Years | 0 (0.0%) | 0 (0.0%) |
| 45 to 54 Years | 40 (100.0%) | 0 (0.0%) |
| 55 to 64 Years | 14 (45.2%) | 17 (54.8%) |
| 65 to 74 Years | 66 (100.0%) | 0 (0.0%) |
| 75 Years and older | 34 (100.0%) | 0 (0.0%) |
| Total | 872 (90.7%) | 89 (9.3%) |
Health Insurance Coverage by Citizenship Status in Louise
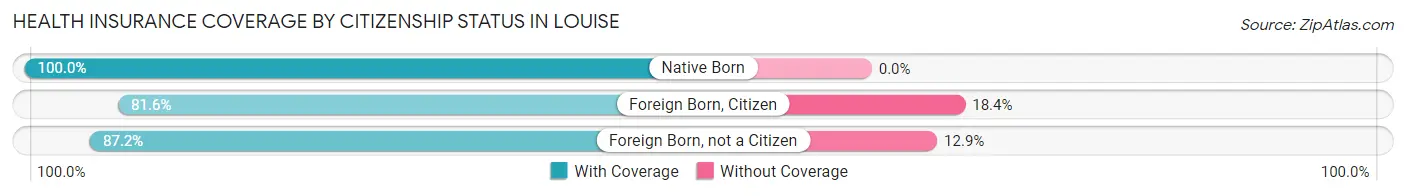
| Citizenship Status | With Coverage | Without Coverage |
| Native Born | 174 (100.0%) | 0 (0.0%) |
| Foreign Born, Citizen | 120 (81.6%) | 27 (18.4%) |
| Foreign Born, not a Citizen | 156 (87.2%) | 23 (12.9%) |
Health Insurance Coverage by Household Income in Louise
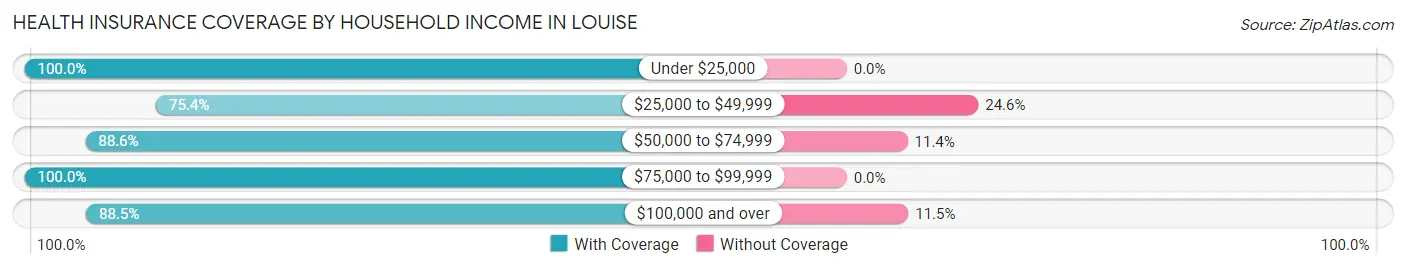
| Household Income | With Coverage | Without Coverage |
| Under $25,000 | 114 (100.0%) | 0 (0.0%) |
| $25,000 to $49,999 | 52 (75.4%) | 17 (24.6%) |
| $50,000 to $74,999 | 389 (88.6%) | 50 (11.4%) |
| $75,000 to $99,999 | 148 (100.0%) | 0 (0.0%) |
| $100,000 and over | 169 (88.5%) | 22 (11.5%) |
Public vs Private Health Insurance Coverage by Age in Louise
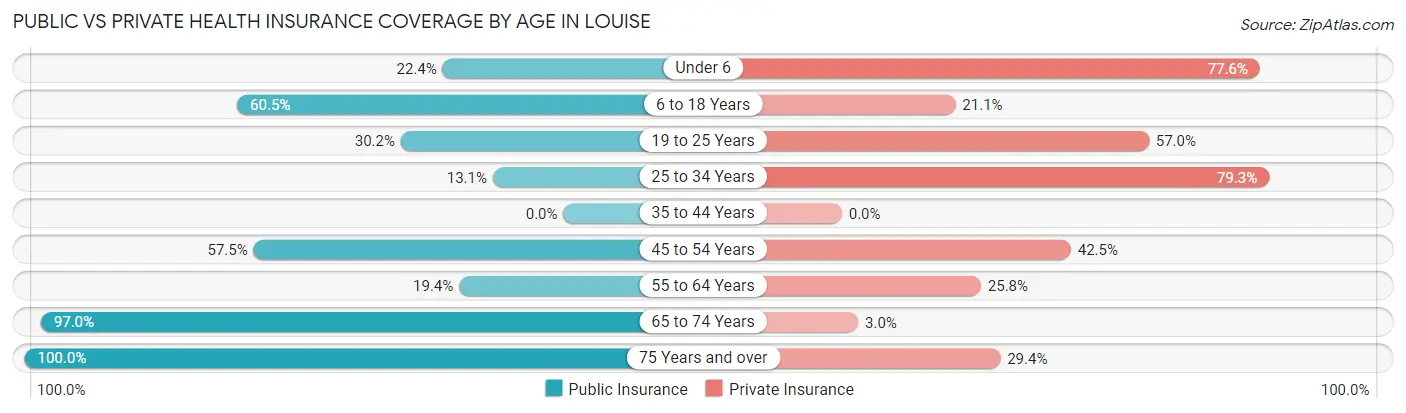
| Age Bracket | Public Insurance | Private Insurance |
| Under 6 | 39 (22.4%) | 135 (77.6%) |
| 6 to 18 Years | 89 (60.5%) | 31 (21.1%) |
| 19 to 25 Years | 54 (30.2%) | 102 (57.0%) |
| 25 to 34 Years | 38 (13.1%) | 230 (79.3%) |
| 35 to 44 Years | 0 (0.0%) | 0 (0.0%) |
| 45 to 54 Years | 23 (57.5%) | 17 (42.5%) |
| 55 to 64 Years | 6 (19.4%) | 8 (25.8%) |
| 65 to 74 Years | 64 (97.0%) | 2 (3.0%) |
| 75 Years and over | 34 (100.0%) | 10 (29.4%) |
| Total | 347 (36.1%) | 535 (55.7%) |
Disability Status by Sex by Age in Louise
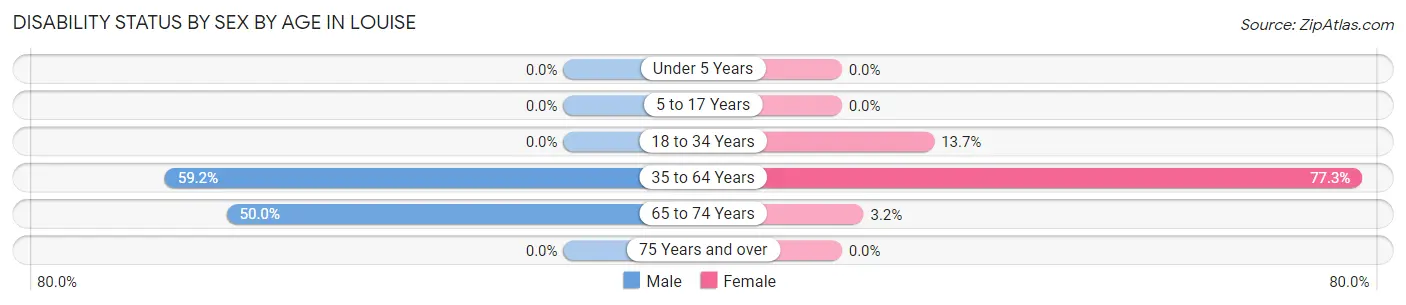
| Age Bracket | Male | Female |
| Under 5 Years | 0 (0.0%) | 0 (0.0%) |
| 5 to 17 Years | 0 (0.0%) | 0 (0.0%) |
| 18 to 34 Years | 0 (0.0%) | 38 (13.7%) |
| 35 to 64 Years | 29 (59.2%) | 17 (77.3%) |
| 65 to 74 Years | 2 (50.0%) | 2 (3.2%) |
| 75 Years and over | 0 (0.0%) | 0 (0.0%) |
Disability Class by Sex by Age in Louise
Disability Class: Hearing Difficulty
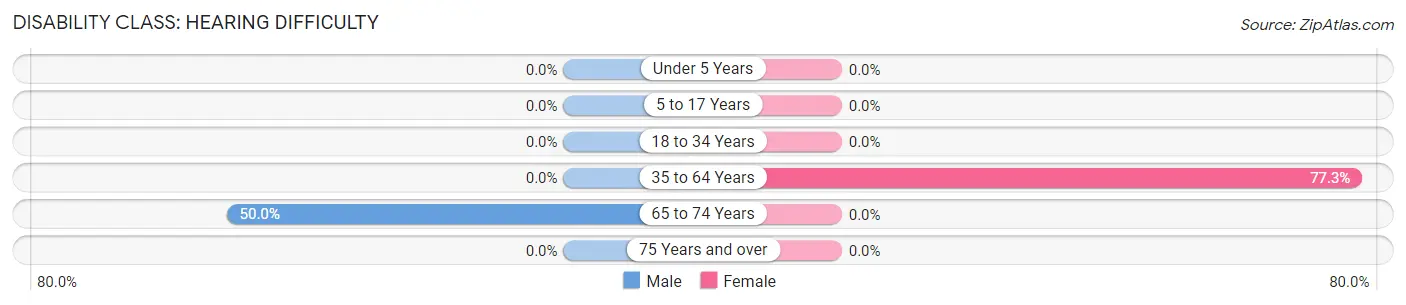
| Age Bracket | Male | Female |
| Under 5 Years | 0 (0.0%) | 0 (0.0%) |
| 5 to 17 Years | 0 (0.0%) | 0 (0.0%) |
| 18 to 34 Years | 0 (0.0%) | 0 (0.0%) |
| 35 to 64 Years | 0 (0.0%) | 17 (77.3%) |
| 65 to 74 Years | 2 (50.0%) | 0 (0.0%) |
| 75 Years and over | 0 (0.0%) | 0 (0.0%) |
Disability Class: Vision Difficulty
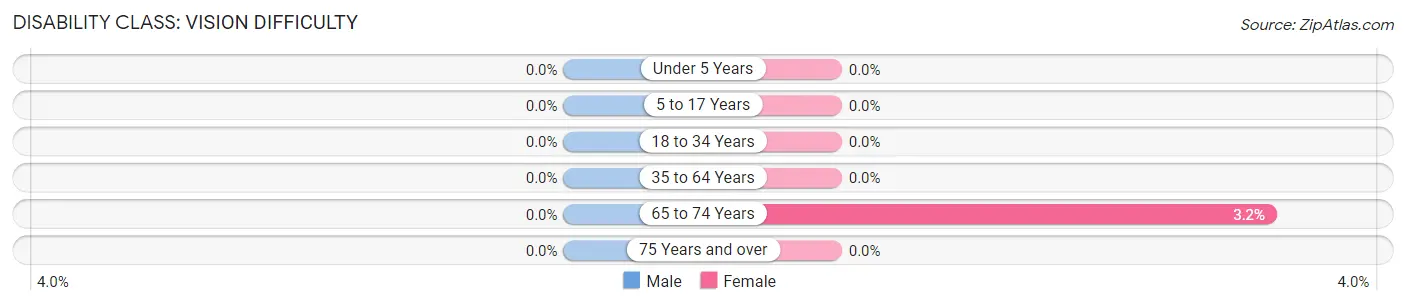
| Age Bracket | Male | Female |
| Under 5 Years | 0 (0.0%) | 0 (0.0%) |
| 5 to 17 Years | 0 (0.0%) | 0 (0.0%) |
| 18 to 34 Years | 0 (0.0%) | 0 (0.0%) |
| 35 to 64 Years | 0 (0.0%) | 0 (0.0%) |
| 65 to 74 Years | 0 (0.0%) | 2 (3.2%) |
| 75 Years and over | 0 (0.0%) | 0 (0.0%) |
Disability Class: Cognitive Difficulty
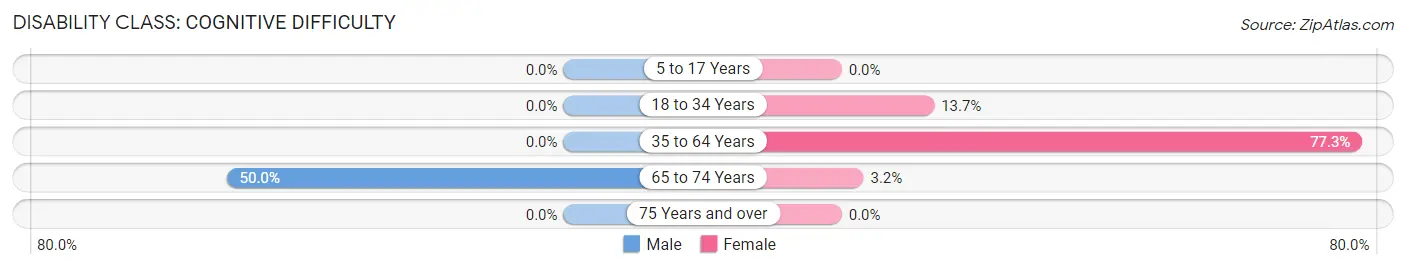
| Age Bracket | Male | Female |
| 5 to 17 Years | 0 (0.0%) | 0 (0.0%) |
| 18 to 34 Years | 0 (0.0%) | 38 (13.7%) |
| 35 to 64 Years | 0 (0.0%) | 17 (77.3%) |
| 65 to 74 Years | 2 (50.0%) | 2 (3.2%) |
| 75 Years and over | 0 (0.0%) | 0 (0.0%) |
Disability Class: Ambulatory Difficulty
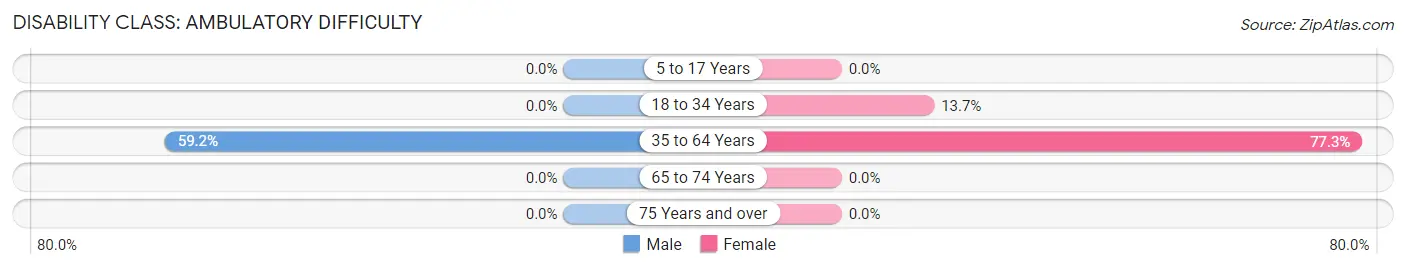
| Age Bracket | Male | Female |
| 5 to 17 Years | 0 (0.0%) | 0 (0.0%) |
| 18 to 34 Years | 0 (0.0%) | 38 (13.7%) |
| 35 to 64 Years | 29 (59.2%) | 17 (77.3%) |
| 65 to 74 Years | 0 (0.0%) | 0 (0.0%) |
| 75 Years and over | 0 (0.0%) | 0 (0.0%) |
Disability Class: Self-Care Difficulty
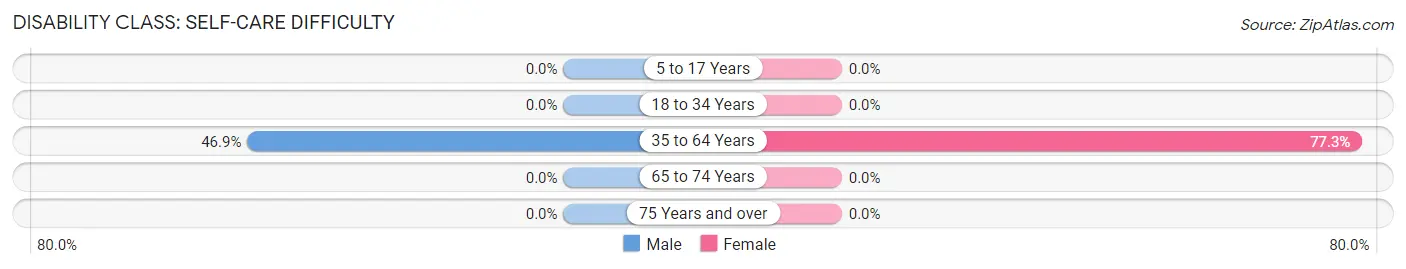
| Age Bracket | Male | Female |
| 5 to 17 Years | 0 (0.0%) | 0 (0.0%) |
| 18 to 34 Years | 0 (0.0%) | 0 (0.0%) |
| 35 to 64 Years | 23 (46.9%) | 17 (77.3%) |
| 65 to 74 Years | 0 (0.0%) | 0 (0.0%) |
| 75 Years and over | 0 (0.0%) | 0 (0.0%) |
Technology Access in Louise
Computing Device Access in Louise
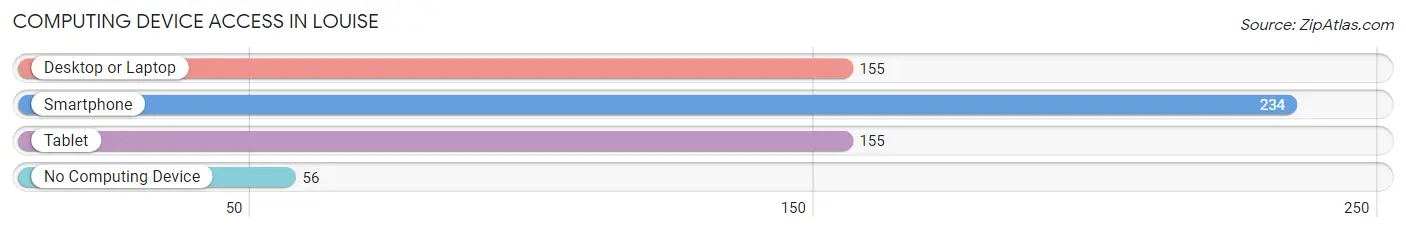
| Device Type | # Households | % Households |
| Desktop or Laptop | 155 | 47.3% |
| Smartphone | 234 | 71.3% |
| Tablet | 155 | 47.3% |
| No Computing Device | 56 | 17.1% |
| Total | 328 | 100.0% |
Internet Access in Louise
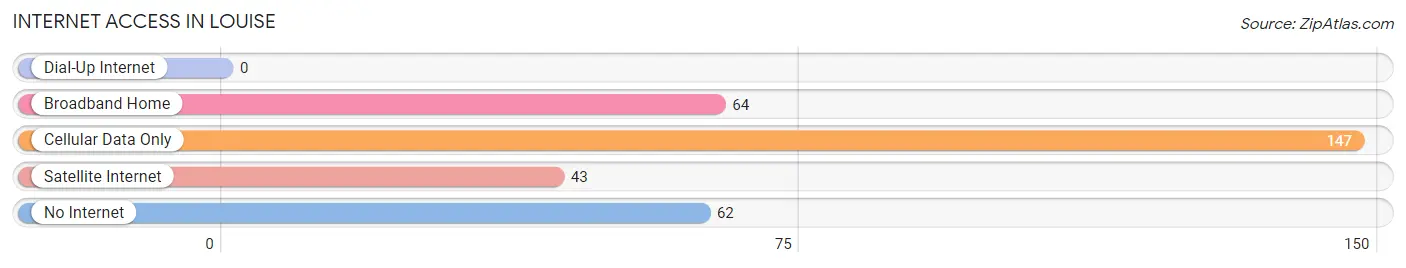
| Internet Type | # Households | % Households |
| Dial-Up Internet | 0 | 0.0% |
| Broadband Home | 64 | 19.5% |
| Cellular Data Only | 147 | 44.8% |
| Satellite Internet | 43 | 13.1% |
| No Internet | 62 | 18.9% |
| Total | 328 | 100.0% |
Louise Summary
Louise, Texas is a small town located in Wharton County, Texas. It is situated about 50 miles southwest of Houston and is part of the Houston–The Woodlands–Sugar Land metropolitan area. The population of Louise was 1,093 at the 2010 census.
History
Louise was founded in 1894 by German immigrants who had settled in the area. The town was named after Louise, the daughter of one of the original settlers. The town was incorporated in 1909 and has remained a small, rural community ever since.
Geography
Louise is located at the intersection of State Highway 71 and Farm to Market Road 442. It is situated in the coastal plains of Texas, about 50 miles southwest of Houston. The terrain is mostly flat, with some rolling hills. The climate is humid subtropical, with hot summers and mild winters.
Economy
The economy of Louise is largely based on agriculture. The town is home to several farms, which produce cotton, corn, soybeans, and other crops. There are also several small businesses in the area, including a grocery store, a hardware store, and a few restaurants.
Demographics
As of the 2010 census, the population of Louise was 1,093. The racial makeup of the town was 79.2% White, 16.2% Hispanic or Latino, 1.7% African American, 0.7% Native American, 0.3% Asian, and 2.1% from other races. The median household income was $37,917, and the median family income was $45,000.
Conclusion
Louise, Texas is a small, rural town located in Wharton County, Texas. It was founded in 1894 by German immigrants and has remained a small, rural community ever since. The economy of Louise is largely based on agriculture, with several farms producing cotton, corn, soybeans, and other crops. The population of Louise was 1,093 at the 2010 census, with a racial makeup of 79.2% White, 16.2% Hispanic or Latino, 1.7% African American, 0.7% Native American, 0.3% Asian, and 2.1% from other races. The median household income was $37,917, and the median family income was $45,000.
Common Questions
What is Per Capita Income in Louise?
Per Capita income in Louise is $20,451.
What is the Median Family Income in Louise?
Median Family Income in Louise is $61,107.
What is the Median Household income in Louise?
Median Household Income in Louise is $59,043.
What is Income or Wage Gap in Louise?
Income or Wage Gap in Louise is 79.9%.
Women in Louise earn 20.1 cents for every dollar earned by a man.
What is Inequality or Gini Index in Louise?
Inequality or Gini Index in Louise is 0.42.
What is the Total Population of Louise?
Total Population of Louise is 961.
What is the Total Male Population of Louise?
Total Male Population of Louise is 404.
What is the Total Female Population of Louise?
Total Female Population of Louise is 557.
What is the Ratio of Males per 100 Females in Louise?
There are 72.53 Males per 100 Females in Louise.
What is the Ratio of Females per 100 Males in Louise?
There are 137.87 Females per 100 Males in Louise.
What is the Median Population Age in Louise?
Median Population Age in Louise is 24.7 Years.
What is the Average Family Size in Louise
Average Family Size in Louise is 3.6 People.
What is the Average Household Size in Louise
Average Household Size in Louise is 2.9 People.
How Large is the Labor Force in Louise?
There are 458 People in the Labor Forcein in Louise.
What is the Percentage of People in the Labor Force in Louise?
71.6% of People are in the Labor Force in Louise.