Horseshoe Bay, TX Map & Demographics
Horseshoe Bay Map
Horseshoe Bay Overview
$65,854
PER CAPITA INCOME
$112,266
AVG FAMILY INCOME
$85,197
AVG HOUSEHOLD INCOME
41.8%
WAGE / INCOME GAP [ % ]
58.2¢/ $1
WAGE / INCOME GAP [ $ ]
$7,222
FAMILY INCOME DEFICIT
0.49
INEQUALITY / GINI INDEX
4,601
TOTAL POPULATION
2,272
MALE POPULATION
2,329
FEMALE POPULATION
97.55
MALES / 100 FEMALES
102.51
FEMALES / 100 MALES
65.3
MEDIAN AGE
2.5
AVG FAMILY SIZE
2.0
AVG HOUSEHOLD SIZE
1,829
LABOR FORCE [ PEOPLE ]
43.6%
PERCENT IN LABOR FORCE
3.5%
UNEMPLOYMENT RATE
Horseshoe Bay Zip Codes
Horseshoe Bay Area Codes
Income in Horseshoe Bay
Income Overview in Horseshoe Bay
Per Capita Income in Horseshoe Bay is $65,854, while median incomes of families and households are $112,266 and $85,197 respectively.
| Characteristic | Number | Measure |
| Per Capita Income | 4,601 | $65,854 |
| Median Family Income | 1,487 | $112,266 |
| Mean Family Income | 1,487 | $153,292 |
| Median Household Income | 2,348 | $85,197 |
| Mean Household Income | 2,348 | $123,690 |
| Income Deficit | 1,487 | $7,222 |
| Wage / Income Gap (%) | 4,601 | 41.84% |
| Wage / Income Gap ($) | 4,601 | 58.16¢ per $1 |
| Gini / Inequality Index | 4,601 | 0.49 |
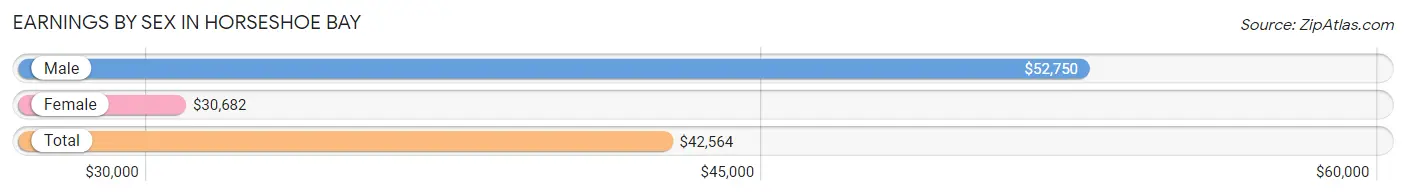
Earnings by Sex in Horseshoe Bay
Average Earnings in Horseshoe Bay are $42,564, $52,750 for men and $30,682 for women, a difference of 41.8%.
| Sex | Number | Average Earnings |
| Male | 955 (50.9%) | $52,750 |
| Female | 920 (49.1%) | $30,682 |
| Total | 1,875 (100.0%) | $42,564 |
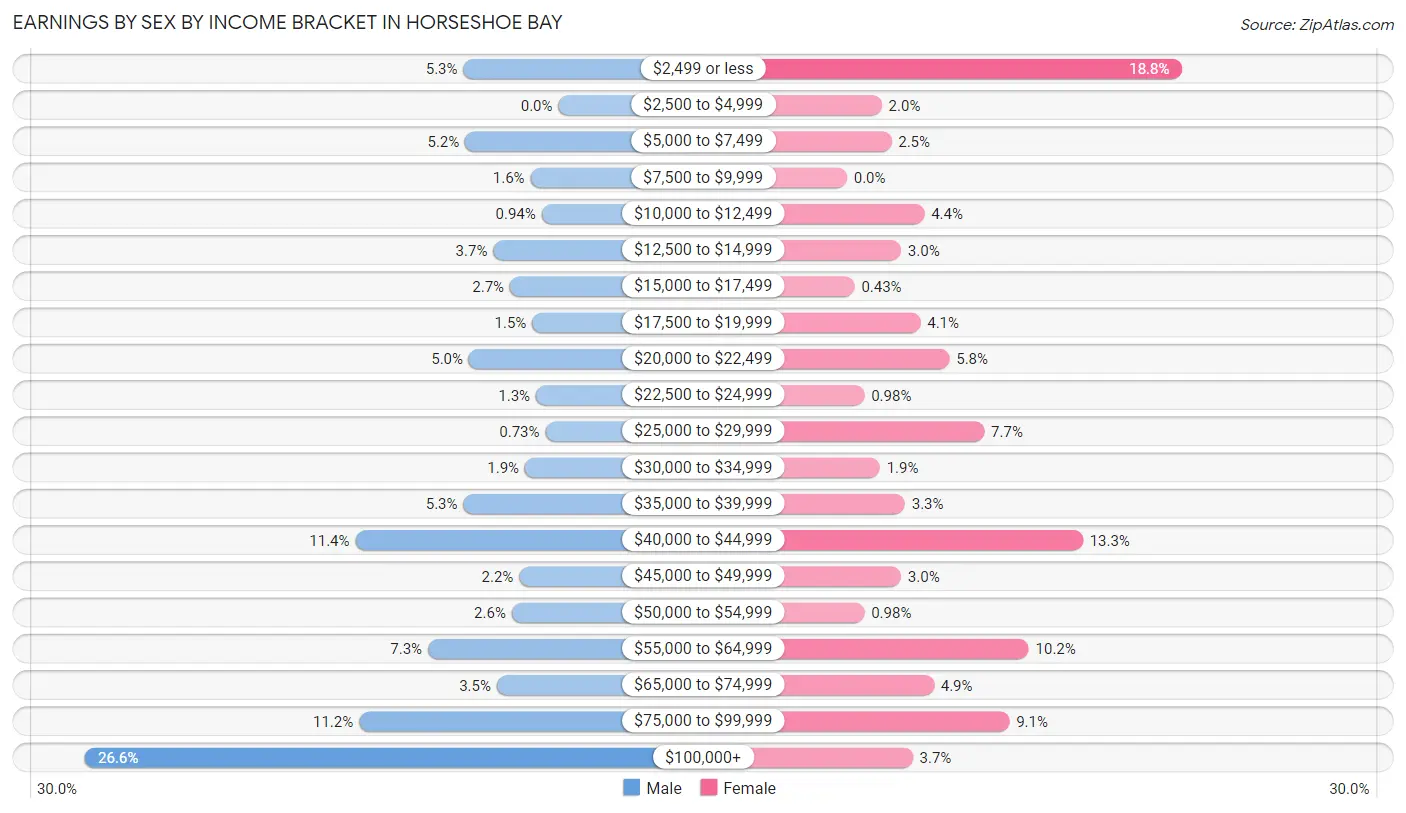
Earnings by Sex by Income Bracket in Horseshoe Bay
The most common earnings brackets in Horseshoe Bay are $100,000+ for men (254 | 26.6%) and $2,499 or less for women (173 | 18.8%).
| Income | Male | Female |
| $2,499 or less | 51 (5.3%) | 173 (18.8%) |
| $2,500 to $4,999 | 0 (0.0%) | 18 (2.0%) |
| $5,000 to $7,499 | 50 (5.2%) | 23 (2.5%) |
| $7,500 to $9,999 | 15 (1.6%) | 0 (0.0%) |
| $10,000 to $12,499 | 9 (0.9%) | 40 (4.3%) |
| $12,500 to $14,999 | 35 (3.7%) | 28 (3.0%) |
| $15,000 to $17,499 | 26 (2.7%) | 4 (0.4%) |
| $17,500 to $19,999 | 14 (1.5%) | 38 (4.1%) |
| $20,000 to $22,499 | 48 (5.0%) | 53 (5.8%) |
| $22,500 to $24,999 | 12 (1.3%) | 9 (1.0%) |
| $25,000 to $29,999 | 7 (0.7%) | 71 (7.7%) |
| $30,000 to $34,999 | 18 (1.9%) | 17 (1.8%) |
| $35,000 to $39,999 | 51 (5.3%) | 30 (3.3%) |
| $40,000 to $44,999 | 109 (11.4%) | 122 (13.3%) |
| $45,000 to $49,999 | 21 (2.2%) | 28 (3.0%) |
| $50,000 to $54,999 | 25 (2.6%) | 9 (1.0%) |
| $55,000 to $64,999 | 70 (7.3%) | 94 (10.2%) |
| $65,000 to $74,999 | 33 (3.5%) | 45 (4.9%) |
| $75,000 to $99,999 | 107 (11.2%) | 84 (9.1%) |
| $100,000+ | 254 (26.6%) | 34 (3.7%) |
| Total | 955 (100.0%) | 920 (100.0%) |
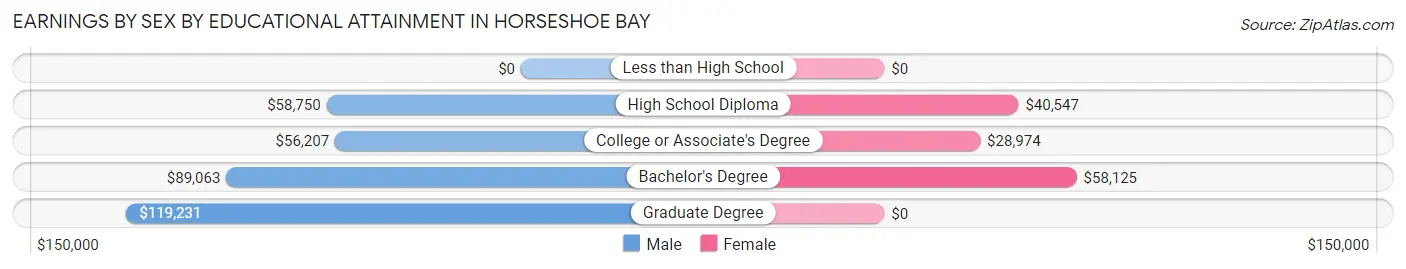
Earnings by Sex by Educational Attainment in Horseshoe Bay
Average earnings in Horseshoe Bay are $53,667 for men and $40,253 for women, a difference of 25.0%. Men with an educational attainment of graduate degree enjoy the highest average annual earnings of $119,231, while those with college or associate's degree education earn the least with $56,207. Women with an educational attainment of bachelor's degree earn the most with the average annual earnings of $58,125, while those with college or associate's degree education have the smallest earnings of $28,974.
| Educational Attainment | Male Income | Female Income |
| Less than High School | - | - |
| High School Diploma | $58,750 | $40,547 |
| College or Associate's Degree | $56,207 | $28,974 |
| Bachelor's Degree | $89,063 | $58,125 |
| Graduate Degree | $119,231 | $0 |
| Total | $53,667 | $40,253 |
Family Income in Horseshoe Bay
Family Income Brackets in Horseshoe Bay
According to the Horseshoe Bay family income data, there are 343 families falling into the $50,000 to $74,999 income range, which is the most common income bracket and makes up 23.1% of all families. Conversely, the $10,000 to $14,999 income bracket is the least frequent group with only 7 families (0.5%) belonging to this category.
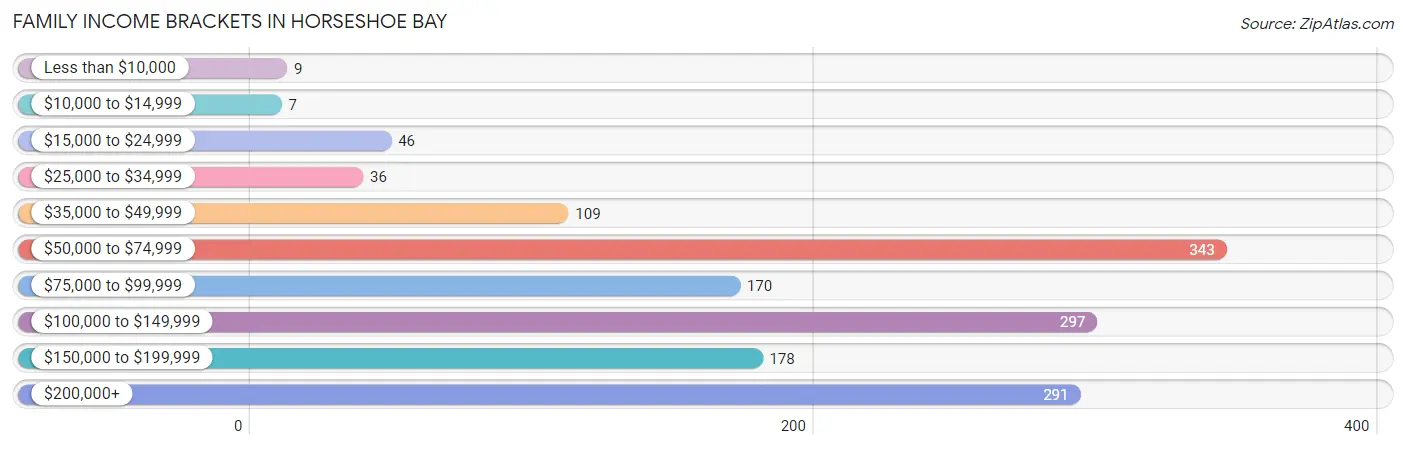
| Income Bracket | # Families | % Families |
| Less than $10,000 | 9 | 0.6% |
| $10,000 to $14,999 | 7 | 0.5% |
| $15,000 to $24,999 | 46 | 3.1% |
| $25,000 to $34,999 | 36 | 2.4% |
| $35,000 to $49,999 | 109 | 7.3% |
| $50,000 to $74,999 | 343 | 23.1% |
| $75,000 to $99,999 | 170 | 11.4% |
| $100,000 to $149,999 | 297 | 20.0% |
| $150,000 to $199,999 | 178 | 12.0% |
| $200,000+ | 291 | 19.6% |
Family Income by Famaliy Size in Horseshoe Bay
4-person families (117 | 7.9%) account for the highest median family income in Horseshoe Bay with $146,042 per family, while 2-person families (1,164 | 78.3%) have the highest median income of $58,020 per family member.
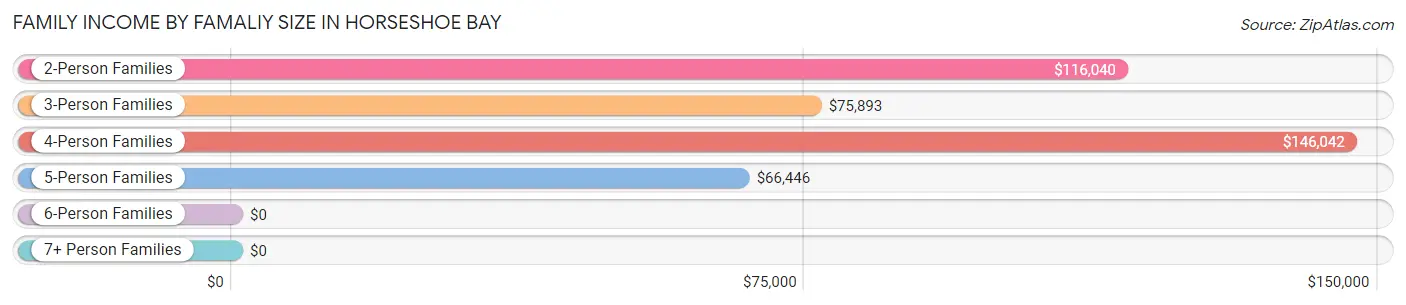
| Income Bracket | # Families | Median Income |
| 2-Person Families | 1,164 (78.3%) | $116,040 |
| 3-Person Families | 97 (6.5%) | $75,893 |
| 4-Person Families | 117 (7.9%) | $146,042 |
| 5-Person Families | 109 (7.3%) | $66,446 |
| 6-Person Families | 0 (0.0%) | $0 |
| 7+ Person Families | 0 (0.0%) | $0 |
| Total | 1,487 (100.0%) | $112,266 |
Family Income by Number of Earners in Horseshoe Bay
The median family income in Horseshoe Bay is $112,266, with families comprising 1 earner (327) having the highest median family income of $131,806, while families with 3+ earners (94) have the lowest median family income of $66,679, accounting for 22.0% and 6.3% of families, respectively.

| Number of Earners | # Families | Median Income |
| No Earners | 688 (46.3%) | $115,347 |
| 1 Earner | 327 (22.0%) | $131,806 |
| 2 Earners | 378 (25.4%) | $111,563 |
| 3+ Earners | 94 (6.3%) | $66,679 |
| Total | 1,487 (100.0%) | $112,266 |
Household Income in Horseshoe Bay
Household Income Brackets in Horseshoe Bay
With 486 households falling in the category, the $50,000 to $74,999 income range is the most frequent in Horseshoe Bay, accounting for 20.7% of all households. In contrast, only 47 households (2.0%) fall into the $10,000 to $14,999 income bracket, making it the least populous group.
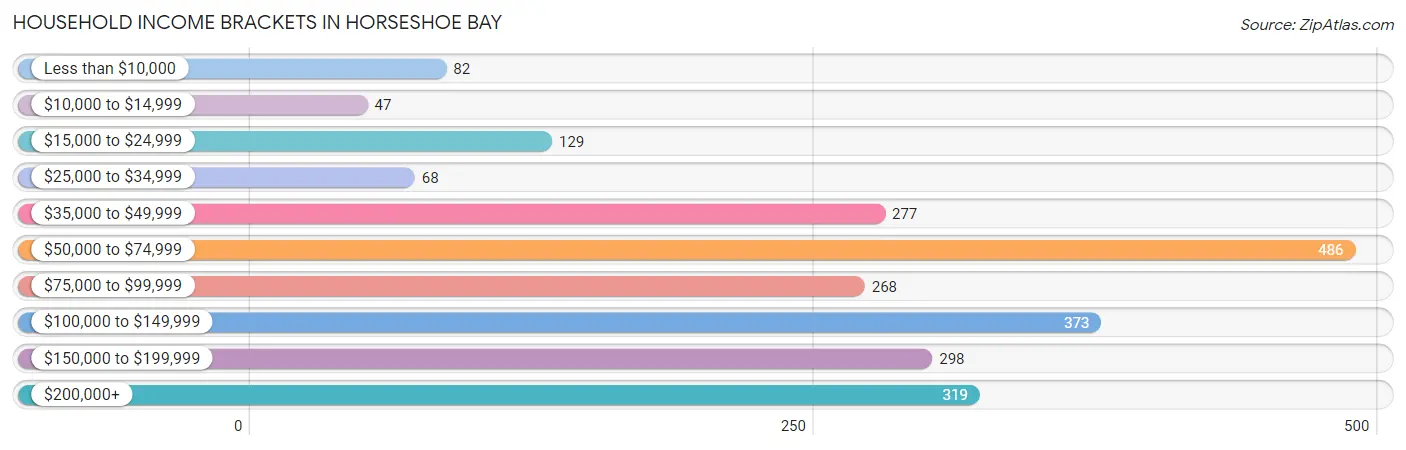
| Income Bracket | # Households | % Households |
| Less than $10,000 | 82 | 3.5% |
| $10,000 to $14,999 | 47 | 2.0% |
| $15,000 to $24,999 | 129 | 5.5% |
| $25,000 to $34,999 | 68 | 2.9% |
| $35,000 to $49,999 | 277 | 11.8% |
| $50,000 to $74,999 | 486 | 20.7% |
| $75,000 to $99,999 | 268 | 11.4% |
| $100,000 to $149,999 | 373 | 15.9% |
| $150,000 to $199,999 | 298 | 12.7% |
| $200,000+ | 319 | 13.6% |
Household Income by Householder Age in Horseshoe Bay
The median household income in Horseshoe Bay is $85,197, with the highest median household income of $121,129 found in the 45 to 64 years age bracket for the primary householder. A total of 612 households (26.1%) fall into this category. Meanwhile, the 15 to 24 years age bracket for the primary householder has the lowest median household income of $0, with 36 households (1.5%) in this group.
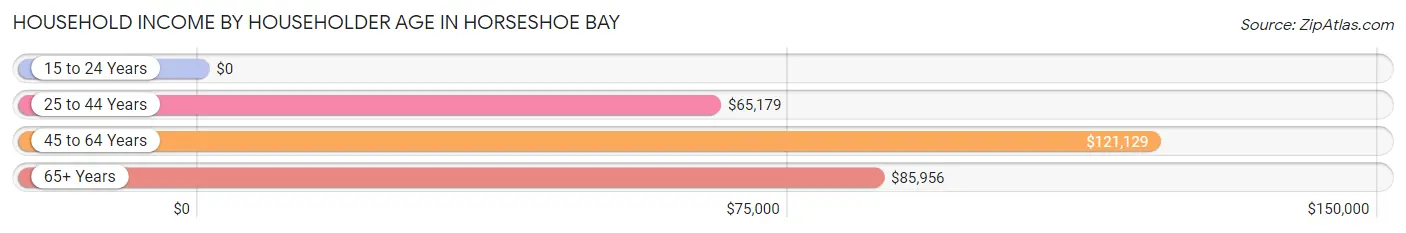
| Income Bracket | # Households | Median Income |
| 15 to 24 Years | 36 (1.5%) | $0 |
| 25 to 44 Years | 318 (13.5%) | $65,179 |
| 45 to 64 Years | 612 (26.1%) | $121,129 |
| 65+ Years | 1,382 (58.9%) | $85,956 |
| Total | 2,348 (100.0%) | $85,197 |
Poverty in Horseshoe Bay
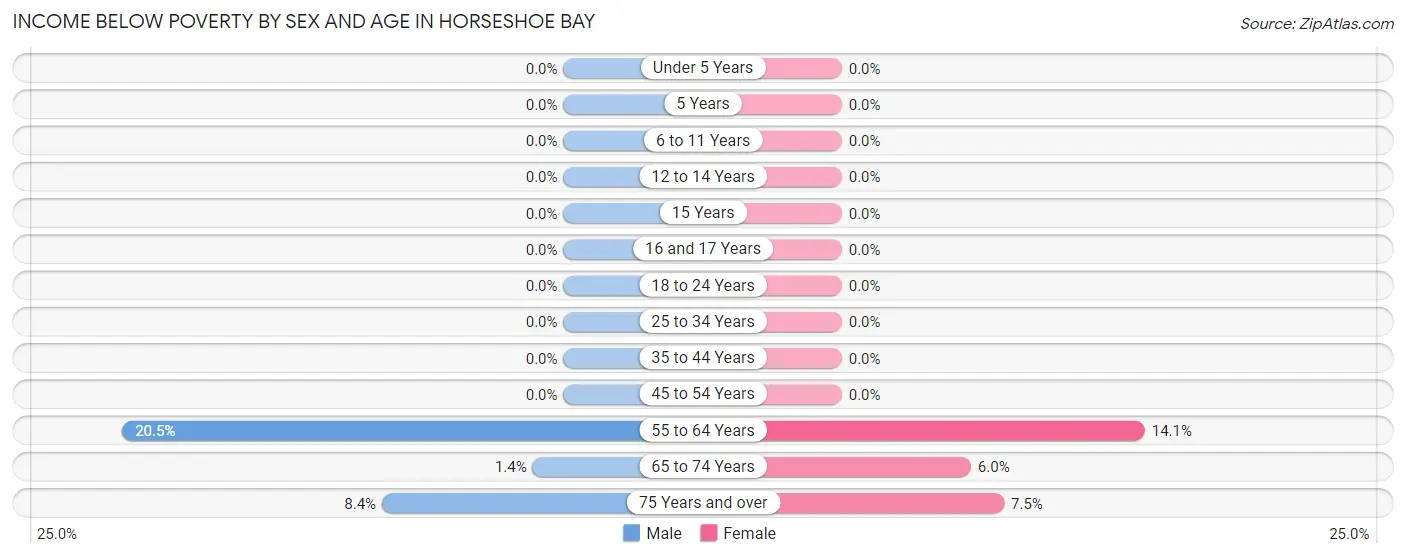
Income Below Poverty by Sex and Age in Horseshoe Bay
With 5.2% poverty level for males and 6.0% for females among the residents of Horseshoe Bay, 55 to 64 year old males and 55 to 64 year old females are the most vulnerable to poverty, with 52 males (20.5%) and 61 females (14.1%) in their respective age groups living below the poverty level.
| Age Bracket | Male | Female |
| Under 5 Years | 0 (0.0%) | 0 (0.0%) |
| 5 Years | 0 (0.0%) | 0 (0.0%) |
| 6 to 11 Years | 0 (0.0%) | 0 (0.0%) |
| 12 to 14 Years | 0 (0.0%) | 0 (0.0%) |
| 15 Years | 0 (0.0%) | 0 (0.0%) |
| 16 and 17 Years | 0 (0.0%) | 0 (0.0%) |
| 18 to 24 Years | 0 (0.0%) | 0 (0.0%) |
| 25 to 34 Years | 0 (0.0%) | 0 (0.0%) |
| 35 to 44 Years | 0 (0.0%) | 0 (0.0%) |
| 45 to 54 Years | 0 (0.0%) | 0 (0.0%) |
| 55 to 64 Years | 52 (20.5%) | 61 (14.1%) |
| 65 to 74 Years | 7 (1.4%) | 39 (6.0%) |
| 75 Years and over | 58 (8.4%) | 39 (7.5%) |
| Total | 117 (5.2%) | 139 (6.0%) |
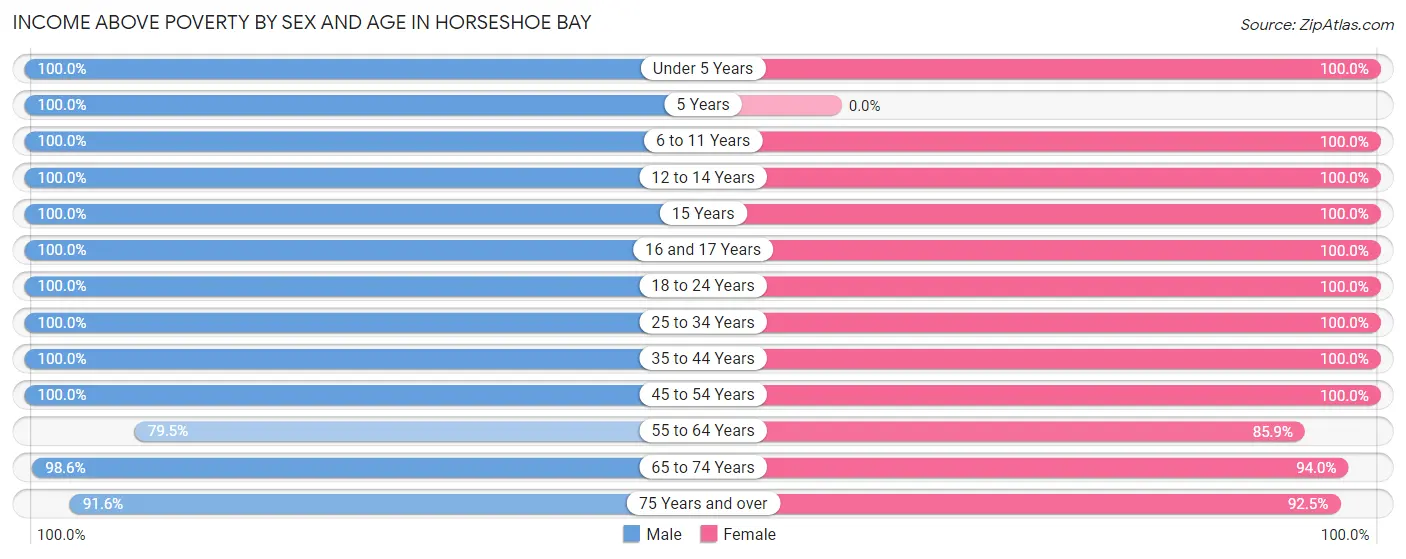
Income Above Poverty by Sex and Age in Horseshoe Bay
According to the poverty statistics in Horseshoe Bay, males aged under 5 years and females aged under 5 years are the age groups that are most secure financially, with 100.0% of males and 100.0% of females in these age groups living above the poverty line.
| Age Bracket | Male | Female |
| Under 5 Years | 56 (100.0%) | 108 (100.0%) |
| 5 Years | 20 (100.0%) | 0 (0.0%) |
| 6 to 11 Years | 38 (100.0%) | 11 (100.0%) |
| 12 to 14 Years | 61 (100.0%) | 12 (100.0%) |
| 15 Years | 78 (100.0%) | 12 (100.0%) |
| 16 and 17 Years | 14 (100.0%) | 63 (100.0%) |
| 18 to 24 Years | 31 (100.0%) | 77 (100.0%) |
| 25 to 34 Years | 89 (100.0%) | 56 (100.0%) |
| 35 to 44 Years | 113 (100.0%) | 251 (100.0%) |
| 45 to 54 Years | 327 (100.0%) | 136 (100.0%) |
| 55 to 64 Years | 202 (79.5%) | 373 (85.9%) |
| 65 to 74 Years | 484 (98.6%) | 612 (94.0%) |
| 75 Years and over | 631 (91.6%) | 479 (92.5%) |
| Total | 2,144 (94.8%) | 2,190 (94.0%) |
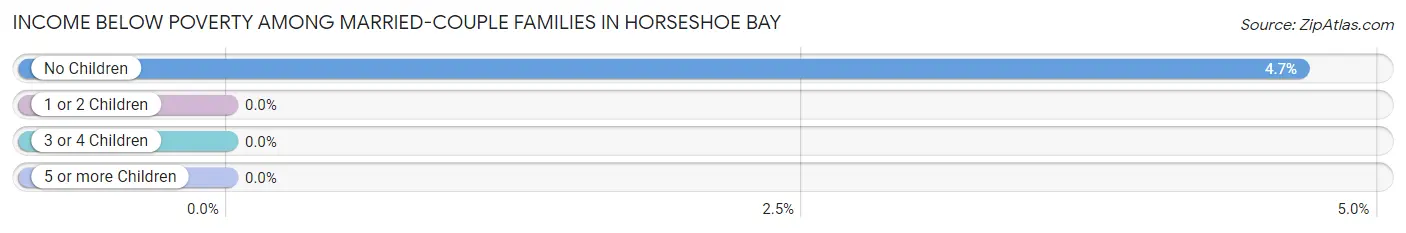
Income Below Poverty Among Married-Couple Families in Horseshoe Bay
The poverty statistics for married-couple families in Horseshoe Bay show that 4.1% or 55 of the total 1,346 families live below the poverty line. Families with no children have the highest poverty rate of 4.7%, comprising of 55 families. On the other hand, families with 1 or 2 children have the lowest poverty rate of 0.0%, which includes 0 families.
| Children | Above Poverty | Below Poverty |
| No Children | 1,125 (95.3%) | 55 (4.7%) |
| 1 or 2 Children | 141 (100.0%) | 0 (0.0%) |
| 3 or 4 Children | 25 (100.0%) | 0 (0.0%) |
| 5 or more Children | 0 (0.0%) | 0 (0.0%) |
| Total | 1,291 (95.9%) | 55 (4.1%) |
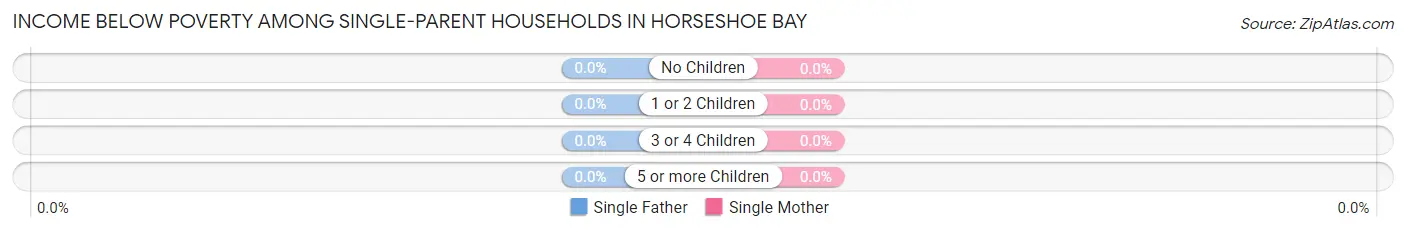
Income Below Poverty Among Single-Parent Households in Horseshoe Bay
| Children | Single Father | Single Mother |
| No Children | 0 (0.0%) | 0 (0.0%) |
| 1 or 2 Children | 0 (0.0%) | 0 (0.0%) |
| 3 or 4 Children | 0 (0.0%) | 0 (0.0%) |
| 5 or more Children | 0 (0.0%) | 0 (0.0%) |
| Total | 0 (0.0%) | 0 (0.0%) |
Income Below Poverty Among Married-Couple vs Single-Parent Households in Horseshoe Bay
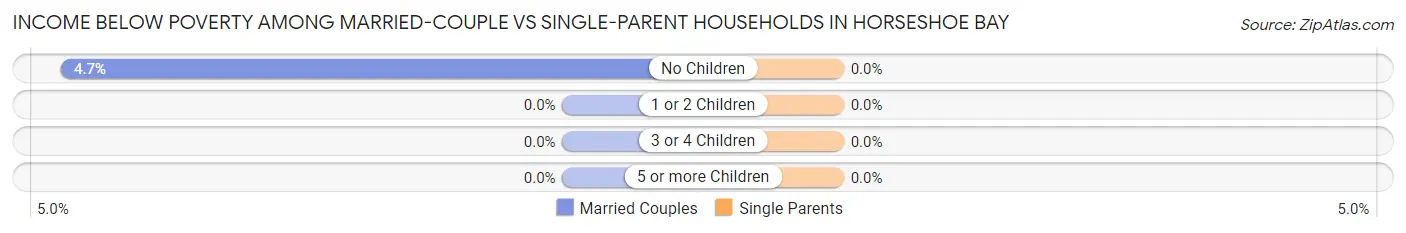
| Children | Married-Couple Families | Single-Parent Households |
| No Children | 55 (4.7%) | 0 (0.0%) |
| 1 or 2 Children | 0 (0.0%) | 0 (0.0%) |
| 3 or 4 Children | 0 (0.0%) | 0 (0.0%) |
| 5 or more Children | 0 (0.0%) | 0 (0.0%) |
| Total | 55 (4.1%) | 0 (0.0%) |
Race in Horseshoe Bay
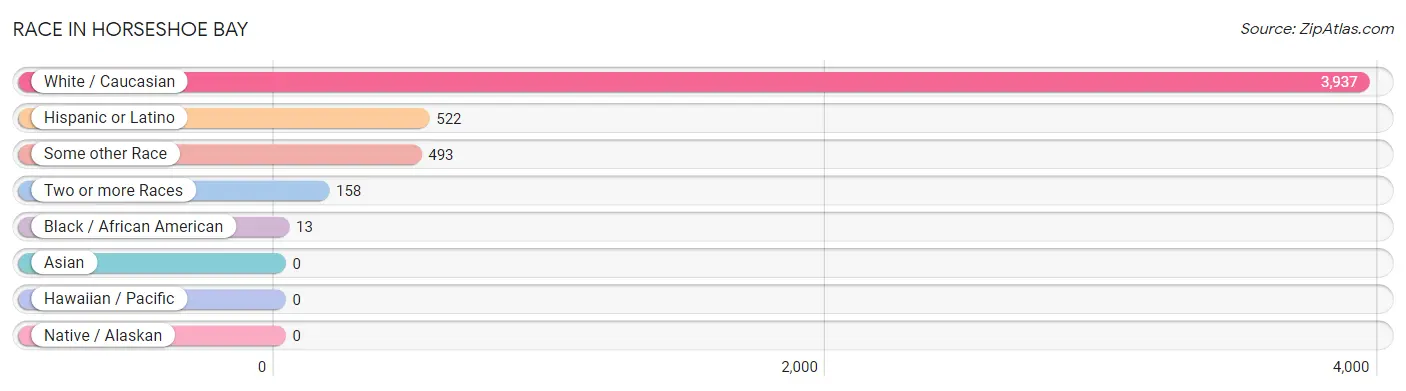
The most populous races in Horseshoe Bay are White / Caucasian (3,937 | 85.6%), Hispanic or Latino (522 | 11.4%), and Some other Race (493 | 10.7%).
| Race | # Population | % Population |
| Asian | 0 | 0.0% |
| Black / African American | 13 | 0.3% |
| Hawaiian / Pacific | 0 | 0.0% |
| Hispanic or Latino | 522 | 11.4% |
| Native / Alaskan | 0 | 0.0% |
| White / Caucasian | 3,937 | 85.6% |
| Two or more Races | 158 | 3.4% |
| Some other Race | 493 | 10.7% |
| Total | 4,601 | 100.0% |
Ancestry in Horseshoe Bay
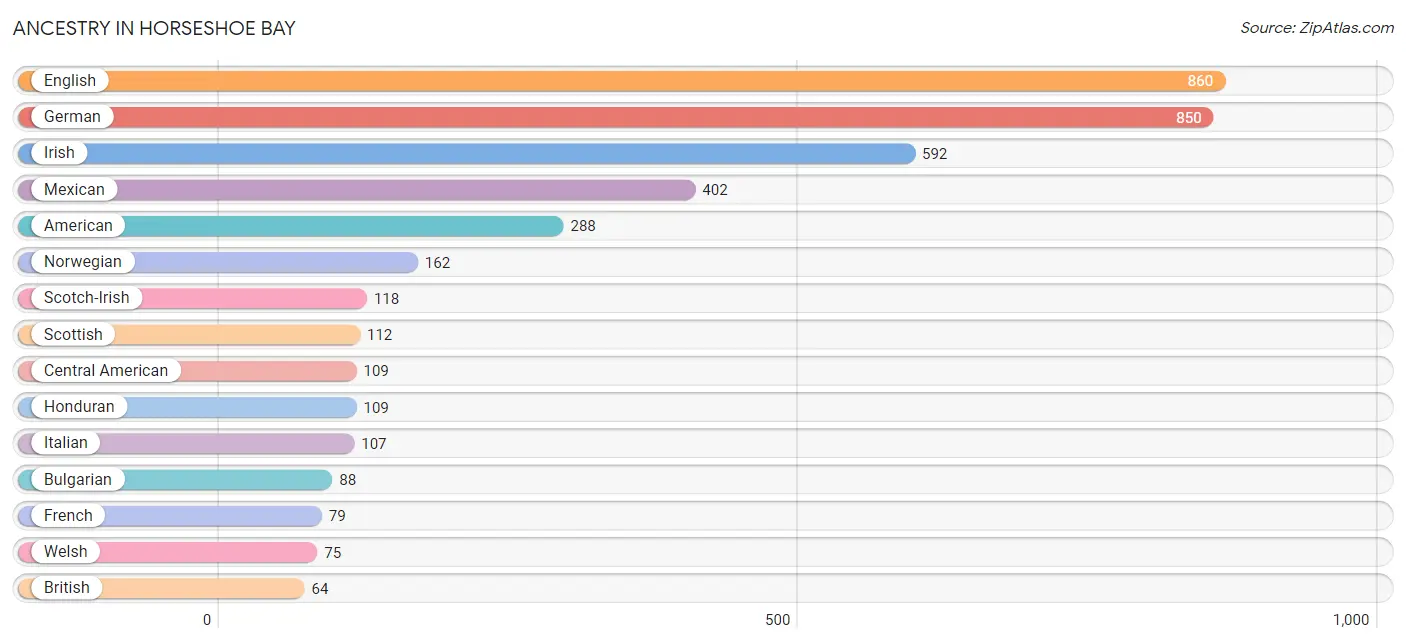
The most populous ancestries reported in Horseshoe Bay are English (860 | 18.7%), German (850 | 18.5%), Irish (592 | 12.9%), Mexican (402 | 8.7%), and American (288 | 6.3%), together accounting for 65.0% of all Horseshoe Bay residents.
| Ancestry | # Population | % Population |
| American | 288 | 6.3% |
| Austrian | 21 | 0.5% |
| British | 64 | 1.4% |
| Bulgarian | 88 | 1.9% |
| Canadian | 6 | 0.1% |
| Central American | 109 | 2.4% |
| Cherokee | 53 | 1.1% |
| Chickasaw | 45 | 1.0% |
| Cuban | 11 | 0.2% |
| Czech | 15 | 0.3% |
| Czechoslovakian | 33 | 0.7% |
| Danish | 6 | 0.1% |
| Dutch | 16 | 0.4% |
| Eastern European | 10 | 0.2% |
| English | 860 | 18.7% |
| European | 7 | 0.2% |
| French | 79 | 1.7% |
| French Canadian | 22 | 0.5% |
| German | 850 | 18.5% |
| Greek | 7 | 0.2% |
| Honduran | 109 | 2.4% |
| Hungarian | 9 | 0.2% |
| Irish | 592 | 12.9% |
| Italian | 107 | 2.3% |
| Mexican | 402 | 8.7% |
| Northern European | 17 | 0.4% |
| Norwegian | 162 | 3.5% |
| Polish | 37 | 0.8% |
| Portuguese | 9 | 0.2% |
| Romanian | 8 | 0.2% |
| Scandinavian | 54 | 1.2% |
| Scotch-Irish | 118 | 2.6% |
| Scottish | 112 | 2.4% |
| Swedish | 59 | 1.3% |
| Welsh | 75 | 1.6% | View All 35 Rows |
Immigrants in Horseshoe Bay
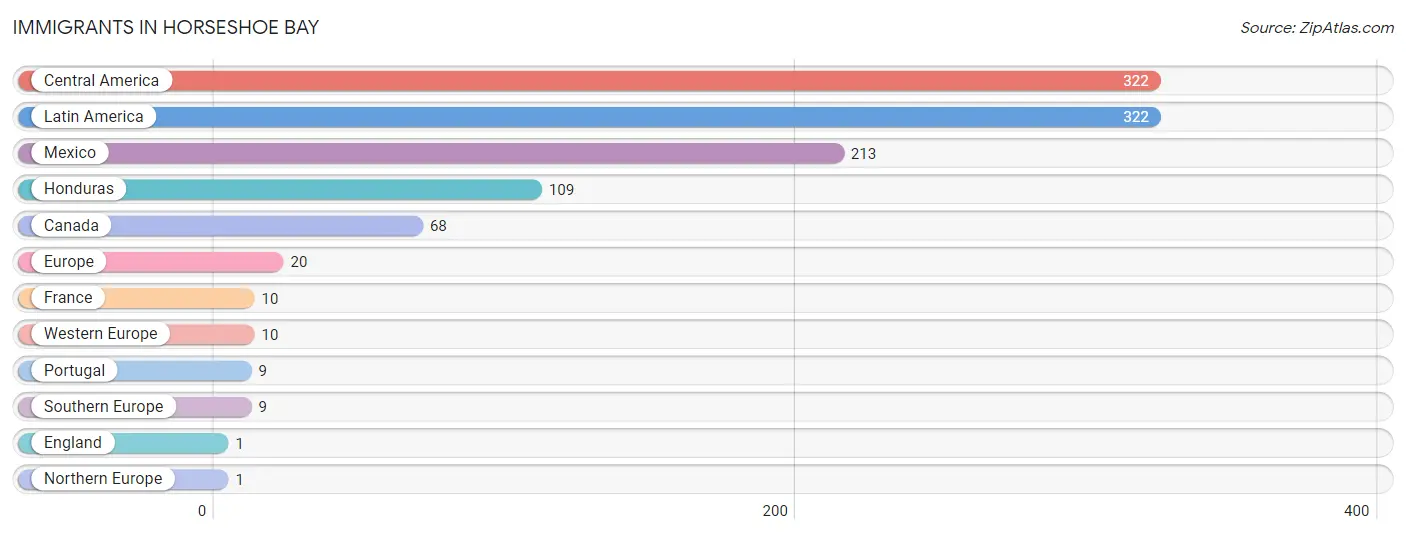
The most numerous immigrant groups reported in Horseshoe Bay came from Central America (322 | 7.0%), Latin America (322 | 7.0%), Mexico (213 | 4.6%), Honduras (109 | 2.4%), and Canada (68 | 1.5%), together accounting for 22.5% of all Horseshoe Bay residents.
| Immigration Origin | # Population | % Population |
| Canada | 68 | 1.5% |
| Central America | 322 | 7.0% |
| England | 1 | 0.0% |
| Europe | 20 | 0.4% |
| France | 10 | 0.2% |
| Honduras | 109 | 2.4% |
| Latin America | 322 | 7.0% |
| Mexico | 213 | 4.6% |
| Northern Europe | 1 | 0.0% |
| Portugal | 9 | 0.2% |
| Southern Europe | 9 | 0.2% |
| Western Europe | 10 | 0.2% | View All 12 Rows |
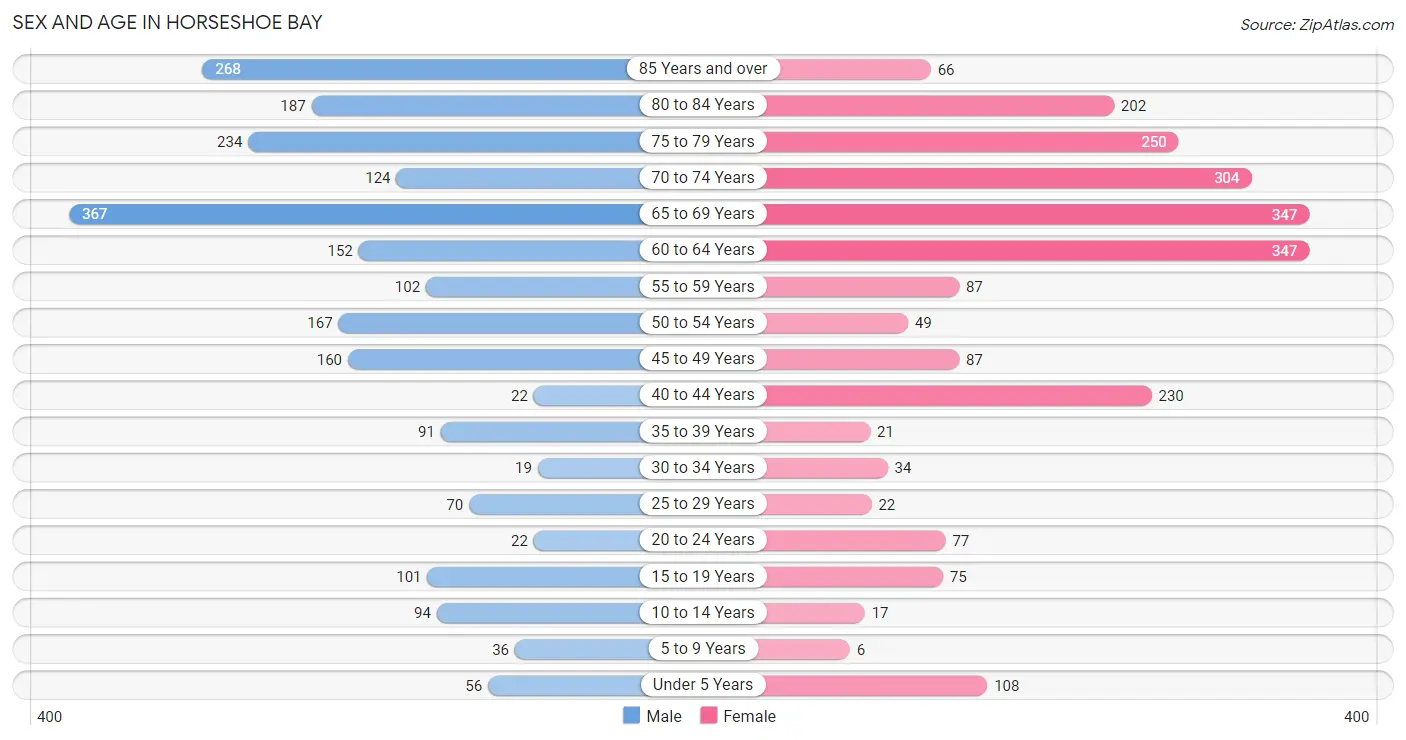
Sex and Age in Horseshoe Bay
Sex and Age in Horseshoe Bay
The most populous age groups in Horseshoe Bay are 65 to 69 Years (367 | 16.2%) for men and 60 to 64 Years (347 | 14.9%) for women.
| Age Bracket | Male | Female |
| Under 5 Years | 56 (2.5%) | 108 (4.6%) |
| 5 to 9 Years | 36 (1.6%) | 6 (0.3%) |
| 10 to 14 Years | 94 (4.1%) | 17 (0.7%) |
| 15 to 19 Years | 101 (4.4%) | 75 (3.2%) |
| 20 to 24 Years | 22 (1.0%) | 77 (3.3%) |
| 25 to 29 Years | 70 (3.1%) | 22 (0.9%) |
| 30 to 34 Years | 19 (0.8%) | 34 (1.5%) |
| 35 to 39 Years | 91 (4.0%) | 21 (0.9%) |
| 40 to 44 Years | 22 (1.0%) | 230 (9.9%) |
| 45 to 49 Years | 160 (7.0%) | 87 (3.7%) |
| 50 to 54 Years | 167 (7.3%) | 49 (2.1%) |
| 55 to 59 Years | 102 (4.5%) | 87 (3.7%) |
| 60 to 64 Years | 152 (6.7%) | 347 (14.9%) |
| 65 to 69 Years | 367 (16.2%) | 347 (14.9%) |
| 70 to 74 Years | 124 (5.5%) | 304 (13.1%) |
| 75 to 79 Years | 234 (10.3%) | 250 (10.7%) |
| 80 to 84 Years | 187 (8.2%) | 202 (8.7%) |
| 85 Years and over | 268 (11.8%) | 66 (2.8%) |
| Total | 2,272 (100.0%) | 2,329 (100.0%) |
Families and Households in Horseshoe Bay
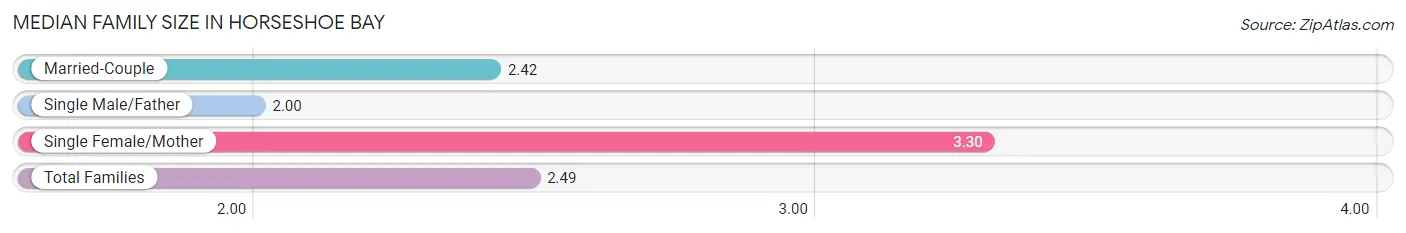
Median Family Size in Horseshoe Bay
The median family size in Horseshoe Bay is 2.49 persons per family, with single female/mother families (120 | 8.1%) accounting for the largest median family size of 3.3 persons per family. On the other hand, single male/father families (21 | 1.4%) represent the smallest median family size with 2.00 persons per family.
| Family Type | # Families | Family Size |
| Married-Couple | 1,346 (90.5%) | 2.42 |
| Single Male/Father | 21 (1.4%) | 2.00 |
| Single Female/Mother | 120 (8.1%) | 3.30 |
| Total Families | 1,487 (100.0%) | 2.49 |
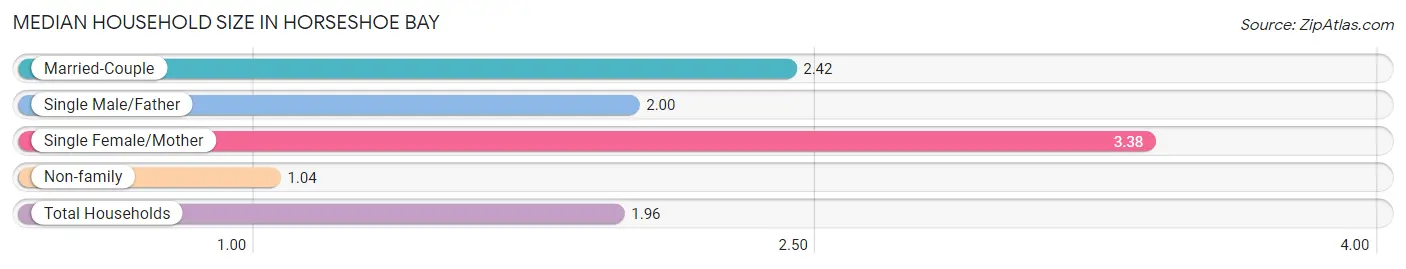
Median Household Size in Horseshoe Bay
The median household size in Horseshoe Bay is 1.96 persons per household, with single female/mother households (120 | 5.1%) accounting for the largest median household size of 3.38 persons per household. non-family households (861 | 36.7%) represent the smallest median household size with 1.04 persons per household.
| Household Type | # Households | Household Size |
| Married-Couple | 1,346 (57.3%) | 2.42 |
| Single Male/Father | 21 (0.9%) | 2.00 |
| Single Female/Mother | 120 (5.1%) | 3.38 |
| Non-family | 861 (36.7%) | 1.04 |
| Total Households | 2,348 (100.0%) | 1.96 |
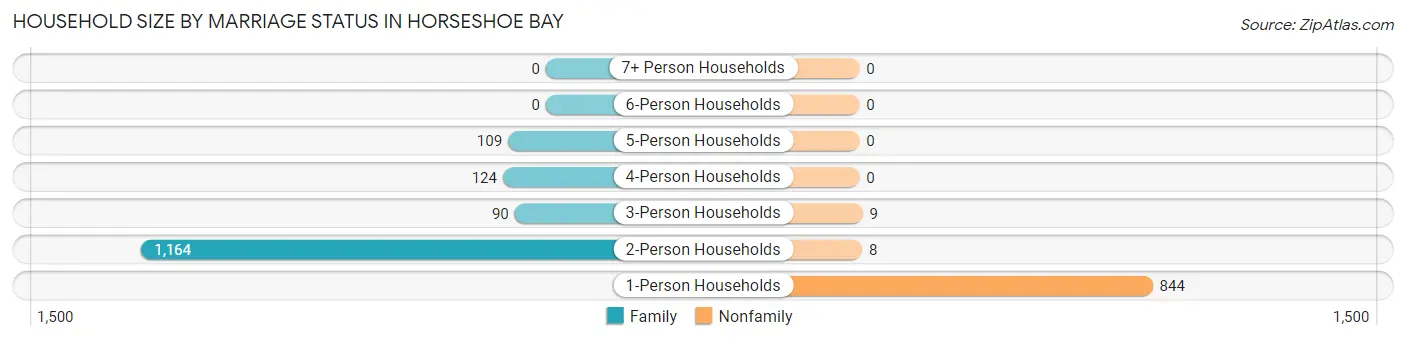
Household Size by Marriage Status in Horseshoe Bay
Out of a total of 2,348 households in Horseshoe Bay, 1,487 (63.3%) are family households, while 861 (36.7%) are nonfamily households. The most numerous type of family households are 2-person households, comprising 1,164, and the most common type of nonfamily households are 1-person households, comprising 844.
| Household Size | Family Households | Nonfamily Households |
| 1-Person Households | - | 844 (35.9%) |
| 2-Person Households | 1,164 (49.6%) | 8 (0.3%) |
| 3-Person Households | 90 (3.8%) | 9 (0.4%) |
| 4-Person Households | 124 (5.3%) | 0 (0.0%) |
| 5-Person Households | 109 (4.6%) | 0 (0.0%) |
| 6-Person Households | 0 (0.0%) | 0 (0.0%) |
| 7+ Person Households | 0 (0.0%) | 0 (0.0%) |
| Total | 1,487 (63.3%) | 861 (36.7%) |
Female Fertility in Horseshoe Bay
Fertility by Age in Horseshoe Bay
| Age Bracket | Women with Births | Births / 1,000 Women |
| 15 to 19 years | 0 (0.0%) | 0.0 |
| 20 to 34 years | 0 (0.0%) | 0.0 |
| 35 to 50 years | 0 (0.0%) | 0.0 |
| Total | 0 (0.0%) | 0.0 |
Fertility by Age by Marriage Status in Horseshoe Bay
| Age Bracket | Married | Unmarried |
| 15 to 19 years | 0 (0.0%) | 0 (0.0%) |
| 20 to 34 years | 0 (0.0%) | 0 (0.0%) |
| 35 to 50 years | 0 (0.0%) | 0 (0.0%) |
| Total | 0 (0.0%) | 0 (0.0%) |
Fertility by Education in Horseshoe Bay
| Educational Attainment | Women with Births | Births / 1,000 Women |
| Less than High School | 0 (0.0%) | 0.0 |
| High School Diploma | 0 (0.0%) | 0.0 |
| College or Associate's Degree | 0 (0.0%) | 0.0 |
| Bachelor's Degree | 0 (0.0%) | 0.0 |
| Graduate Degree | 0 (0.0%) | 0.0 |
| Total | 0 (0.0%) | 0.0 |
Fertility by Education by Marriage Status in Horseshoe Bay
| Educational Attainment | Married | Unmarried |
| Less than High School | 0 (0.0%) | 0 (0.0%) |
| High School Diploma | 0 (0.0%) | 0 (0.0%) |
| College or Associate's Degree | 0 (0.0%) | 0 (0.0%) |
| Bachelor's Degree | 0 (0.0%) | 0 (0.0%) |
| Graduate Degree | 0 (0.0%) | 0 (0.0%) |
| Total | 0 (0.0%) | 0 (0.0%) |
Employment Characteristics in Horseshoe Bay
Employment by Class of Employer in Horseshoe Bay
Among the 1,741 employed individuals in Horseshoe Bay, private company employees (1,095 | 62.9%), self-employed (not incorporated) (207 | 11.9%), and self-employed (incorporated) (175 | 10.1%) make up the most common classes of employment.
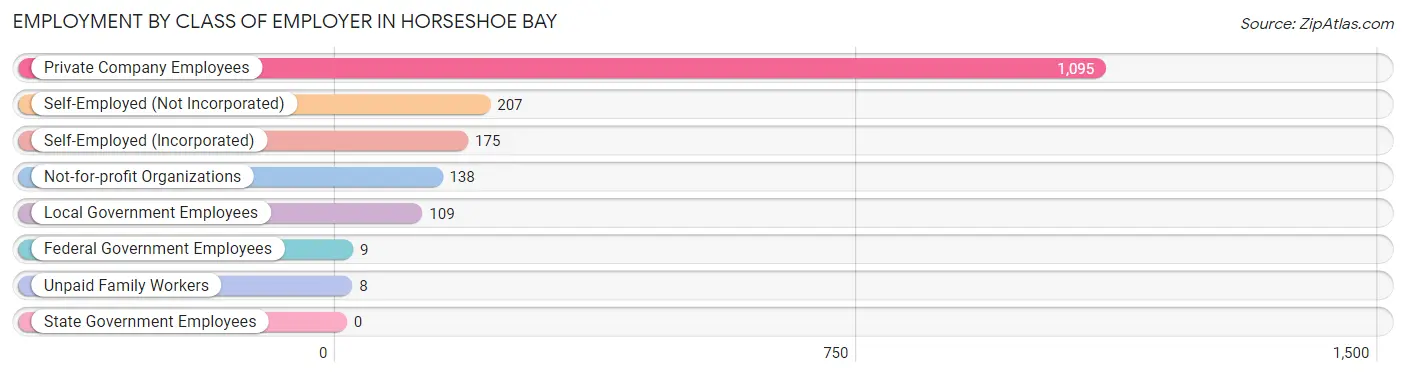
| Employer Class | # Employees | % Employees |
| Private Company Employees | 1,095 | 62.9% |
| Self-Employed (Incorporated) | 175 | 10.1% |
| Self-Employed (Not Incorporated) | 207 | 11.9% |
| Not-for-profit Organizations | 138 | 7.9% |
| Local Government Employees | 109 | 6.3% |
| State Government Employees | 0 | 0.0% |
| Federal Government Employees | 9 | 0.5% |
| Unpaid Family Workers | 8 | 0.5% |
| Total | 1,741 | 100.0% |
Employment Status by Age in Horseshoe Bay
According to the labor force statistics for Horseshoe Bay, out of the total population over 16 years of age (4,194), 43.6% or 1,829 individuals are in the labor force, with 3.5% or 64 of them unemployed. The age group with the highest labor force participation rate is 45 to 54 years, with 92.7% or 429 individuals in the labor force. Within the labor force, the 16 to 19 years age range has the highest percentage of unemployed individuals, with 25.9% or 14 of them being unemployed.
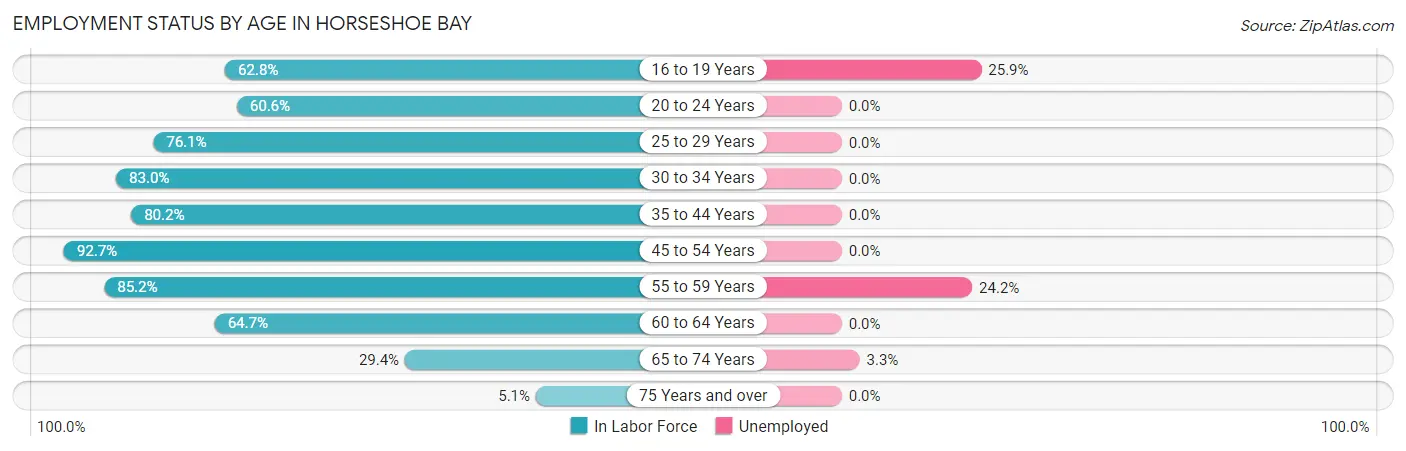
| Age Bracket | In Labor Force | Unemployed |
| 16 to 19 Years | 54 (62.8%) | 14 (25.9%) |
| 20 to 24 Years | 60 (60.6%) | 0 (0.0%) |
| 25 to 29 Years | 70 (76.1%) | 0 (0.0%) |
| 30 to 34 Years | 44 (83.0%) | 0 (0.0%) |
| 35 to 44 Years | 292 (80.2%) | 0 (0.0%) |
| 45 to 54 Years | 429 (92.7%) | 0 (0.0%) |
| 55 to 59 Years | 161 (85.2%) | 39 (24.2%) |
| 60 to 64 Years | 323 (64.7%) | 0 (0.0%) |
| 65 to 74 Years | 336 (29.4%) | 11 (3.3%) |
| 75 Years and over | 62 (5.1%) | 0 (0.0%) |
| Total | 1,829 (43.6%) | 64 (3.5%) |
Employment Status by Educational Attainment in Horseshoe Bay
According to labor force statistics for Horseshoe Bay, 79.5% of individuals (1,320) out of the total population between 25 and 64 years of age (1,660) are in the labor force, with 3.0% or 40 of them being unemployed. The group with the highest labor force participation rate are those with the educational attainment of less than high school, with 95.0% or 207 individuals in the labor force. Within the labor force, individuals with college / associate degree education have the highest percentage of unemployment, with 8.5% or 39 of them being unemployed.
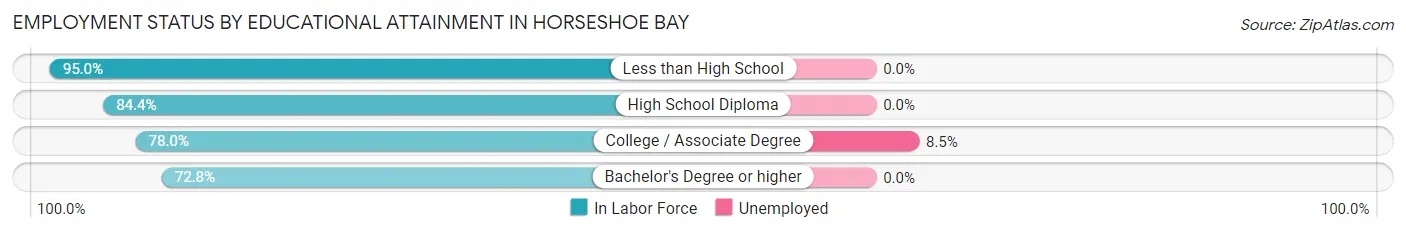
| Educational Attainment | In Labor Force | Unemployed |
| Less than High School | 207 (95.0%) | 0 (0.0%) |
| High School Diploma | 232 (84.4%) | 0 (0.0%) |
| College / Associate Degree | 458 (78.0%) | 50 (8.5%) |
| Bachelor's Degree or higher | 422 (72.8%) | 0 (0.0%) |
| Total | 1,320 (79.5%) | 50 (3.0%) |
Employment Occupations by Sex in Horseshoe Bay
Management, Business, Science and Arts Occupations
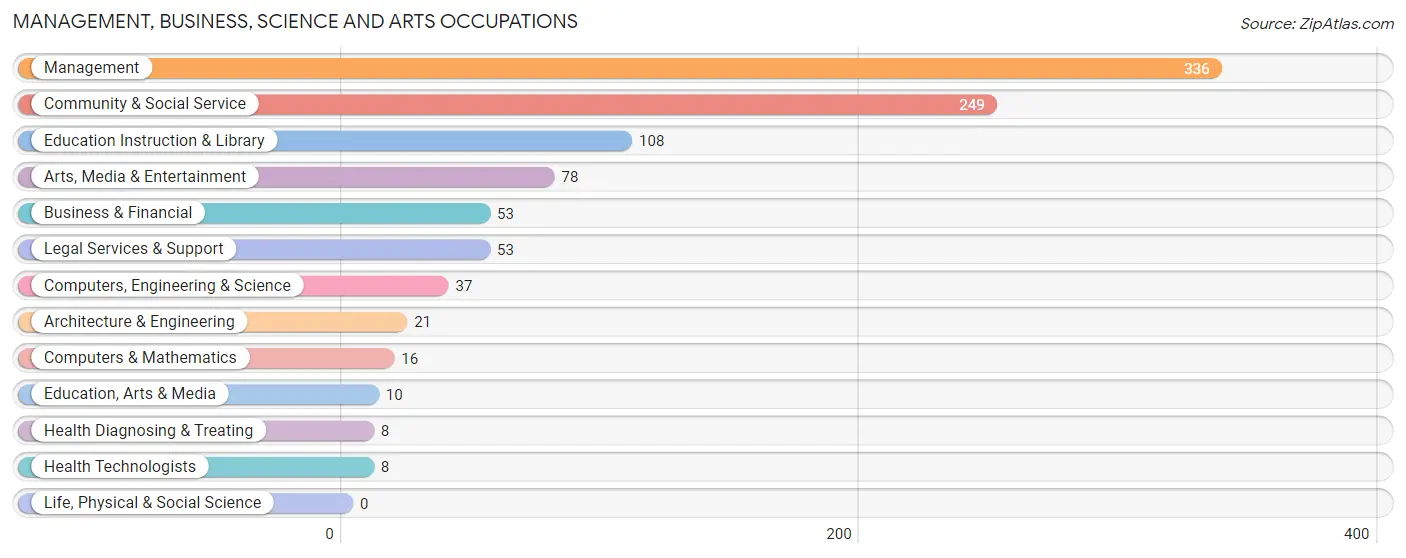
The most common Management, Business, Science and Arts occupations in Horseshoe Bay are Management (336 | 19.0%), Community & Social Service (249 | 14.1%), Education Instruction & Library (108 | 6.1%), Arts, Media & Entertainment (78 | 4.4%), and Business & Financial (53 | 3.0%).
Management, Business, Science and Arts Occupations by Sex
Within the Management, Business, Science and Arts occupations in Horseshoe Bay, the most male-oriented occupations are Architecture & Engineering (100.0%), Education, Arts & Media (100.0%), and Legal Services & Support (100.0%), while the most female-oriented occupations are Health Diagnosing & Treating (100.0%), Health Technologists (100.0%), and Education Instruction & Library (91.7%).
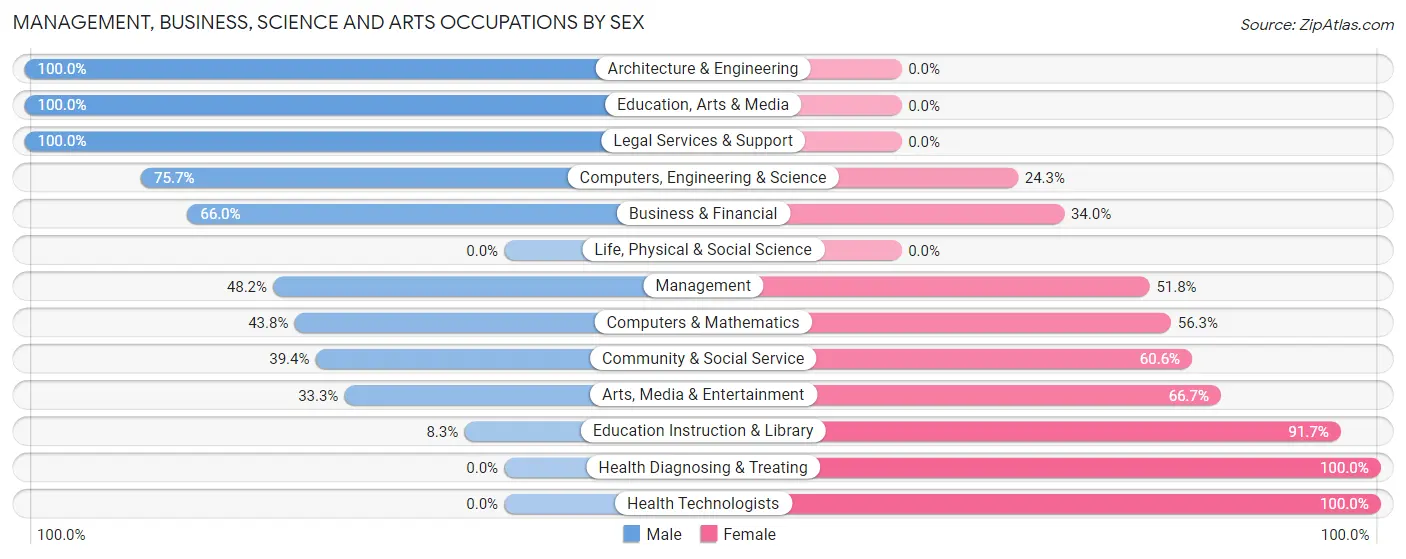
| Occupation | Male | Female |
| Management | 162 (48.2%) | 174 (51.8%) |
| Business & Financial | 35 (66.0%) | 18 (34.0%) |
| Computers, Engineering & Science | 28 (75.7%) | 9 (24.3%) |
| Computers & Mathematics | 7 (43.8%) | 9 (56.2%) |
| Architecture & Engineering | 21 (100.0%) | 0 (0.0%) |
| Life, Physical & Social Science | 0 (0.0%) | 0 (0.0%) |
| Community & Social Service | 98 (39.4%) | 151 (60.6%) |
| Education, Arts & Media | 10 (100.0%) | 0 (0.0%) |
| Legal Services & Support | 53 (100.0%) | 0 (0.0%) |
| Education Instruction & Library | 9 (8.3%) | 99 (91.7%) |
| Arts, Media & Entertainment | 26 (33.3%) | 52 (66.7%) |
| Health Diagnosing & Treating | 0 (0.0%) | 8 (100.0%) |
| Health Technologists | 0 (0.0%) | 8 (100.0%) |
| Total (Category) | 323 (47.3%) | 360 (52.7%) |
| Total (Overall) | 868 (49.1%) | 898 (50.8%) |
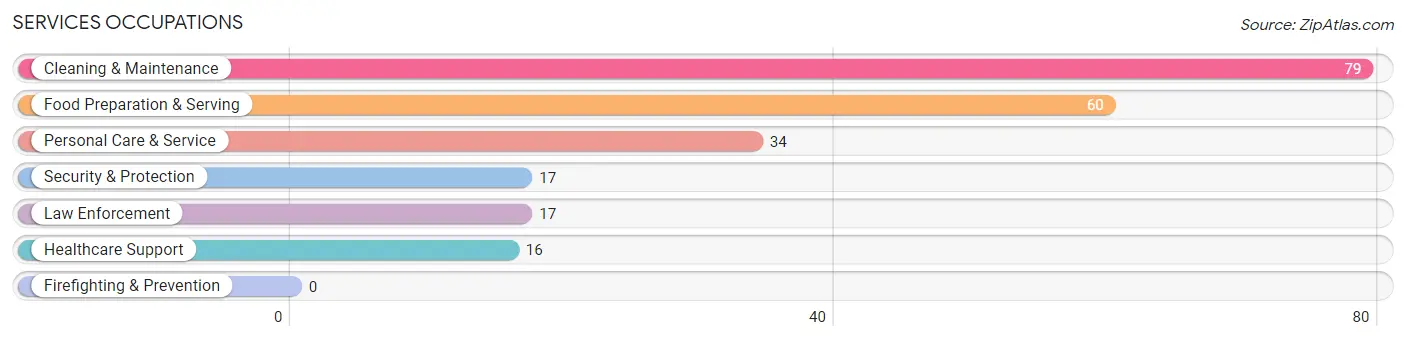
Services Occupations
The most common Services occupations in Horseshoe Bay are Cleaning & Maintenance (79 | 4.5%), Food Preparation & Serving (60 | 3.4%), Personal Care & Service (34 | 1.9%), Security & Protection (17 | 1.0%), and Law Enforcement (17 | 1.0%).
Services Occupations by Sex
Within the Services occupations in Horseshoe Bay, the most male-oriented occupations are Security & Protection (100.0%), Law Enforcement (100.0%), and Food Preparation & Serving (56.7%), while the most female-oriented occupations are Healthcare Support (100.0%), Cleaning & Maintenance (100.0%), and Personal Care & Service (100.0%).
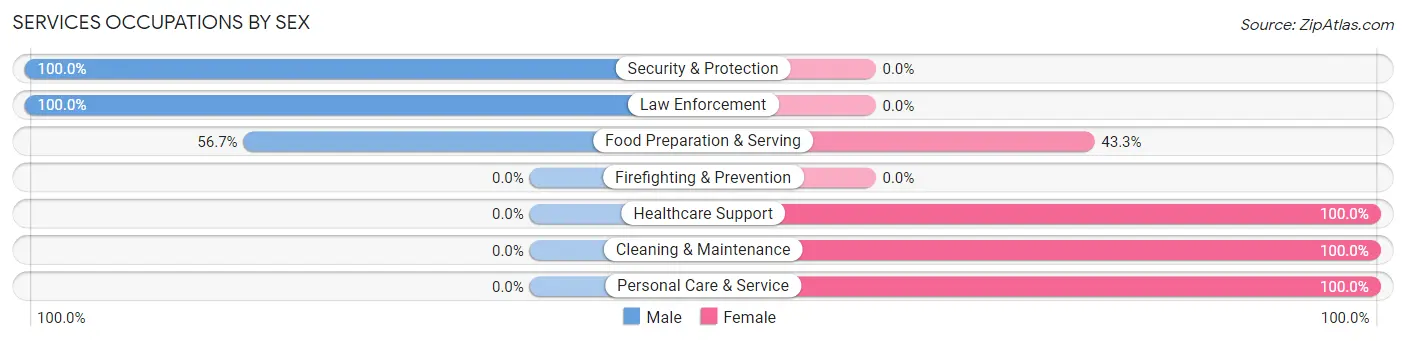
| Occupation | Male | Female |
| Healthcare Support | 0 (0.0%) | 16 (100.0%) |
| Security & Protection | 17 (100.0%) | 0 (0.0%) |
| Firefighting & Prevention | 0 (0.0%) | 0 (0.0%) |
| Law Enforcement | 17 (100.0%) | 0 (0.0%) |
| Food Preparation & Serving | 34 (56.7%) | 26 (43.3%) |
| Cleaning & Maintenance | 0 (0.0%) | 79 (100.0%) |
| Personal Care & Service | 0 (0.0%) | 34 (100.0%) |
| Total (Category) | 51 (24.8%) | 155 (75.2%) |
| Total (Overall) | 868 (49.1%) | 898 (50.8%) |
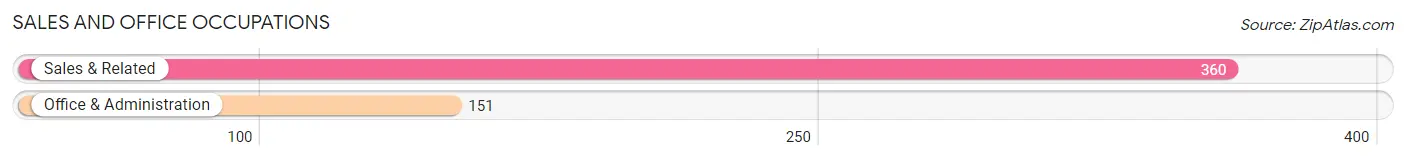
Sales and Office Occupations
The most common Sales and Office occupations in Horseshoe Bay are Sales & Related (360 | 20.4%), and Office & Administration (151 | 8.6%).
Sales and Office Occupations by Sex
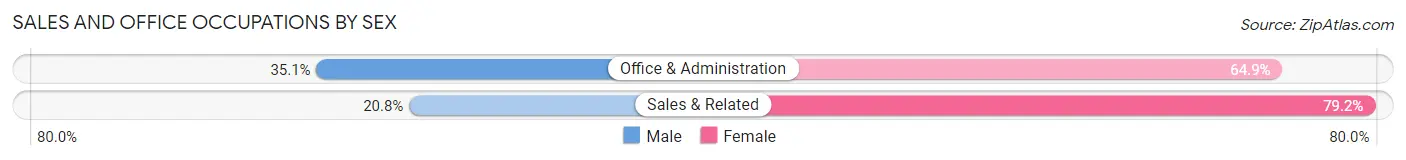
| Occupation | Male | Female |
| Sales & Related | 75 (20.8%) | 285 (79.2%) |
| Office & Administration | 53 (35.1%) | 98 (64.9%) |
| Total (Category) | 128 (25.1%) | 383 (75.0%) |
| Total (Overall) | 868 (49.1%) | 898 (50.8%) |
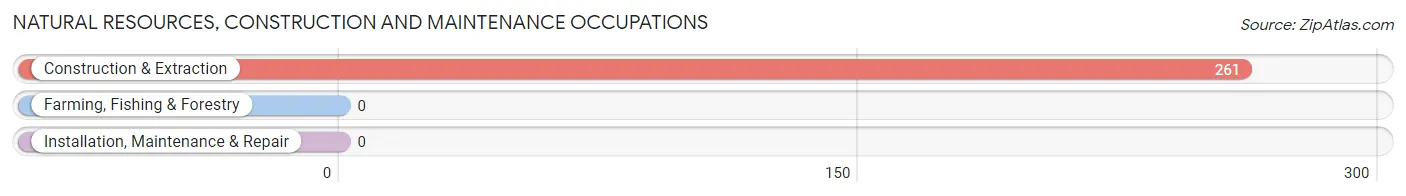
Natural Resources, Construction and Maintenance Occupations
The most common Natural Resources, Construction and Maintenance occupations in Horseshoe Bay are , and Construction & Extraction (261 | 14.8%).
Natural Resources, Construction and Maintenance Occupations by Sex
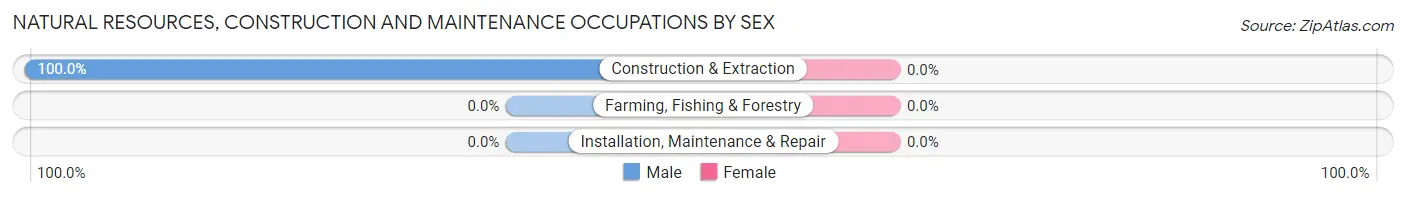
| Occupation | Male | Female |
| Farming, Fishing & Forestry | 0 (0.0%) | 0 (0.0%) |
| Construction & Extraction | 261 (100.0%) | 0 (0.0%) |
| Installation, Maintenance & Repair | 0 (0.0%) | 0 (0.0%) |
| Total (Category) | 261 (100.0%) | 0 (0.0%) |
| Total (Overall) | 868 (49.1%) | 898 (50.8%) |
Production, Transportation and Moving Occupations
The most common Production, Transportation and Moving occupations in Horseshoe Bay are Transportation (78 | 4.4%), Material Moving (18 | 1.0%), and Production (9 | 0.5%).
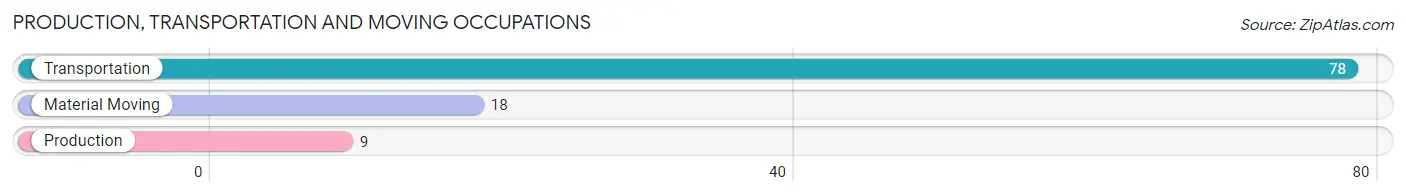
Production, Transportation and Moving Occupations by Sex
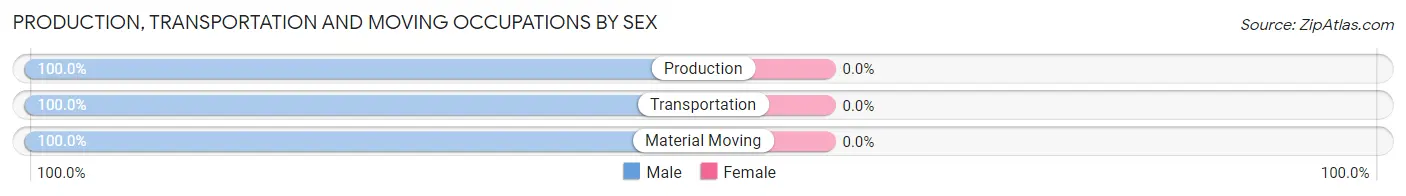
| Occupation | Male | Female |
| Production | 9 (100.0%) | 0 (0.0%) |
| Transportation | 78 (100.0%) | 0 (0.0%) |
| Material Moving | 18 (100.0%) | 0 (0.0%) |
| Total (Category) | 105 (100.0%) | 0 (0.0%) |
| Total (Overall) | 868 (49.1%) | 898 (50.8%) |
Employment Industries by Sex in Horseshoe Bay
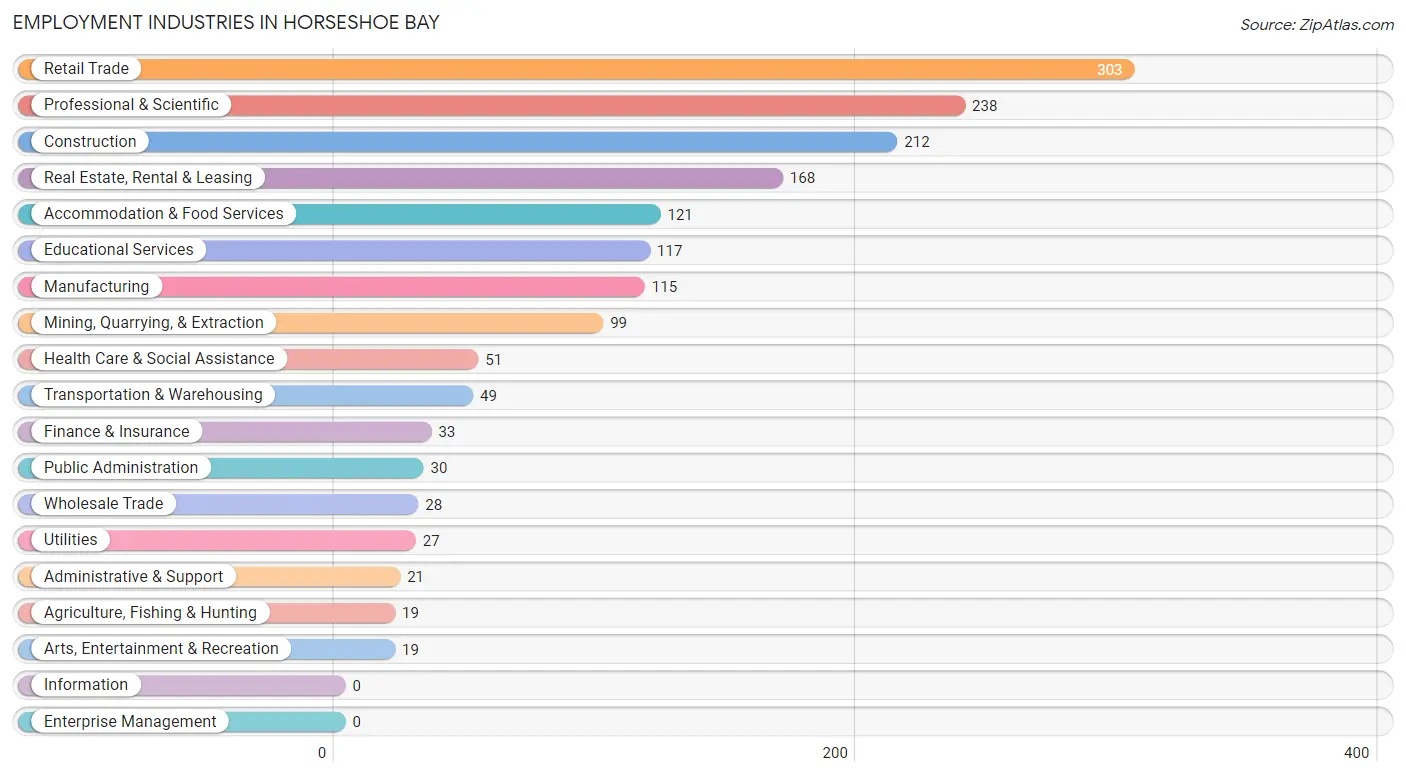
Employment Industries in Horseshoe Bay
The major employment industries in Horseshoe Bay include Retail Trade (303 | 17.2%), Professional & Scientific (238 | 13.5%), Construction (212 | 12.0%), Real Estate, Rental & Leasing (168 | 9.5%), and Accommodation & Food Services (121 | 6.9%).
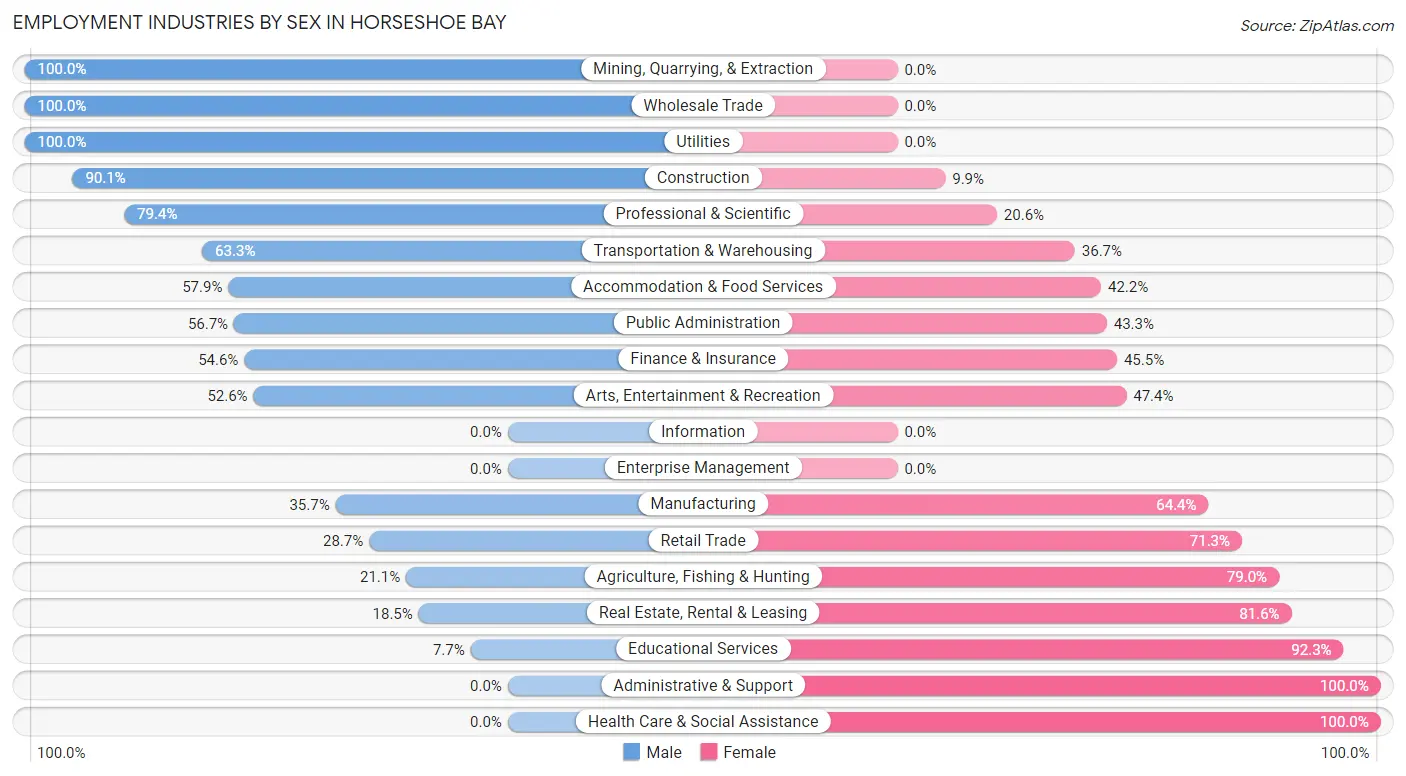
Employment Industries by Sex in Horseshoe Bay
The Horseshoe Bay industries that see more men than women are Mining, Quarrying, & Extraction (100.0%), Wholesale Trade (100.0%), and Utilities (100.0%), whereas the industries that tend to have a higher number of women are Administrative & Support (100.0%), Health Care & Social Assistance (100.0%), and Educational Services (92.3%).
| Industry | Male | Female |
| Agriculture, Fishing & Hunting | 4 (21.0%) | 15 (78.9%) |
| Mining, Quarrying, & Extraction | 99 (100.0%) | 0 (0.0%) |
| Construction | 191 (90.1%) | 21 (9.9%) |
| Manufacturing | 41 (35.6%) | 74 (64.3%) |
| Wholesale Trade | 28 (100.0%) | 0 (0.0%) |
| Retail Trade | 87 (28.7%) | 216 (71.3%) |
| Transportation & Warehousing | 31 (63.3%) | 18 (36.7%) |
| Utilities | 27 (100.0%) | 0 (0.0%) |
| Information | 0 (0.0%) | 0 (0.0%) |
| Finance & Insurance | 18 (54.5%) | 15 (45.5%) |
| Real Estate, Rental & Leasing | 31 (18.4%) | 137 (81.6%) |
| Professional & Scientific | 189 (79.4%) | 49 (20.6%) |
| Enterprise Management | 0 (0.0%) | 0 (0.0%) |
| Administrative & Support | 0 (0.0%) | 21 (100.0%) |
| Educational Services | 9 (7.7%) | 108 (92.3%) |
| Health Care & Social Assistance | 0 (0.0%) | 51 (100.0%) |
| Arts, Entertainment & Recreation | 10 (52.6%) | 9 (47.4%) |
| Accommodation & Food Services | 70 (57.9%) | 51 (42.1%) |
| Public Administration | 17 (56.7%) | 13 (43.3%) |
| Total | 868 (49.1%) | 898 (50.8%) |
Education in Horseshoe Bay
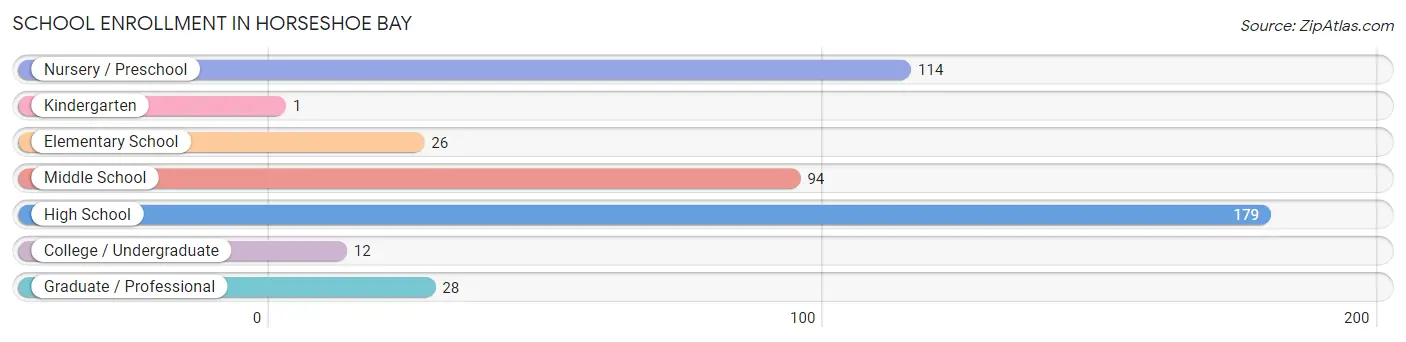
School Enrollment in Horseshoe Bay
The most common levels of schooling among the 454 students in Horseshoe Bay are high school (179 | 39.4%), nursery / preschool (114 | 25.1%), and middle school (94 | 20.7%).
| School Level | # Students | % Students |
| Nursery / Preschool | 114 | 25.1% |
| Kindergarten | 1 | 0.2% |
| Elementary School | 26 | 5.7% |
| Middle School | 94 | 20.7% |
| High School | 179 | 39.4% |
| College / Undergraduate | 12 | 2.6% |
| Graduate / Professional | 28 | 6.2% |
| Total | 454 | 100.0% |
School Enrollment by Age by Funding Source in Horseshoe Bay
Out of a total of 454 students who are enrolled in schools in Horseshoe Bay, 140 (30.8%) attend a private institution, while the remaining 314 (69.2%) are enrolled in public schools. The age group of 5 to 9 year old has the highest likelihood of being enrolled in private schools, with 26 (61.9% in the age bracket) enrolled. Conversely, the age group of 10 to 14 year olds has the lowest likelihood of being enrolled in a private school, with 111 (100.0% in the age bracket) attending a public institution.
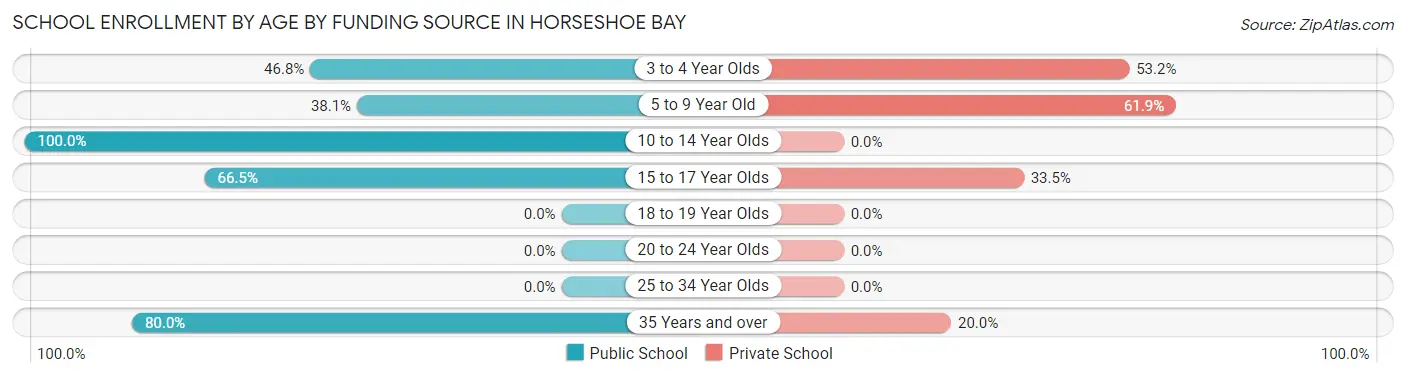
| Age Bracket | Public School | Private School |
| 3 to 4 Year Olds | 44 (46.8%) | 50 (53.2%) |
| 5 to 9 Year Old | 16 (38.1%) | 26 (61.9%) |
| 10 to 14 Year Olds | 111 (100.0%) | 0 (0.0%) |
| 15 to 17 Year Olds | 111 (66.5%) | 56 (33.5%) |
| 18 to 19 Year Olds | 0 (0.0%) | 0 (0.0%) |
| 20 to 24 Year Olds | 0 (0.0%) | 0 (0.0%) |
| 25 to 34 Year Olds | 0 (0.0%) | 0 (0.0%) |
| 35 Years and over | 32 (80.0%) | 8 (20.0%) |
| Total | 314 (69.2%) | 140 (30.8%) |
Educational Attainment by Field of Study in Horseshoe Bay
Business (842 | 42.2%), education (245 | 12.3%), communications (125 | 6.3%), social sciences (119 | 6.0%), and engineering (113 | 5.7%) are the most common fields of study among 1,997 individuals in Horseshoe Bay who have obtained a bachelor's degree or higher.
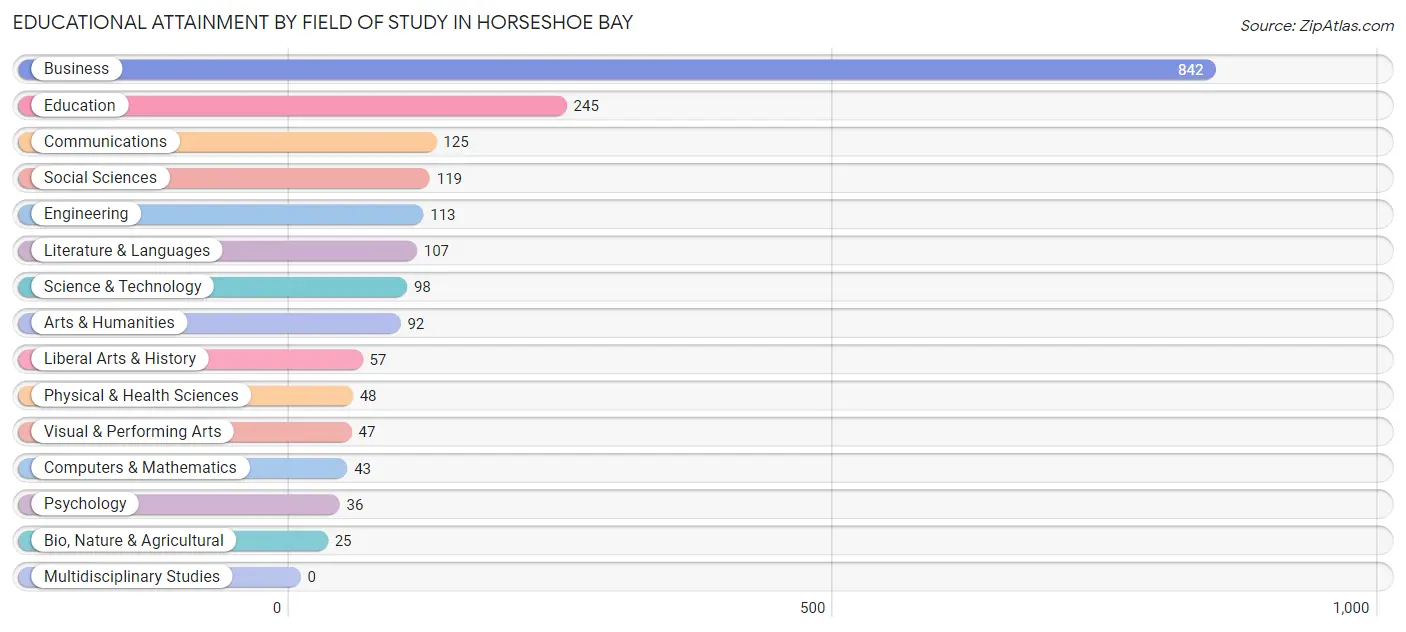
| Field of Study | # Graduates | % Graduates |
| Computers & Mathematics | 43 | 2.1% |
| Bio, Nature & Agricultural | 25 | 1.3% |
| Physical & Health Sciences | 48 | 2.4% |
| Psychology | 36 | 1.8% |
| Social Sciences | 119 | 6.0% |
| Engineering | 113 | 5.7% |
| Multidisciplinary Studies | 0 | 0.0% |
| Science & Technology | 98 | 4.9% |
| Business | 842 | 42.2% |
| Education | 245 | 12.3% |
| Literature & Languages | 107 | 5.4% |
| Liberal Arts & History | 57 | 2.9% |
| Visual & Performing Arts | 47 | 2.4% |
| Communications | 125 | 6.3% |
| Arts & Humanities | 92 | 4.6% |
| Total | 1,997 | 100.0% |
Transportation & Commute in Horseshoe Bay
Vehicle Availability by Sex in Horseshoe Bay
The most prevalent vehicle ownership categories in Horseshoe Bay are males with 2 vehicles (284, accounting for 33.7%) and females with 2 vehicles (297, making up 31.6%).
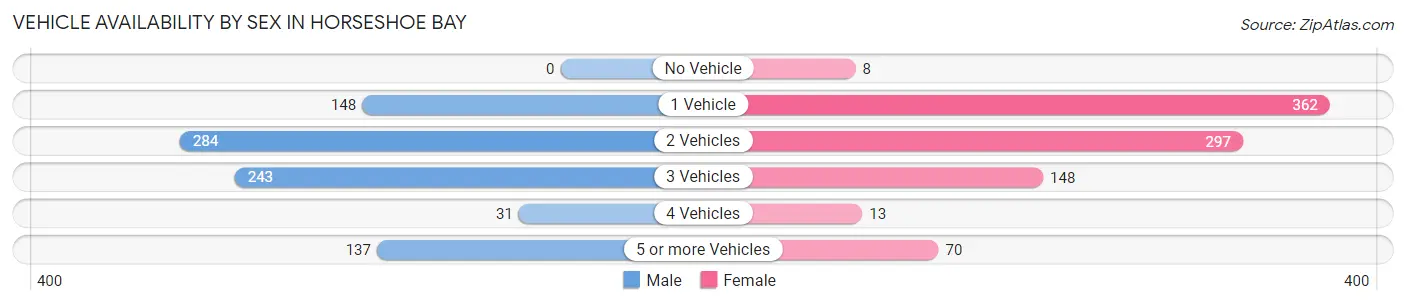
| Vehicles Available | Male | Female |
| No Vehicle | 0 (0.0%) | 8 (0.9%) |
| 1 Vehicle | 148 (17.6%) | 362 (40.3%) |
| 2 Vehicles | 284 (33.7%) | 297 (33.1%) |
| 3 Vehicles | 243 (28.8%) | 148 (16.5%) |
| 4 Vehicles | 31 (3.7%) | 13 (1.5%) |
| 5 or more Vehicles | 137 (16.3%) | 70 (7.8%) |
| Total | 843 (100.0%) | 898 (100.0%) |
Commute Time in Horseshoe Bay
The most frequently occuring commute durations in Horseshoe Bay are 20 to 24 minutes (226 commuters, 15.7%), 15 to 19 minutes (221 commuters, 15.4%), and 10 to 14 minutes (212 commuters, 14.7%).
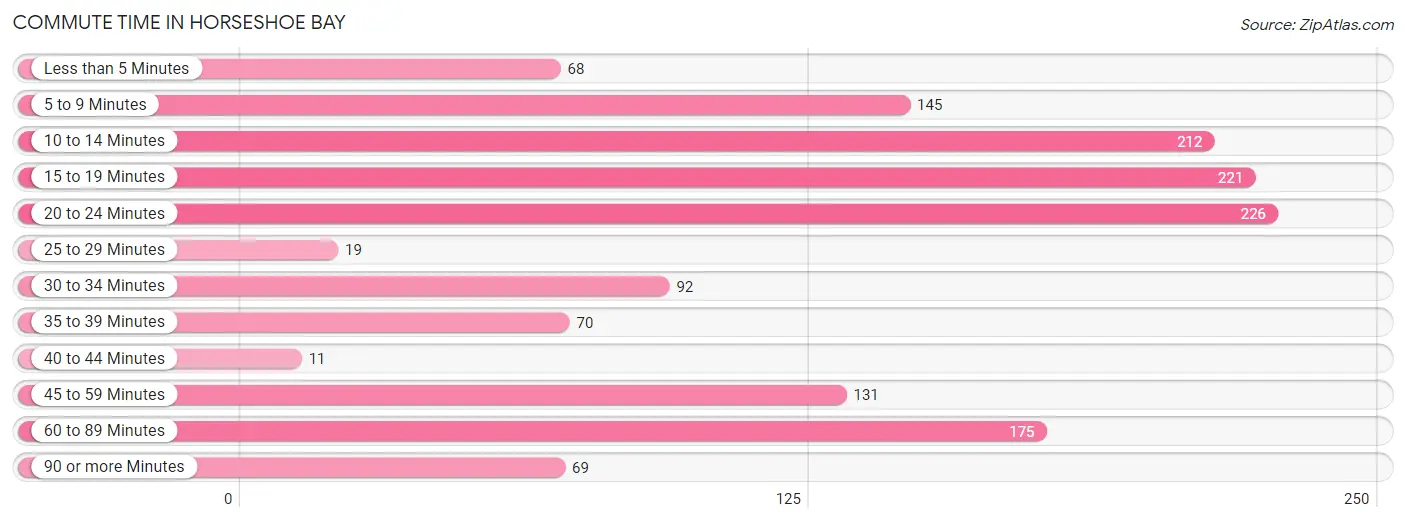
| Commute Time | # Commuters | % Commuters |
| Less than 5 Minutes | 68 | 4.7% |
| 5 to 9 Minutes | 145 | 10.1% |
| 10 to 14 Minutes | 212 | 14.7% |
| 15 to 19 Minutes | 221 | 15.4% |
| 20 to 24 Minutes | 226 | 15.7% |
| 25 to 29 Minutes | 19 | 1.3% |
| 30 to 34 Minutes | 92 | 6.4% |
| 35 to 39 Minutes | 70 | 4.9% |
| 40 to 44 Minutes | 11 | 0.8% |
| 45 to 59 Minutes | 131 | 9.1% |
| 60 to 89 Minutes | 175 | 12.2% |
| 90 or more Minutes | 69 | 4.8% |
Commute Time by Sex in Horseshoe Bay
The most common commute times in Horseshoe Bay are 60 to 89 minutes (122 commuters, 17.4%) for males and 10 to 14 minutes (161 commuters, 21.8%) for females.
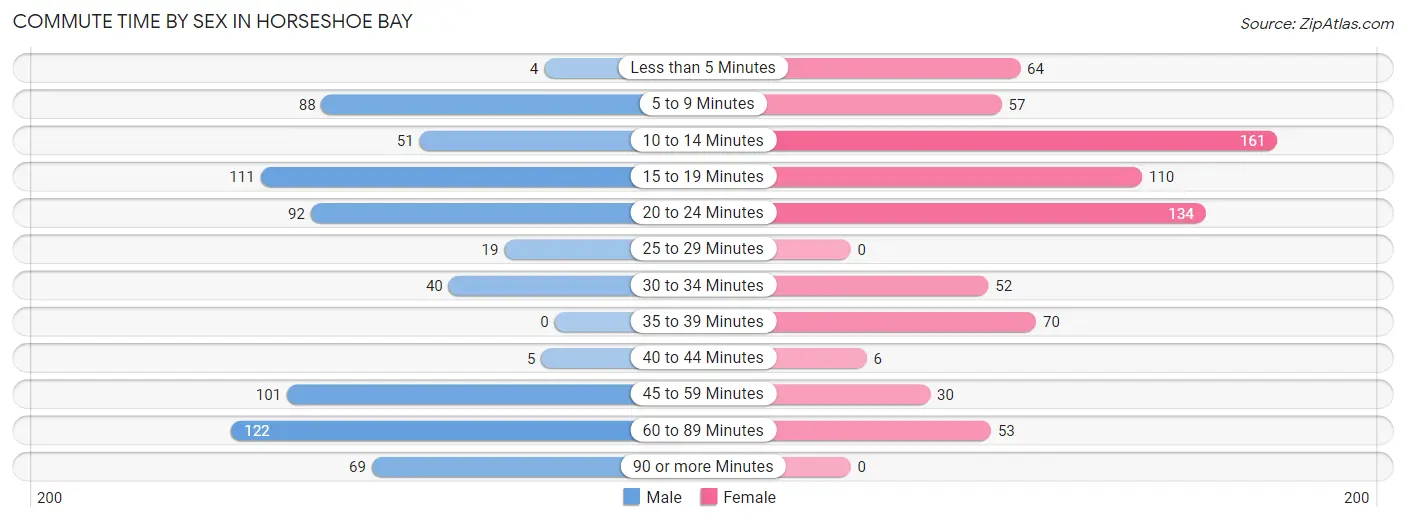
| Commute Time | Male | Female |
| Less than 5 Minutes | 4 (0.6%) | 64 (8.7%) |
| 5 to 9 Minutes | 88 (12.5%) | 57 (7.7%) |
| 10 to 14 Minutes | 51 (7.3%) | 161 (21.8%) |
| 15 to 19 Minutes | 111 (15.8%) | 110 (14.9%) |
| 20 to 24 Minutes | 92 (13.1%) | 134 (18.2%) |
| 25 to 29 Minutes | 19 (2.7%) | 0 (0.0%) |
| 30 to 34 Minutes | 40 (5.7%) | 52 (7.1%) |
| 35 to 39 Minutes | 0 (0.0%) | 70 (9.5%) |
| 40 to 44 Minutes | 5 (0.7%) | 6 (0.8%) |
| 45 to 59 Minutes | 101 (14.4%) | 30 (4.1%) |
| 60 to 89 Minutes | 122 (17.4%) | 53 (7.2%) |
| 90 or more Minutes | 69 (9.8%) | 0 (0.0%) |
Time of Departure to Work by Sex in Horseshoe Bay
The most frequent times of departure to work in Horseshoe Bay are 8:00 AM to 8:29 AM (129, 18.4%) for males and 9:00 AM to 9:59 AM (181, 24.6%) for females.
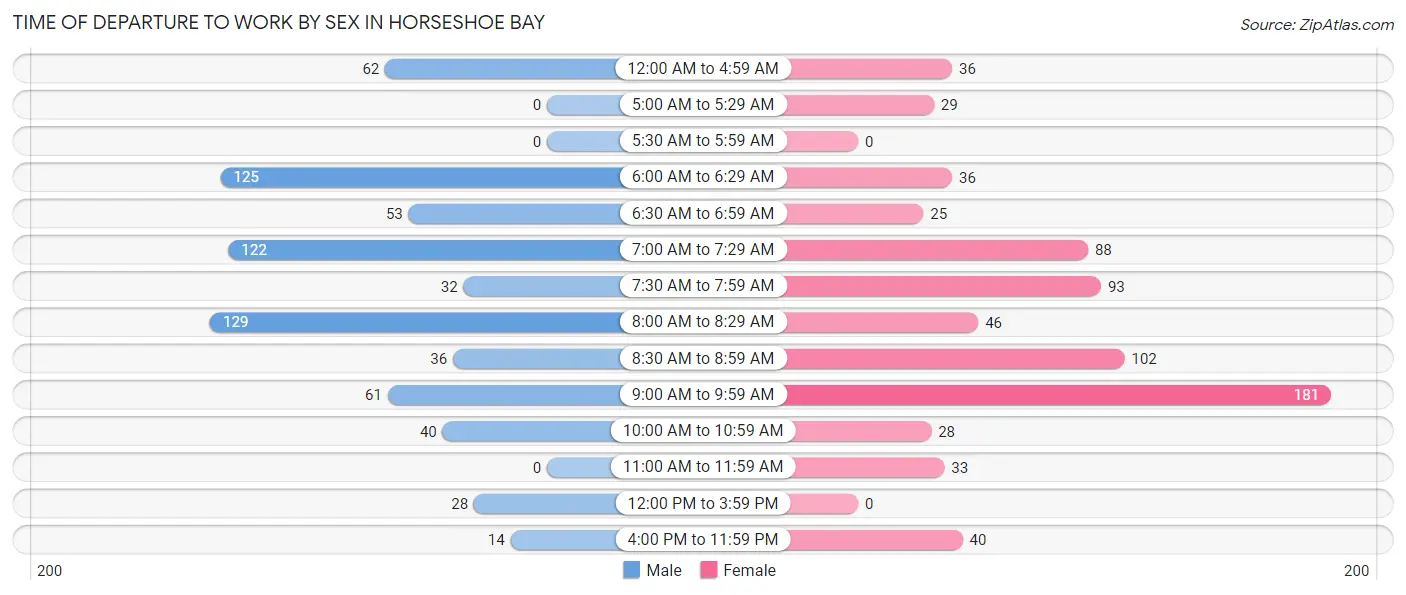
| Time of Departure | Male | Female |
| 12:00 AM to 4:59 AM | 62 (8.8%) | 36 (4.9%) |
| 5:00 AM to 5:29 AM | 0 (0.0%) | 29 (3.9%) |
| 5:30 AM to 5:59 AM | 0 (0.0%) | 0 (0.0%) |
| 6:00 AM to 6:29 AM | 125 (17.8%) | 36 (4.9%) |
| 6:30 AM to 6:59 AM | 53 (7.5%) | 25 (3.4%) |
| 7:00 AM to 7:29 AM | 122 (17.4%) | 88 (11.9%) |
| 7:30 AM to 7:59 AM | 32 (4.6%) | 93 (12.6%) |
| 8:00 AM to 8:29 AM | 129 (18.4%) | 46 (6.2%) |
| 8:30 AM to 8:59 AM | 36 (5.1%) | 102 (13.8%) |
| 9:00 AM to 9:59 AM | 61 (8.7%) | 181 (24.6%) |
| 10:00 AM to 10:59 AM | 40 (5.7%) | 28 (3.8%) |
| 11:00 AM to 11:59 AM | 0 (0.0%) | 33 (4.5%) |
| 12:00 PM to 3:59 PM | 28 (4.0%) | 0 (0.0%) |
| 4:00 PM to 11:59 PM | 14 (2.0%) | 40 (5.4%) |
| Total | 702 (100.0%) | 737 (100.0%) |
Housing Occupancy in Horseshoe Bay
Occupancy by Ownership in Horseshoe Bay
Of the total 2,348 dwellings in Horseshoe Bay, owner-occupied units account for 2,034 (86.6%), while renter-occupied units make up 314 (13.4%).
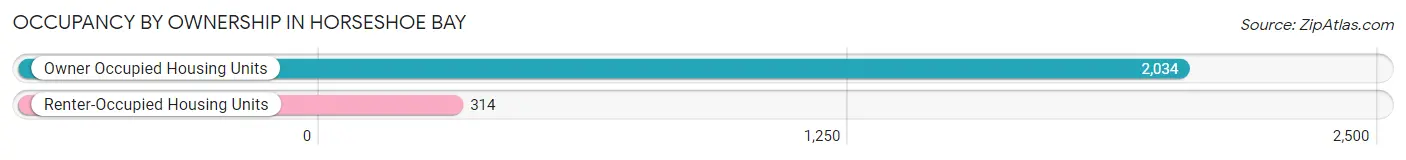
| Occupancy | # Housing Units | % Housing Units |
| Owner Occupied Housing Units | 2,034 | 86.6% |
| Renter-Occupied Housing Units | 314 | 13.4% |
| Total Occupied Housing Units | 2,348 | 100.0% |
Occupancy by Household Size in Horseshoe Bay
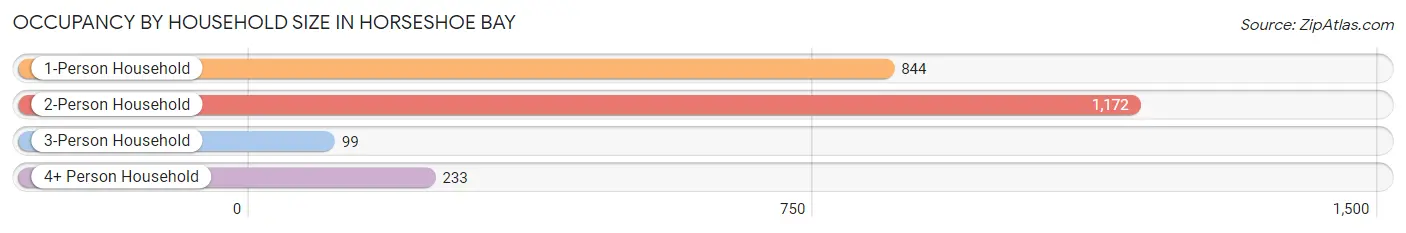
| Household Size | # Housing Units | % Housing Units |
| 1-Person Household | 844 | 35.9% |
| 2-Person Household | 1,172 | 49.9% |
| 3-Person Household | 99 | 4.2% |
| 4+ Person Household | 233 | 9.9% |
| Total Housing Units | 2,348 | 100.0% |
Occupancy by Ownership by Household Size in Horseshoe Bay
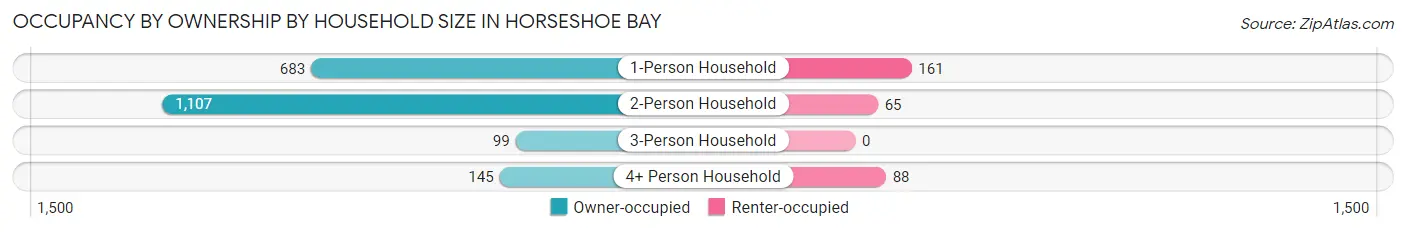
| Household Size | Owner-occupied | Renter-occupied |
| 1-Person Household | 683 (80.9%) | 161 (19.1%) |
| 2-Person Household | 1,107 (94.5%) | 65 (5.6%) |
| 3-Person Household | 99 (100.0%) | 0 (0.0%) |
| 4+ Person Household | 145 (62.2%) | 88 (37.8%) |
| Total Housing Units | 2,034 (86.6%) | 314 (13.4%) |
Occupancy by Educational Attainment in Horseshoe Bay
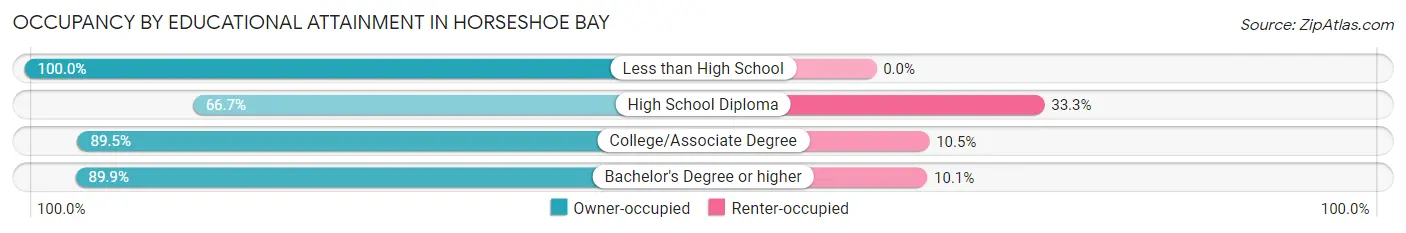
| Household Size | Owner-occupied | Renter-occupied |
| Less than High School | 82 (100.0%) | 0 (0.0%) |
| High School Diploma | 234 (66.7%) | 117 (33.3%) |
| College/Associate Degree | 775 (89.5%) | 91 (10.5%) |
| Bachelor's Degree or higher | 943 (89.9%) | 106 (10.1%) |
Occupancy by Age of Householder in Horseshoe Bay
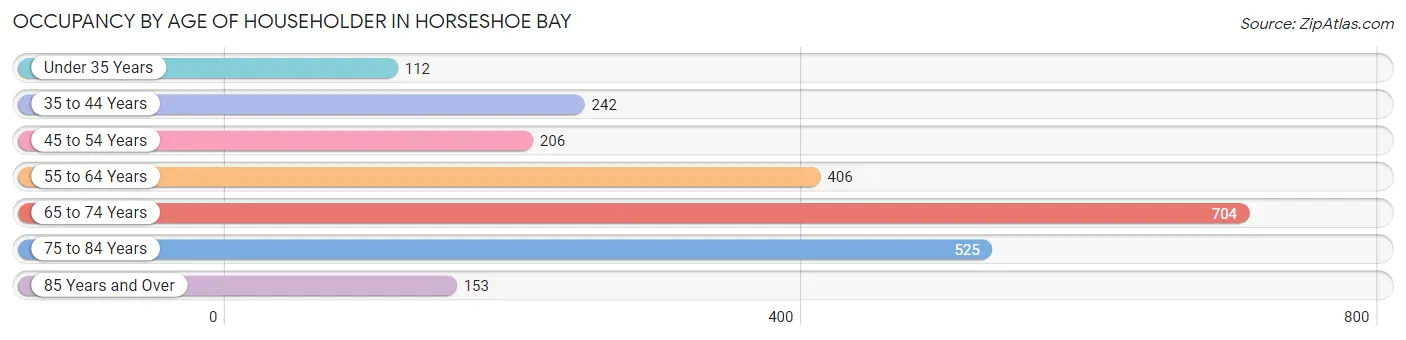
| Age Bracket | # Households | % Households |
| Under 35 Years | 112 | 4.8% |
| 35 to 44 Years | 242 | 10.3% |
| 45 to 54 Years | 206 | 8.8% |
| 55 to 64 Years | 406 | 17.3% |
| 65 to 74 Years | 704 | 30.0% |
| 75 to 84 Years | 525 | 22.4% |
| 85 Years and Over | 153 | 6.5% |
| Total | 2,348 | 100.0% |
Housing Finances in Horseshoe Bay
Median Income by Occupancy in Horseshoe Bay
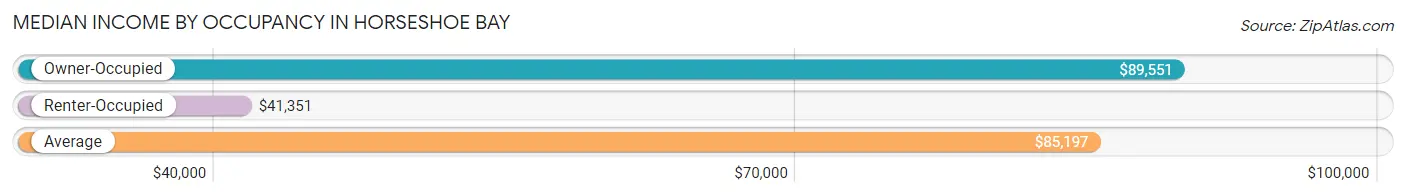
| Occupancy Type | # Households | Median Income |
| Owner-Occupied | 2,034 (86.6%) | $89,551 |
| Renter-Occupied | 314 (13.4%) | $41,351 |
| Average | 2,348 (100.0%) | $85,197 |
Occupancy by Householder Income Bracket in Horseshoe Bay
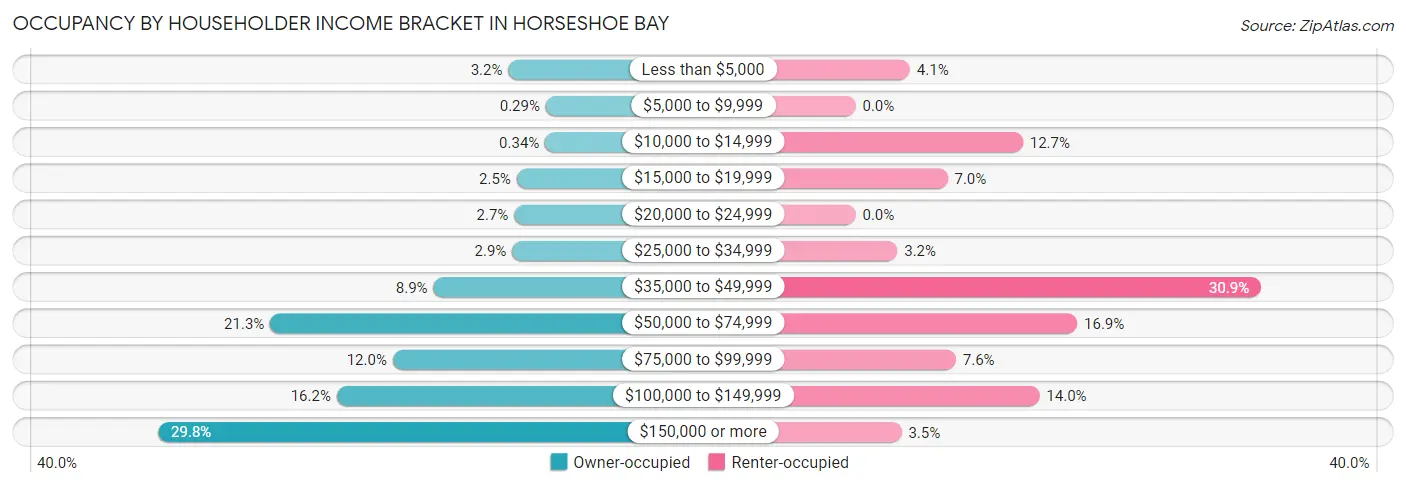
| Income Bracket | Owner-occupied | Renter-occupied |
| Less than $5,000 | 64 (3.2%) | 13 (4.1%) |
| $5,000 to $9,999 | 6 (0.3%) | 0 (0.0%) |
| $10,000 to $14,999 | 7 (0.3%) | 40 (12.7%) |
| $15,000 to $19,999 | 51 (2.5%) | 22 (7.0%) |
| $20,000 to $24,999 | 55 (2.7%) | 0 (0.0%) |
| $25,000 to $34,999 | 58 (2.9%) | 10 (3.2%) |
| $35,000 to $49,999 | 180 (8.8%) | 97 (30.9%) |
| $50,000 to $74,999 | 433 (21.3%) | 53 (16.9%) |
| $75,000 to $99,999 | 243 (11.9%) | 24 (7.6%) |
| $100,000 to $149,999 | 330 (16.2%) | 44 (14.0%) |
| $150,000 or more | 607 (29.8%) | 11 (3.5%) |
| Total | 2,034 (100.0%) | 314 (100.0%) |
Monthly Housing Cost Tiers in Horseshoe Bay
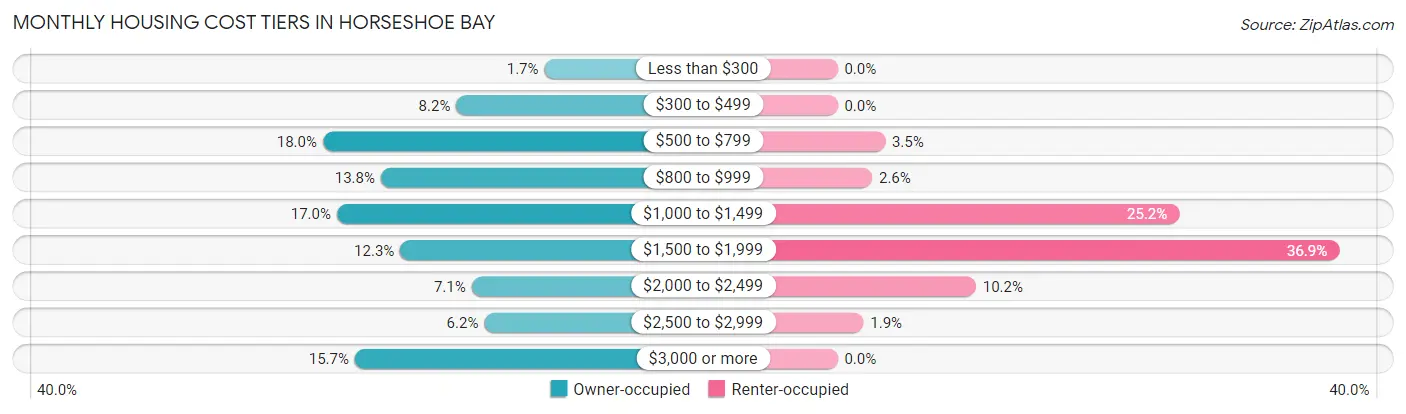
| Monthly Cost | Owner-occupied | Renter-occupied |
| Less than $300 | 35 (1.7%) | 0 (0.0%) |
| $300 to $499 | 167 (8.2%) | 0 (0.0%) |
| $500 to $799 | 367 (18.0%) | 11 (3.5%) |
| $800 to $999 | 280 (13.8%) | 8 (2.5%) |
| $1,000 to $1,499 | 346 (17.0%) | 79 (25.2%) |
| $1,500 to $1,999 | 251 (12.3%) | 116 (36.9%) |
| $2,000 to $2,499 | 144 (7.1%) | 32 (10.2%) |
| $2,500 to $2,999 | 125 (6.1%) | 6 (1.9%) |
| $3,000 or more | 319 (15.7%) | 0 (0.0%) |
| Total | 2,034 (100.0%) | 314 (100.0%) |
Physical Housing Characteristics in Horseshoe Bay
Housing Structures in Horseshoe Bay
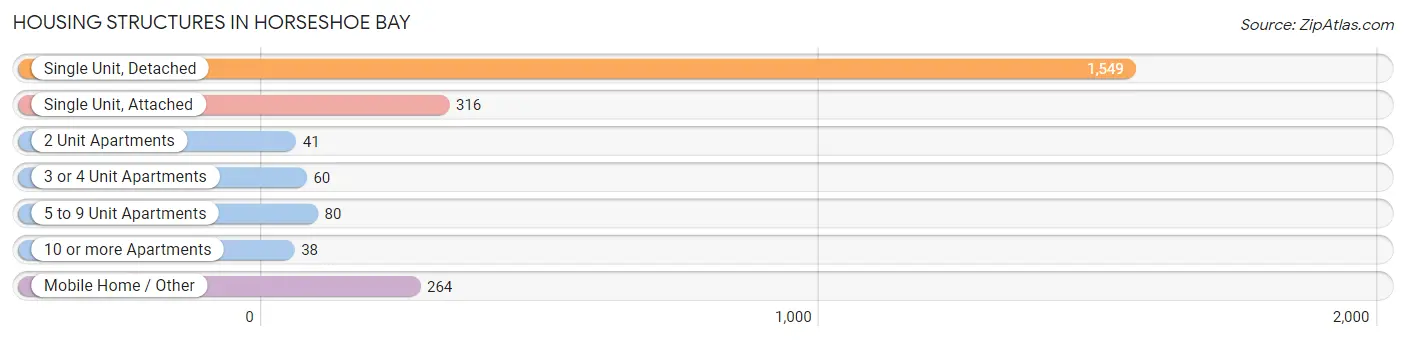
| Structure Type | # Housing Units | % Housing Units |
| Single Unit, Detached | 1,549 | 66.0% |
| Single Unit, Attached | 316 | 13.5% |
| 2 Unit Apartments | 41 | 1.8% |
| 3 or 4 Unit Apartments | 60 | 2.6% |
| 5 to 9 Unit Apartments | 80 | 3.4% |
| 10 or more Apartments | 38 | 1.6% |
| Mobile Home / Other | 264 | 11.2% |
| Total | 2,348 | 100.0% |
Housing Structures by Occupancy in Horseshoe Bay
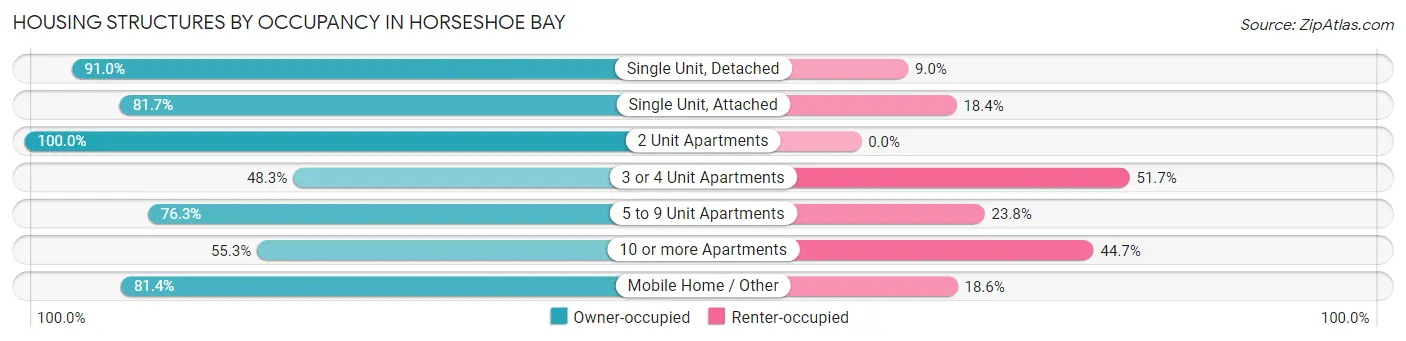
| Structure Type | Owner-occupied | Renter-occupied |
| Single Unit, Detached | 1,409 (91.0%) | 140 (9.0%) |
| Single Unit, Attached | 258 (81.7%) | 58 (18.3%) |
| 2 Unit Apartments | 41 (100.0%) | 0 (0.0%) |
| 3 or 4 Unit Apartments | 29 (48.3%) | 31 (51.7%) |
| 5 to 9 Unit Apartments | 61 (76.2%) | 19 (23.7%) |
| 10 or more Apartments | 21 (55.3%) | 17 (44.7%) |
| Mobile Home / Other | 215 (81.4%) | 49 (18.6%) |
| Total | 2,034 (86.6%) | 314 (13.4%) |
Housing Structures by Number of Rooms in Horseshoe Bay
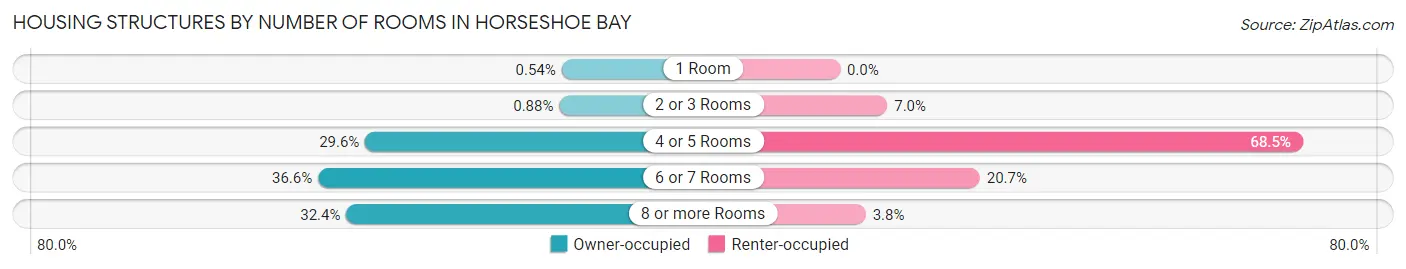
| Number of Rooms | Owner-occupied | Renter-occupied |
| 1 Room | 11 (0.5%) | 0 (0.0%) |
| 2 or 3 Rooms | 18 (0.9%) | 22 (7.0%) |
| 4 or 5 Rooms | 602 (29.6%) | 215 (68.5%) |
| 6 or 7 Rooms | 744 (36.6%) | 65 (20.7%) |
| 8 or more Rooms | 659 (32.4%) | 12 (3.8%) |
| Total | 2,034 (100.0%) | 314 (100.0%) |
Housing Structure by Heating Type in Horseshoe Bay
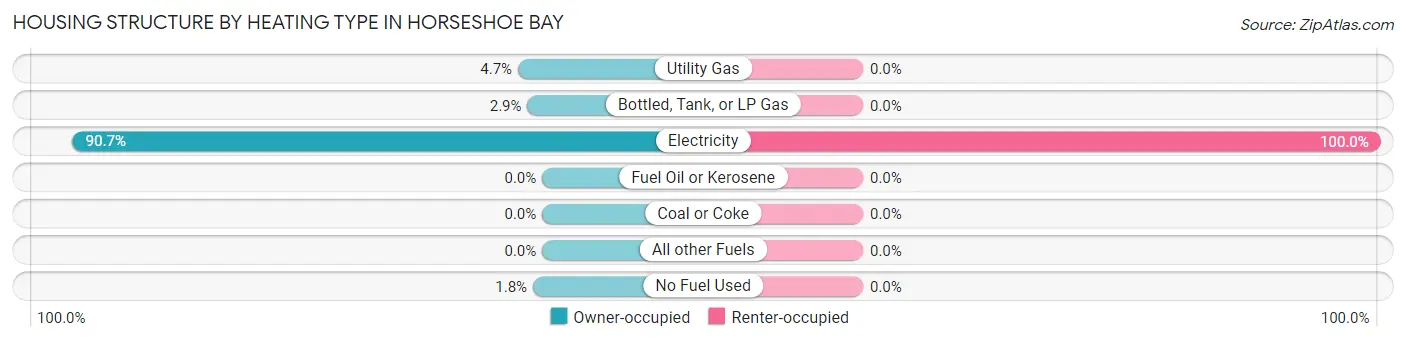
| Heating Type | Owner-occupied | Renter-occupied |
| Utility Gas | 95 (4.7%) | 0 (0.0%) |
| Bottled, Tank, or LP Gas | 58 (2.9%) | 0 (0.0%) |
| Electricity | 1,845 (90.7%) | 314 (100.0%) |
| Fuel Oil or Kerosene | 0 (0.0%) | 0 (0.0%) |
| Coal or Coke | 0 (0.0%) | 0 (0.0%) |
| All other Fuels | 0 (0.0%) | 0 (0.0%) |
| No Fuel Used | 36 (1.8%) | 0 (0.0%) |
| Total | 2,034 (100.0%) | 314 (100.0%) |
Household Vehicle Usage in Horseshoe Bay
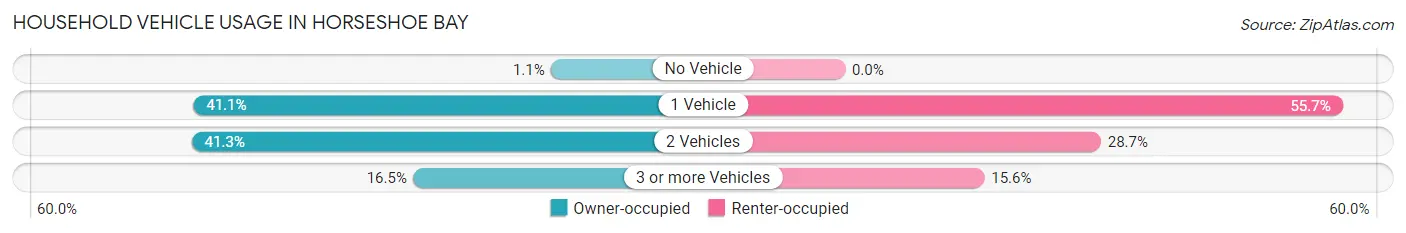
| Vehicles per Household | Owner-occupied | Renter-occupied |
| No Vehicle | 22 (1.1%) | 0 (0.0%) |
| 1 Vehicle | 836 (41.1%) | 175 (55.7%) |
| 2 Vehicles | 840 (41.3%) | 90 (28.7%) |
| 3 or more Vehicles | 336 (16.5%) | 49 (15.6%) |
| Total | 2,034 (100.0%) | 314 (100.0%) |
Real Estate & Mortgages in Horseshoe Bay
Real Estate and Mortgage Overview in Horseshoe Bay
| Characteristic | Without Mortgage | With Mortgage |
| Housing Units | 1,263 | 771 |
| Median Property Value | $437,300 | $450,400 |
| Median Household Income | $83,125 | $307 |
| Monthly Housing Costs | $855 | $262 |
| Real Estate Taxes | $4,094 | $57 |
Property Value by Mortgage Status in Horseshoe Bay
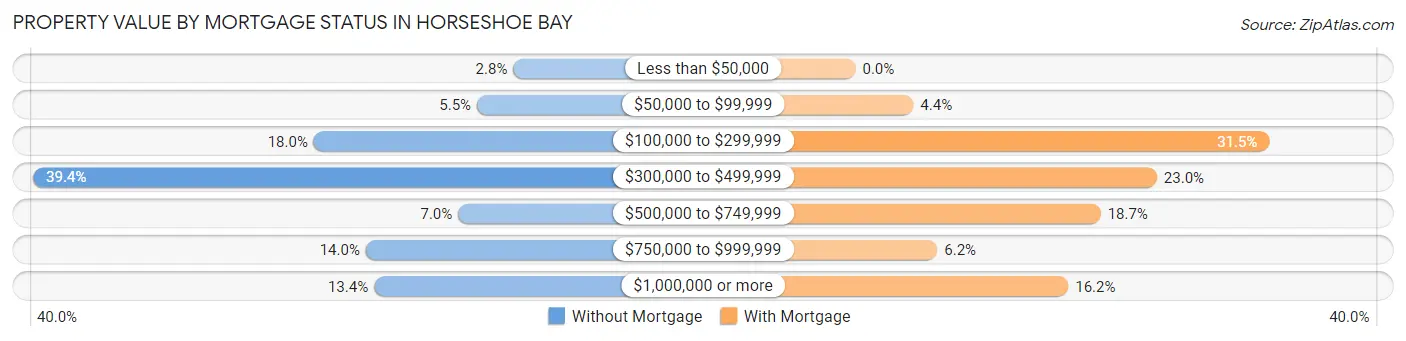
| Property Value | Without Mortgage | With Mortgage |
| Less than $50,000 | 35 (2.8%) | 0 (0.0%) |
| $50,000 to $99,999 | 70 (5.5%) | 34 (4.4%) |
| $100,000 to $299,999 | 227 (18.0%) | 243 (31.5%) |
| $300,000 to $499,999 | 497 (39.4%) | 177 (23.0%) |
| $500,000 to $749,999 | 88 (7.0%) | 144 (18.7%) |
| $750,000 to $999,999 | 177 (14.0%) | 48 (6.2%) |
| $1,000,000 or more | 169 (13.4%) | 125 (16.2%) |
| Total | 1,263 (100.0%) | 771 (100.0%) |
Household Income by Mortgage Status in Horseshoe Bay
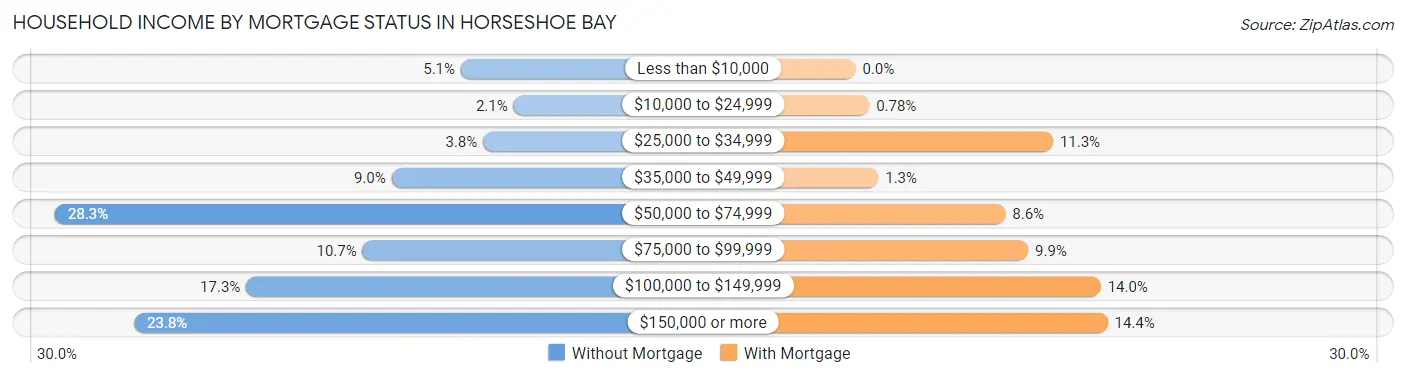
| Household Income | Without Mortgage | With Mortgage |
| Less than $10,000 | 64 (5.1%) | 0 (0.0%) |
| $10,000 to $24,999 | 26 (2.1%) | 6 (0.8%) |
| $25,000 to $34,999 | 48 (3.8%) | 87 (11.3%) |
| $35,000 to $49,999 | 114 (9.0%) | 10 (1.3%) |
| $50,000 to $74,999 | 357 (28.3%) | 66 (8.6%) |
| $75,000 to $99,999 | 135 (10.7%) | 76 (9.9%) |
| $100,000 to $149,999 | 219 (17.3%) | 108 (14.0%) |
| $150,000 or more | 300 (23.7%) | 111 (14.4%) |
| Total | 1,263 (100.0%) | 771 (100.0%) |
Property Value to Household Income Ratio in Horseshoe Bay
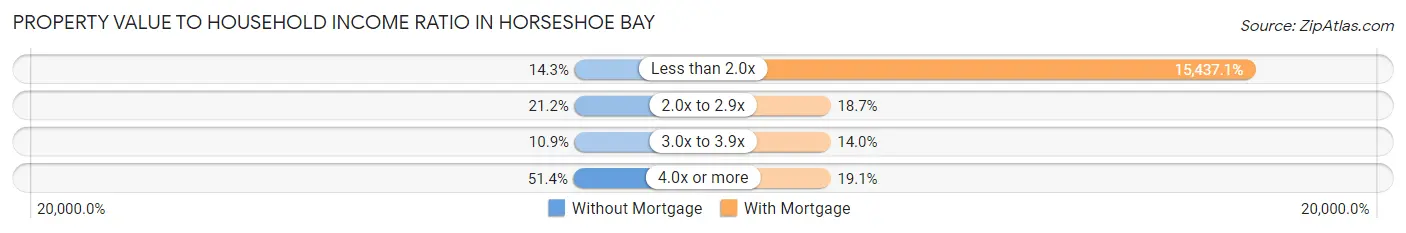
| Value-to-Income Ratio | Without Mortgage | With Mortgage |
| Less than 2.0x | 180 (14.2%) | 119,020 (15,437.1%) |
| 2.0x to 2.9x | 268 (21.2%) | 144 (18.7%) |
| 3.0x to 3.9x | 137 (10.8%) | 108 (14.0%) |
| 4.0x or more | 649 (51.4%) | 147 (19.1%) |
| Total | 1,263 (100.0%) | 771 (100.0%) |
Real Estate Taxes by Mortgage Status in Horseshoe Bay
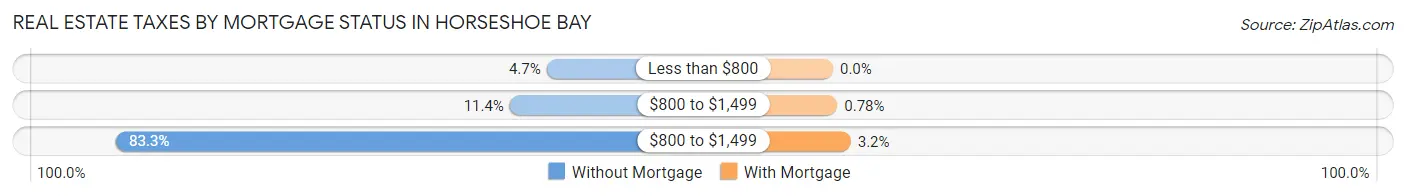
| Property Taxes | Without Mortgage | With Mortgage |
| Less than $800 | 59 (4.7%) | 0 (0.0%) |
| $800 to $1,499 | 144 (11.4%) | 6 (0.8%) |
| $800 to $1,499 | 1,052 (83.3%) | 25 (3.2%) |
| Total | 1,263 (100.0%) | 771 (100.0%) |
Health & Disability in Horseshoe Bay
Health Insurance Coverage by Age in Horseshoe Bay
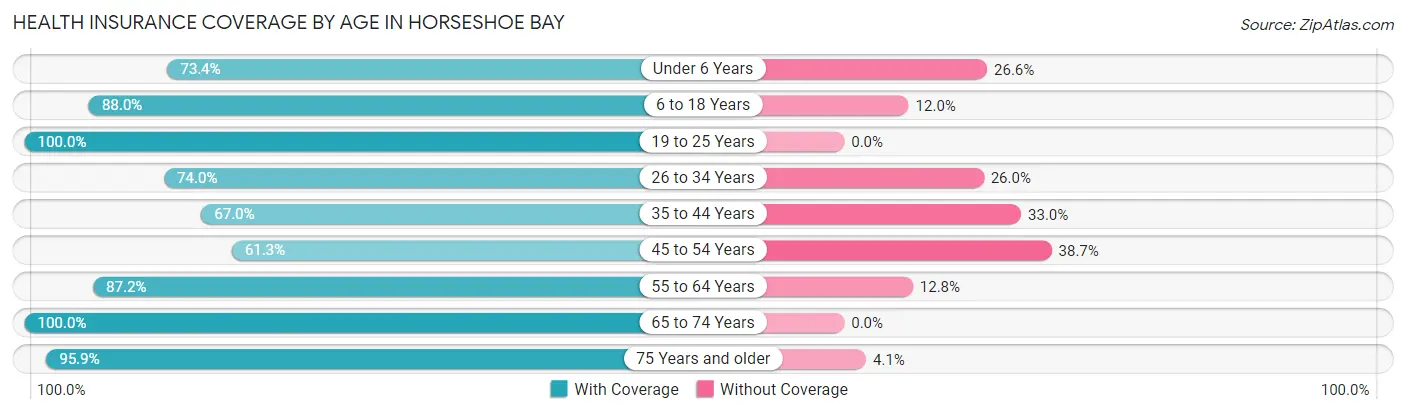
| Age Bracket | With Coverage | Without Coverage |
| Under 6 Years | 135 (73.4%) | 49 (26.6%) |
| 6 to 18 Years | 264 (88.0%) | 36 (12.0%) |
| 19 to 25 Years | 153 (100.0%) | 0 (0.0%) |
| 26 to 34 Years | 74 (74.0%) | 26 (26.0%) |
| 35 to 44 Years | 244 (67.0%) | 120 (33.0%) |
| 45 to 54 Years | 284 (61.3%) | 179 (38.7%) |
| 55 to 64 Years | 600 (87.2%) | 88 (12.8%) |
| 65 to 74 Years | 1,142 (100.0%) | 0 (0.0%) |
| 75 Years and older | 1,158 (95.9%) | 49 (4.1%) |
| Total | 4,054 (88.1%) | 547 (11.9%) |
Health Insurance Coverage by Citizenship Status in Horseshoe Bay
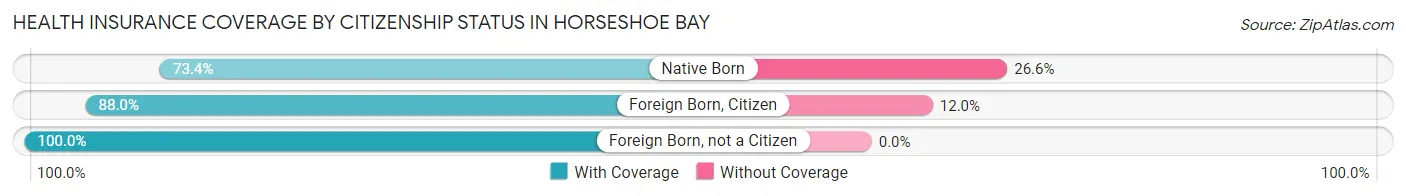
| Citizenship Status | With Coverage | Without Coverage |
| Native Born | 135 (73.4%) | 49 (26.6%) |
| Foreign Born, Citizen | 264 (88.0%) | 36 (12.0%) |
| Foreign Born, not a Citizen | 153 (100.0%) | 0 (0.0%) |
Health Insurance Coverage by Household Income in Horseshoe Bay
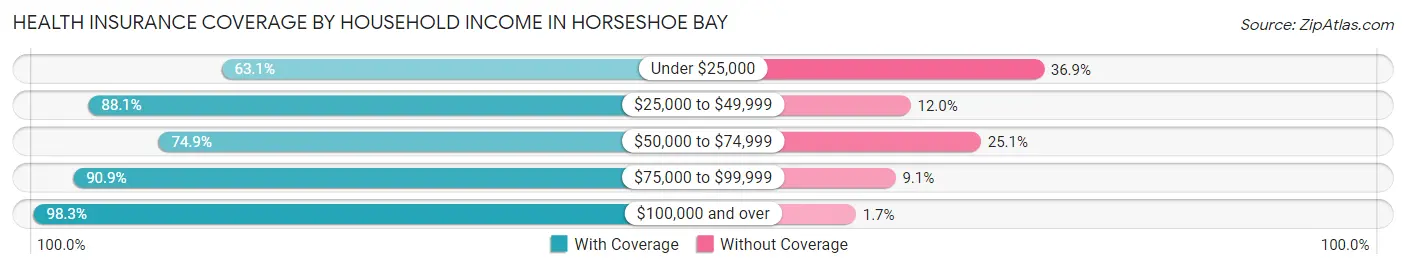
| Household Income | With Coverage | Without Coverage |
| Under $25,000 | 224 (63.1%) | 131 (36.9%) |
| $25,000 to $49,999 | 479 (88.0%) | 65 (11.9%) |
| $50,000 to $74,999 | 782 (74.9%) | 262 (25.1%) |
| $75,000 to $99,999 | 538 (90.9%) | 54 (9.1%) |
| $100,000 and over | 2,031 (98.3%) | 35 (1.7%) |
Public vs Private Health Insurance Coverage by Age in Horseshoe Bay
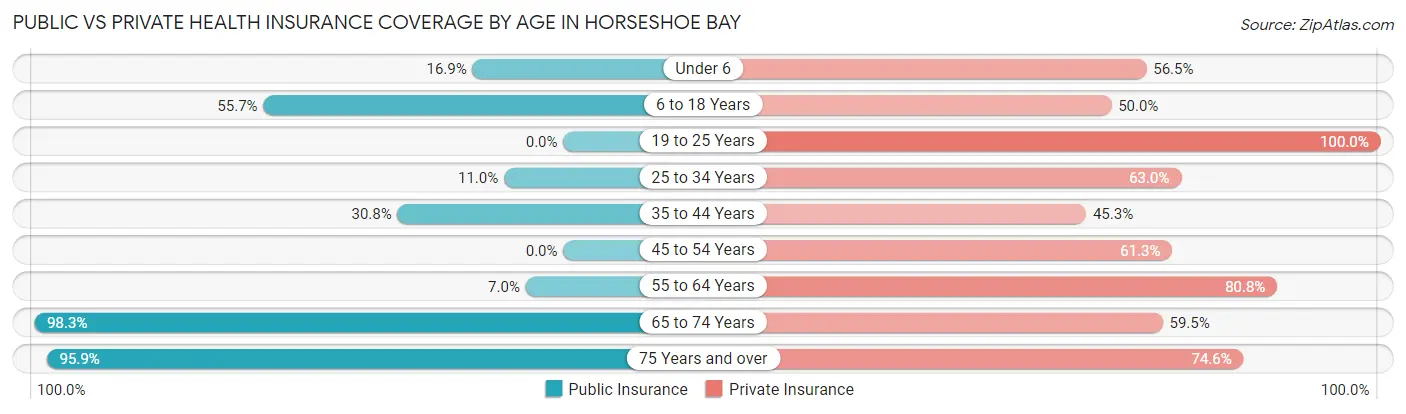
| Age Bracket | Public Insurance | Private Insurance |
| Under 6 | 31 (16.9%) | 104 (56.5%) |
| 6 to 18 Years | 167 (55.7%) | 150 (50.0%) |
| 19 to 25 Years | 0 (0.0%) | 153 (100.0%) |
| 25 to 34 Years | 11 (11.0%) | 63 (63.0%) |
| 35 to 44 Years | 112 (30.8%) | 165 (45.3%) |
| 45 to 54 Years | 0 (0.0%) | 284 (61.3%) |
| 55 to 64 Years | 48 (7.0%) | 556 (80.8%) |
| 65 to 74 Years | 1,122 (98.3%) | 680 (59.5%) |
| 75 Years and over | 1,158 (95.9%) | 900 (74.6%) |
| Total | 2,649 (57.6%) | 3,055 (66.4%) |
Disability Status by Sex by Age in Horseshoe Bay
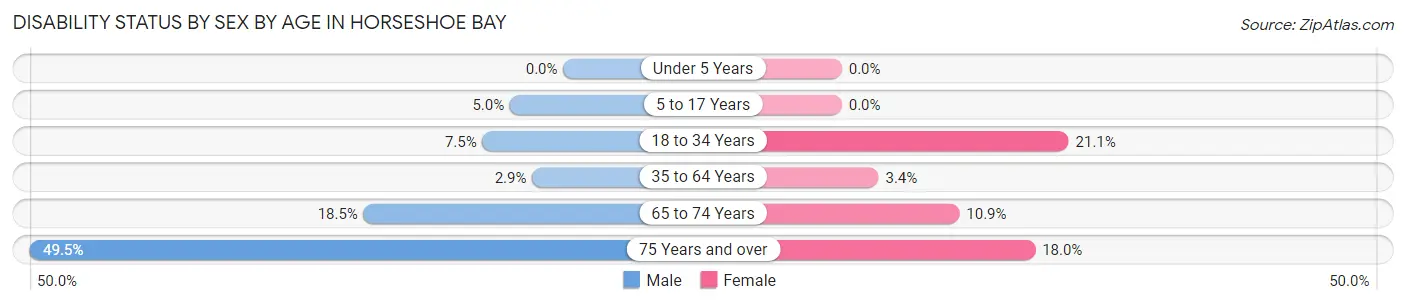
| Age Bracket | Male | Female |
| Under 5 Years | 0 (0.0%) | 0 (0.0%) |
| 5 to 17 Years | 11 (5.0%) | 0 (0.0%) |
| 18 to 34 Years | 9 (7.5%) | 28 (21.0%) |
| 35 to 64 Years | 20 (2.9%) | 28 (3.4%) |
| 65 to 74 Years | 91 (18.5%) | 71 (10.9%) |
| 75 Years and over | 341 (49.5%) | 93 (17.9%) |
Disability Class by Sex by Age in Horseshoe Bay
Disability Class: Hearing Difficulty
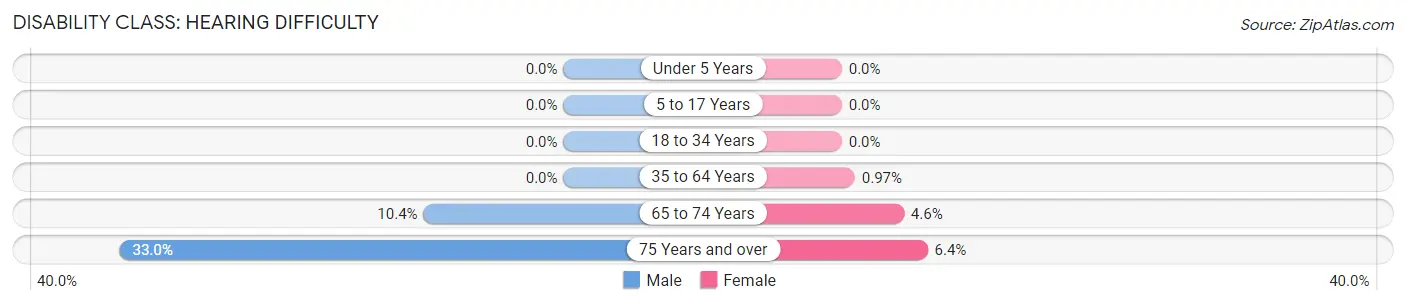
| Age Bracket | Male | Female |
| Under 5 Years | 0 (0.0%) | 0 (0.0%) |
| 5 to 17 Years | 0 (0.0%) | 0 (0.0%) |
| 18 to 34 Years | 0 (0.0%) | 0 (0.0%) |
| 35 to 64 Years | 0 (0.0%) | 8 (1.0%) |
| 65 to 74 Years | 51 (10.4%) | 30 (4.6%) |
| 75 Years and over | 227 (33.0%) | 33 (6.4%) |
Disability Class: Vision Difficulty
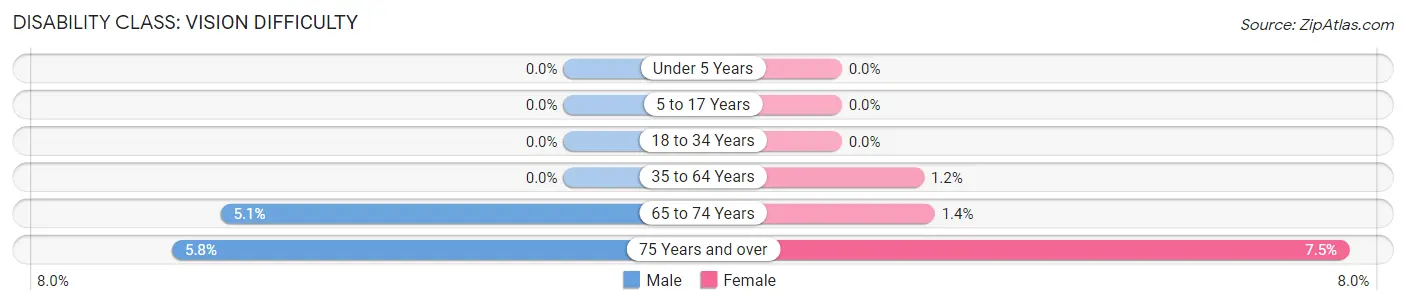
| Age Bracket | Male | Female |
| Under 5 Years | 0 (0.0%) | 0 (0.0%) |
| 5 to 17 Years | 0 (0.0%) | 0 (0.0%) |
| 18 to 34 Years | 0 (0.0%) | 0 (0.0%) |
| 35 to 64 Years | 0 (0.0%) | 10 (1.2%) |
| 65 to 74 Years | 25 (5.1%) | 9 (1.4%) |
| 75 Years and over | 40 (5.8%) | 39 (7.5%) |
Disability Class: Cognitive Difficulty
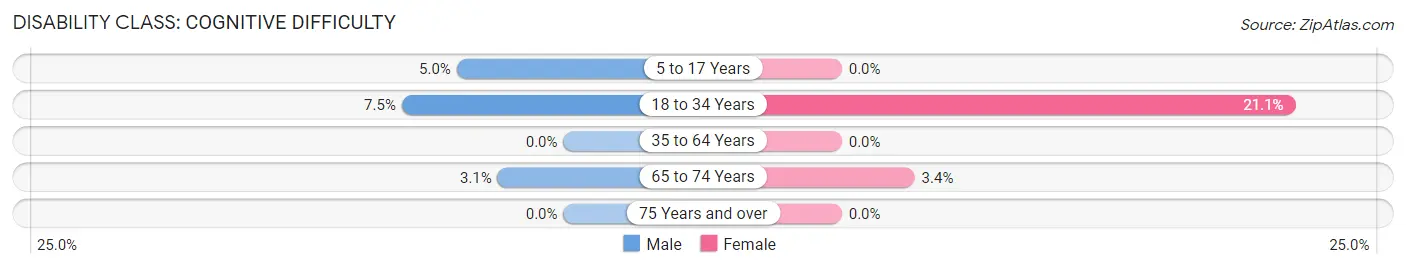
| Age Bracket | Male | Female |
| 5 to 17 Years | 11 (5.0%) | 0 (0.0%) |
| 18 to 34 Years | 9 (7.5%) | 28 (21.0%) |
| 35 to 64 Years | 0 (0.0%) | 0 (0.0%) |
| 65 to 74 Years | 15 (3.0%) | 22 (3.4%) |
| 75 Years and over | 0 (0.0%) | 0 (0.0%) |
Disability Class: Ambulatory Difficulty
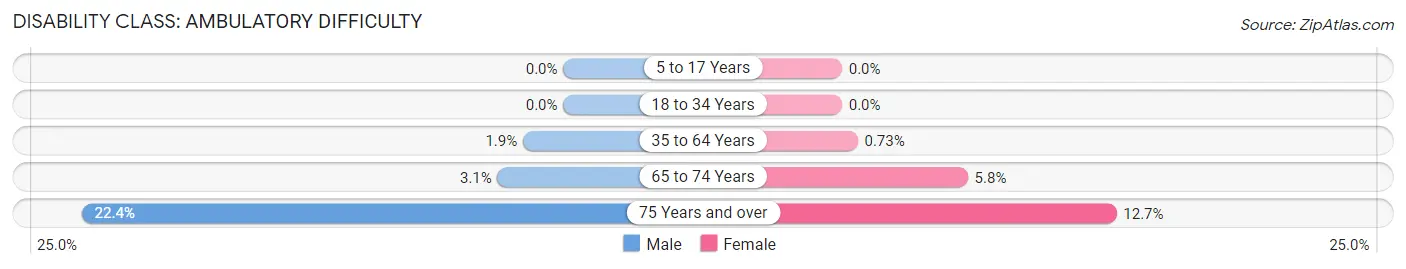
| Age Bracket | Male | Female |
| 5 to 17 Years | 0 (0.0%) | 0 (0.0%) |
| 18 to 34 Years | 0 (0.0%) | 0 (0.0%) |
| 35 to 64 Years | 13 (1.9%) | 6 (0.7%) |
| 65 to 74 Years | 15 (3.0%) | 38 (5.8%) |
| 75 Years and over | 154 (22.4%) | 66 (12.7%) |
Disability Class: Self-Care Difficulty
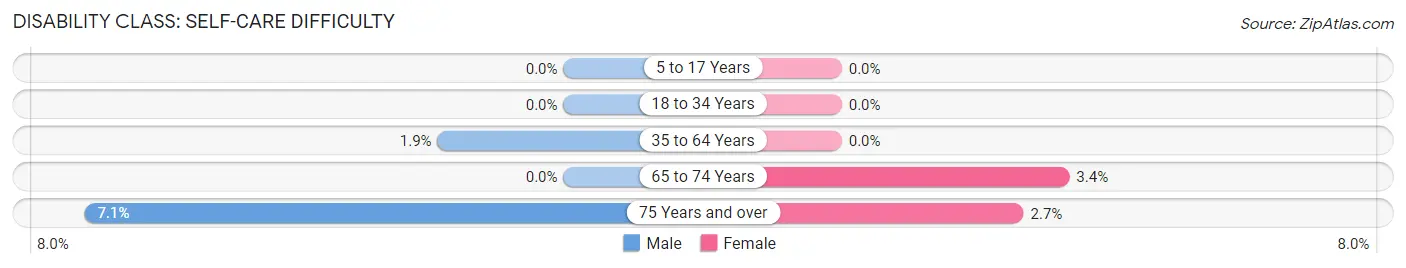
| Age Bracket | Male | Female |
| 5 to 17 Years | 0 (0.0%) | 0 (0.0%) |
| 18 to 34 Years | 0 (0.0%) | 0 (0.0%) |
| 35 to 64 Years | 13 (1.9%) | 0 (0.0%) |
| 65 to 74 Years | 0 (0.0%) | 22 (3.4%) |
| 75 Years and over | 49 (7.1%) | 14 (2.7%) |
Technology Access in Horseshoe Bay
Computing Device Access in Horseshoe Bay
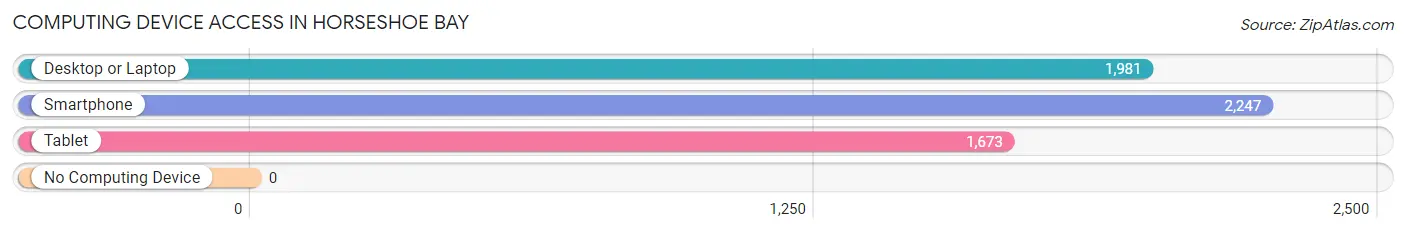
| Device Type | # Households | % Households |
| Desktop or Laptop | 1,981 | 84.4% |
| Smartphone | 2,247 | 95.7% |
| Tablet | 1,673 | 71.3% |
| No Computing Device | 0 | 0.0% |
| Total | 2,348 | 100.0% |
Internet Access in Horseshoe Bay
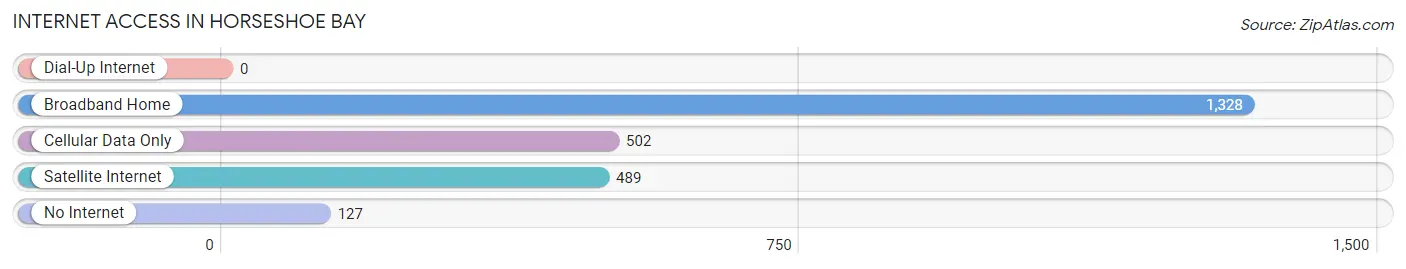
| Internet Type | # Households | % Households |
| Dial-Up Internet | 0 | 0.0% |
| Broadband Home | 1,328 | 56.6% |
| Cellular Data Only | 502 | 21.4% |
| Satellite Internet | 489 | 20.8% |
| No Internet | 127 | 5.4% |
| Total | 2,348 | 100.0% |
Horseshoe Bay Summary
Horseshoe Bay is a small city located in Llano County, Texas, United States. It is situated on the shores of Lake LBJ, a reservoir on the Colorado River. The city is known for its golf courses, resorts, and marinas. It is also home to the Horseshoe Bay Resort, a popular destination for golfers and vacationers.
History
Horseshoe Bay was first settled in the late 1800s by ranchers and farmers. The area was originally known as “Horseshoe Bend” due to its shape. In the early 1900s, the area was developed as a resort destination. The first resort, the Horseshoe Bay Resort, was built in the 1930s. The resort was a popular destination for golfers and vacationers.
In the 1950s, the area was developed further with the construction of a marina and a golf course. The marina was built to accommodate the increasing number of boats on Lake LBJ. The golf course was designed by renowned golf course architect Robert Trent Jones, Sr.
In the 1960s, the area was further developed with the construction of a second golf course and a hotel. The hotel was built to accommodate the increasing number of visitors to the area.
In the 1970s, the area was further developed with the construction of a third golf course and a second hotel. The area was also developed with the construction of a shopping center and a number of restaurants.
In the 1980s, the area was further developed with the construction of a fourth golf course and a third hotel. The area was also developed with the construction of a number of condominiums and townhomes.
In the 1990s, the area was further developed with the construction of a fifth golf course and a fourth hotel. The area was also developed with the construction of a number of restaurants and retail stores.
Geography
Horseshoe Bay is located in Llano County, Texas, United States. It is situated on the shores of Lake LBJ, a reservoir on the Colorado River. The city is located approximately 70 miles northwest of Austin and approximately 90 miles northeast of San Antonio.
The city has a total area of 4.2 square miles, all of which is land. The terrain is mostly flat with some rolling hills. The climate is generally mild with hot summers and mild winters.
Economy
The economy of Horseshoe Bay is largely based on tourism. The city is home to the Horseshoe Bay Resort, a popular destination for golfers and vacationers. The resort features three golf courses, a marina, a hotel, and a number of restaurants and retail stores.
The city is also home to a number of other businesses, including a number of restaurants, retail stores, and marinas. The city is also home to a number of manufacturing and industrial businesses.
Demographics
As of the 2010 census, the population of Horseshoe Bay was 3,560. The racial makeup of the city was 94.3% White, 0.7% African American, 0.3% Native American, 0.7% Asian, 0.1% Pacific Islander, 2.2% from other races, and 1.9% from two or more races. Hispanic or Latino of any race were 6.3% of the population.
The median income for a household in the city was $50,938, and the median income for a family was $60,000. The per capita income for the city was $30,938. About 6.3% of families and 8.3% of the population were below the poverty line, including 10.3% of those under age 18 and 4.3% of those age 65 or over.
Common Questions
What is Per Capita Income in Horseshoe Bay?
Per Capita income in Horseshoe Bay is $65,854.
What is the Median Family Income in Horseshoe Bay?
Median Family Income in Horseshoe Bay is $112,266.
What is the Median Household income in Horseshoe Bay?
Median Household Income in Horseshoe Bay is $85,197.
What is Income or Wage Gap in Horseshoe Bay?
Income or Wage Gap in Horseshoe Bay is 41.8%.
Women in Horseshoe Bay earn 58.2 cents for every dollar earned by a man.
What is Family Income Deficit in Horseshoe Bay?
Family Income Deficit in Horseshoe Bay is $7,222.
Families that are below poverty line in Horseshoe Bay earn $7,222 less on average than the poverty threshold level.
What is Inequality or Gini Index in Horseshoe Bay?
Inequality or Gini Index in Horseshoe Bay is 0.49.
What is the Total Population of Horseshoe Bay?
Total Population of Horseshoe Bay is 4,601.
What is the Total Male Population of Horseshoe Bay?
Total Male Population of Horseshoe Bay is 2,272.
What is the Total Female Population of Horseshoe Bay?
Total Female Population of Horseshoe Bay is 2,329.
What is the Ratio of Males per 100 Females in Horseshoe Bay?
There are 97.55 Males per 100 Females in Horseshoe Bay.
What is the Ratio of Females per 100 Males in Horseshoe Bay?
There are 102.51 Females per 100 Males in Horseshoe Bay.
What is the Median Population Age in Horseshoe Bay?
Median Population Age in Horseshoe Bay is 65.3 Years.
What is the Average Family Size in Horseshoe Bay
Average Family Size in Horseshoe Bay is 2.5 People.
What is the Average Household Size in Horseshoe Bay
Average Household Size in Horseshoe Bay is 2.0 People.
How Large is the Labor Force in Horseshoe Bay?
There are 1,829 People in the Labor Forcein in Horseshoe Bay.
What is the Percentage of People in the Labor Force in Horseshoe Bay?
43.6% of People are in the Labor Force in Horseshoe Bay.
What is the Unemployment Rate in Horseshoe Bay?
Unemployment Rate in Horseshoe Bay is 3.5%.