Bay City, TX Map & Demographics
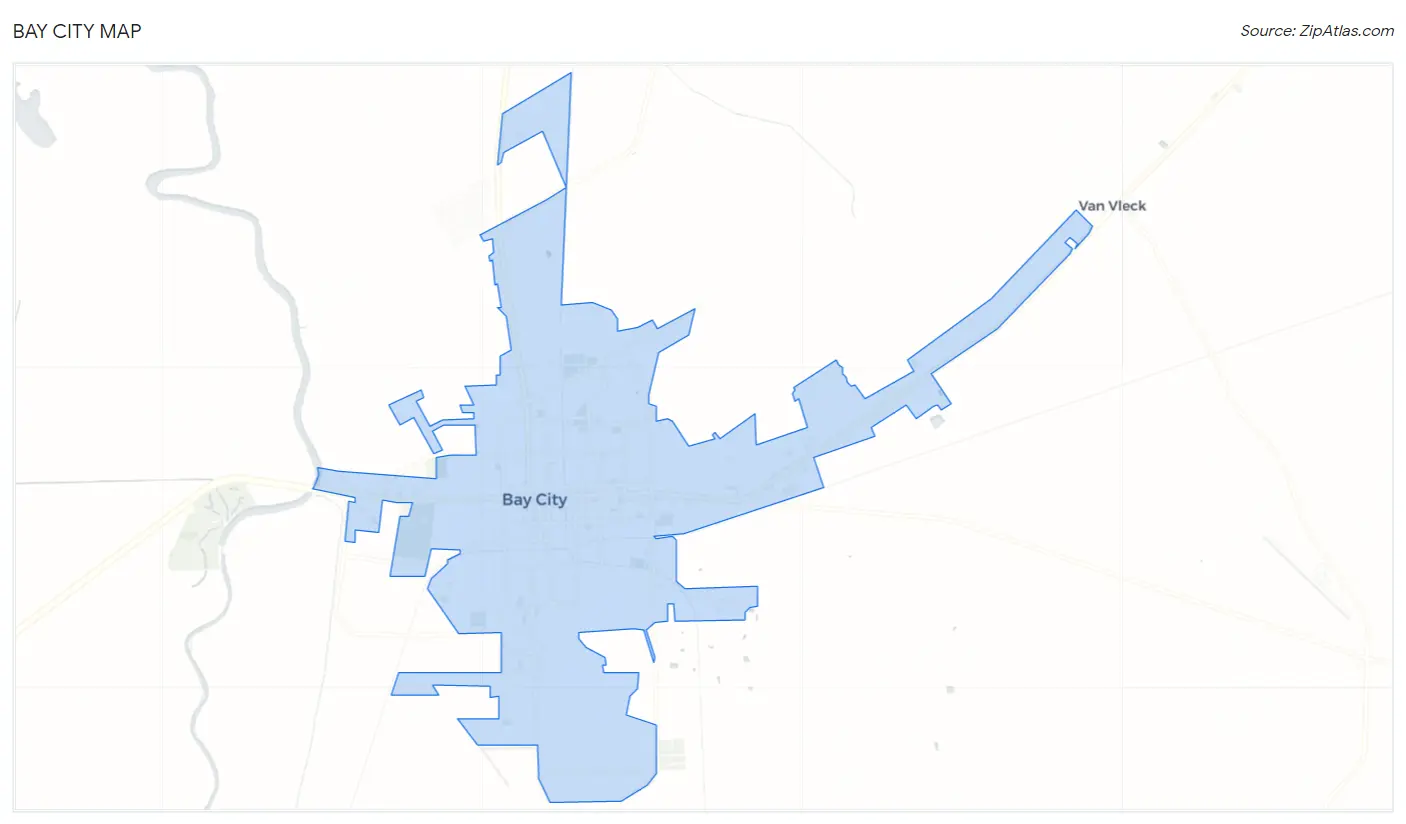
Bay City Map
Bay City Overview
$26,436
PER CAPITA INCOME
$58,000
AVG FAMILY INCOME
$50,212
AVG HOUSEHOLD INCOME
52.3%
WAGE / INCOME GAP [ % ]
47.7¢/ $1
WAGE / INCOME GAP [ $ ]
0.52
INEQUALITY / GINI INDEX
17,869
TOTAL POPULATION
8,351
MALE POPULATION
9,518
FEMALE POPULATION
87.74
MALES / 100 FEMALES
113.97
FEMALES / 100 MALES
31.8
MEDIAN AGE
3.4
AVG FAMILY SIZE
2.6
AVG HOUSEHOLD SIZE
7,753
LABOR FORCE [ PEOPLE ]
59.4%
PERCENT IN LABOR FORCE
11.1%
UNEMPLOYMENT RATE
Bay City Zip Codes
Bay City Area Codes
Income in Bay City
Income Overview in Bay City
Per Capita Income in Bay City is $26,436, while median incomes of families and households are $58,000 and $50,212 respectively.
| Characteristic | Number | Measure |
| Per Capita Income | 17,869 | $26,436 |
| Median Family Income | 4,418 | $58,000 |
| Mean Family Income | 4,418 | $76,665 |
| Median Household Income | 6,674 | $50,212 |
| Mean Household Income | 6,674 | $68,634 |
| Income Deficit | 4,418 | $0 |
| Wage / Income Gap (%) | 17,869 | 52.27% |
| Wage / Income Gap ($) | 17,869 | 47.73¢ per $1 |
| Gini / Inequality Index | 17,869 | 0.52 |
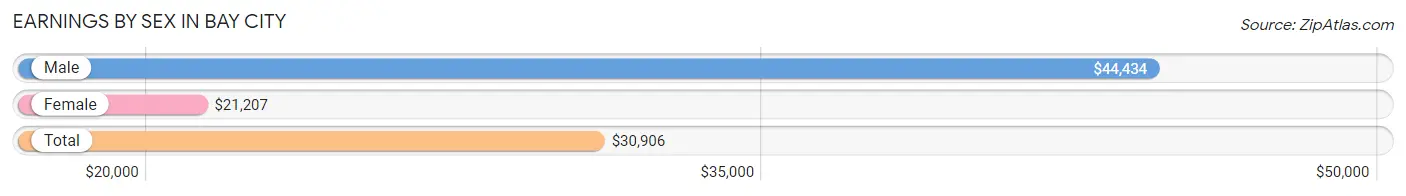
Earnings by Sex in Bay City
Average Earnings in Bay City are $30,906, $44,434 for men and $21,207 for women, a difference of 52.3%.
| Sex | Number | Average Earnings |
| Male | 4,375 (55.6%) | $44,434 |
| Female | 3,486 (44.4%) | $21,207 |
| Total | 7,861 (100.0%) | $30,906 |
Earnings by Sex by Income Bracket in Bay City
The most common earnings brackets in Bay City are $100,000+ for men (713 | 16.3%) and $10,000 to $12,499 for women (398 | 11.4%).
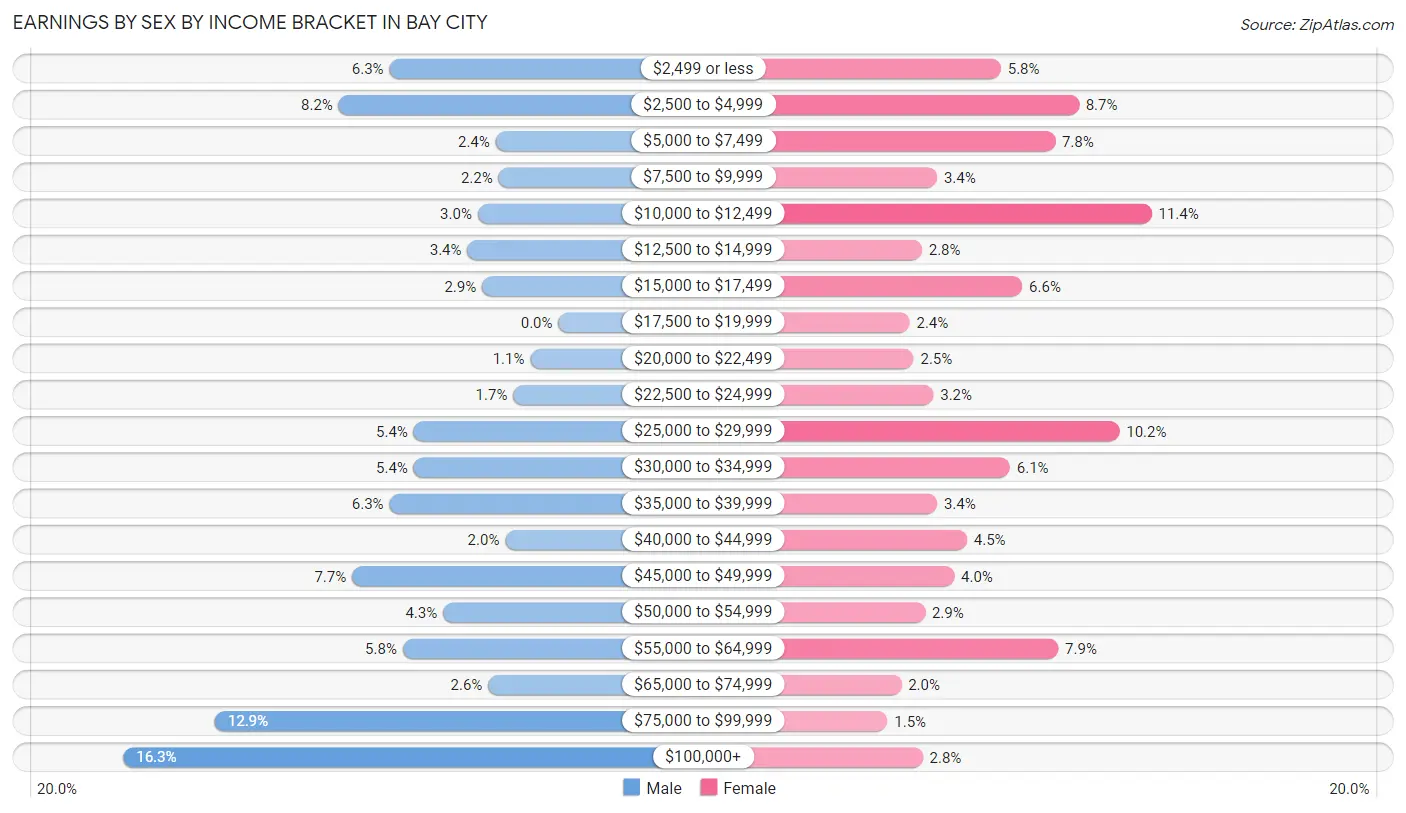
| Income | Male | Female |
| $2,499 or less | 277 (6.3%) | 201 (5.8%) |
| $2,500 to $4,999 | 360 (8.2%) | 303 (8.7%) |
| $5,000 to $7,499 | 103 (2.4%) | 272 (7.8%) |
| $7,500 to $9,999 | 98 (2.2%) | 118 (3.4%) |
| $10,000 to $12,499 | 132 (3.0%) | 398 (11.4%) |
| $12,500 to $14,999 | 149 (3.4%) | 98 (2.8%) |
| $15,000 to $17,499 | 125 (2.9%) | 229 (6.6%) |
| $17,500 to $19,999 | 0 (0.0%) | 82 (2.4%) |
| $20,000 to $22,499 | 46 (1.1%) | 87 (2.5%) |
| $22,500 to $24,999 | 74 (1.7%) | 113 (3.2%) |
| $25,000 to $29,999 | 237 (5.4%) | 356 (10.2%) |
| $30,000 to $34,999 | 237 (5.4%) | 213 (6.1%) |
| $35,000 to $39,999 | 277 (6.3%) | 118 (3.4%) |
| $40,000 to $44,999 | 87 (2.0%) | 157 (4.5%) |
| $45,000 to $49,999 | 338 (7.7%) | 140 (4.0%) |
| $50,000 to $54,999 | 189 (4.3%) | 102 (2.9%) |
| $55,000 to $64,999 | 255 (5.8%) | 276 (7.9%) |
| $65,000 to $74,999 | 115 (2.6%) | 71 (2.0%) |
| $75,000 to $99,999 | 563 (12.9%) | 53 (1.5%) |
| $100,000+ | 713 (16.3%) | 99 (2.8%) |
| Total | 4,375 (100.0%) | 3,486 (100.0%) |
Earnings by Sex by Educational Attainment in Bay City
Average earnings in Bay City are $46,250 for men and $25,722 for women, a difference of 44.4%. Men with an educational attainment of bachelor's degree enjoy the highest average annual earnings of $88,117, while those with high school diploma education earn the least with $34,336. Women with an educational attainment of graduate degree earn the most with the average annual earnings of $75,000, while those with high school diploma education have the smallest earnings of $16,761.
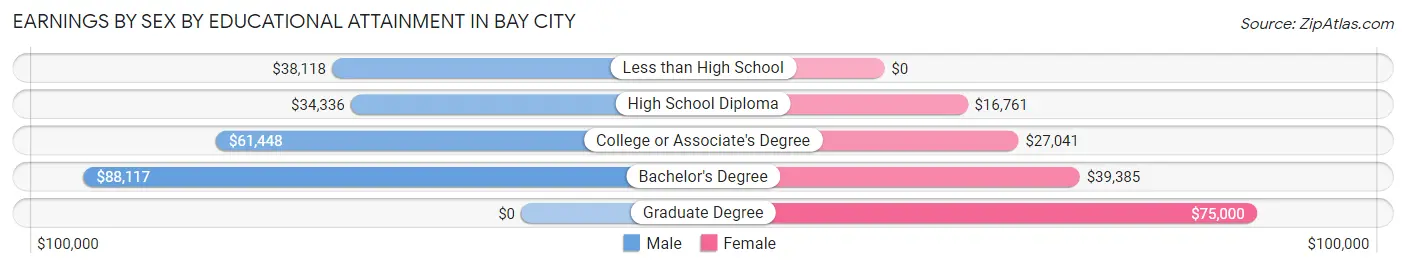
| Educational Attainment | Male Income | Female Income |
| Less than High School | $38,118 | $0 |
| High School Diploma | $34,336 | $16,761 |
| College or Associate's Degree | $61,448 | $27,041 |
| Bachelor's Degree | $88,117 | $39,385 |
| Graduate Degree | - | - |
| Total | $46,250 | $25,722 |
Family Income in Bay City
Family Income Brackets in Bay City
According to the Bay City family income data, there are 760 families falling into the $75,000 to $99,999 income range, which is the most common income bracket and makes up 17.2% of all families. Conversely, the $150,000 to $199,999 income bracket is the least frequent group with only 247 families (5.6%) belonging to this category.
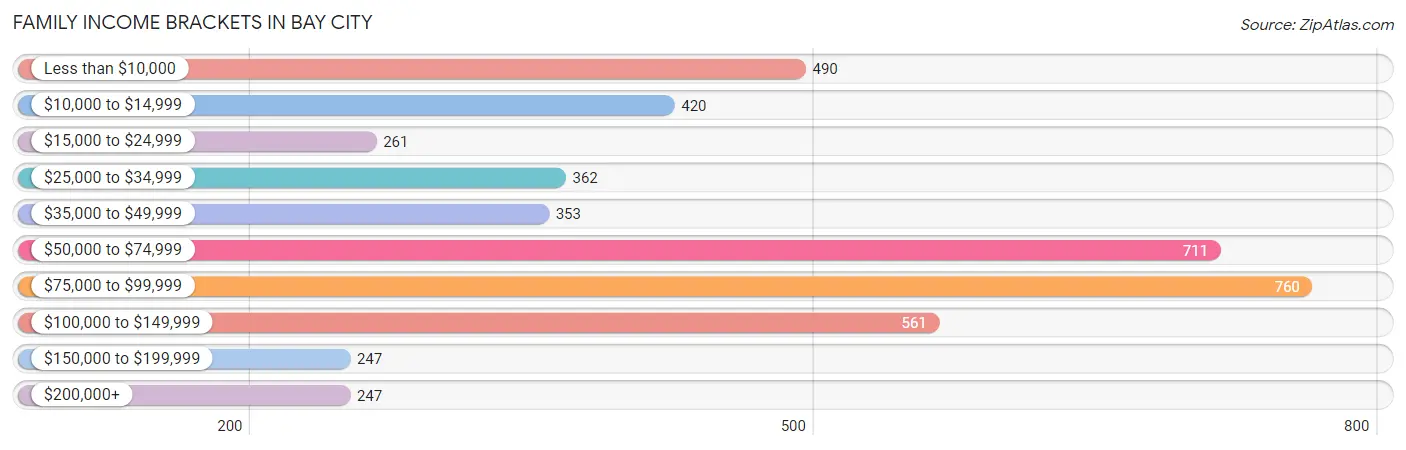
| Income Bracket | # Families | % Families |
| Less than $10,000 | 490 | 11.1% |
| $10,000 to $14,999 | 420 | 9.5% |
| $15,000 to $24,999 | 261 | 5.9% |
| $25,000 to $34,999 | 362 | 8.2% |
| $35,000 to $49,999 | 353 | 8.0% |
| $50,000 to $74,999 | 711 | 16.1% |
| $75,000 to $99,999 | 760 | 17.2% |
| $100,000 to $149,999 | 561 | 12.7% |
| $150,000 to $199,999 | 247 | 5.6% |
| $200,000+ | 247 | 5.6% |
Family Income by Famaliy Size in Bay City
6-person families (241 | 5.4%) account for the highest median family income in Bay City with $100,917 per family, while 2-person families (1,882 | 42.6%) have the highest median income of $28,105 per family member.
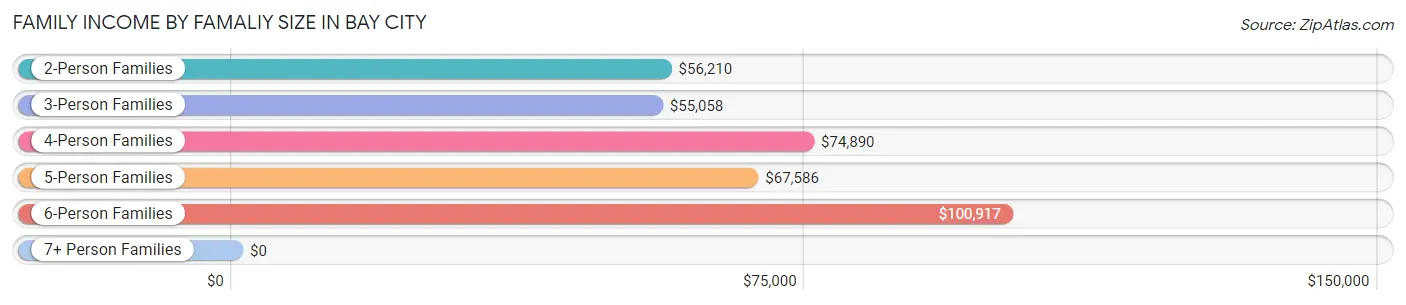
| Income Bracket | # Families | Median Income |
| 2-Person Families | 1,882 (42.6%) | $56,210 |
| 3-Person Families | 1,117 (25.3%) | $55,058 |
| 4-Person Families | 719 (16.3%) | $74,890 |
| 5-Person Families | 318 (7.2%) | $67,586 |
| 6-Person Families | 241 (5.4%) | $100,917 |
| 7+ Person Families | 141 (3.2%) | $0 |
| Total | 4,418 (100.0%) | $58,000 |
Family Income by Number of Earners in Bay City
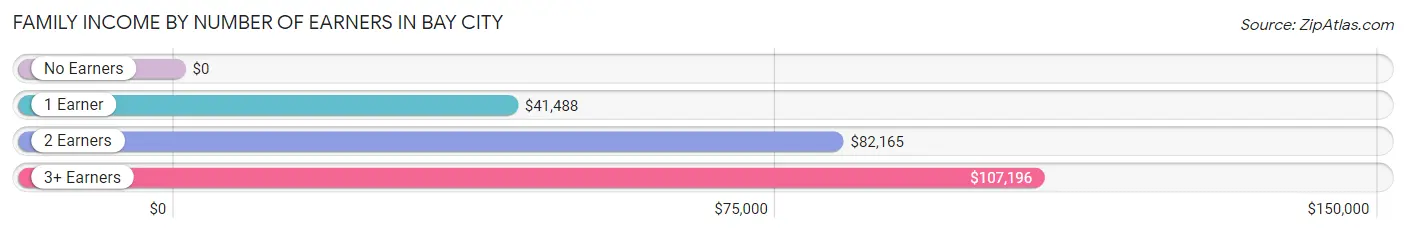
| Number of Earners | # Families | Median Income |
| No Earners | 539 (12.2%) | $0 |
| 1 Earner | 2,205 (49.9%) | $41,488 |
| 2 Earners | 1,335 (30.2%) | $82,165 |
| 3+ Earners | 339 (7.7%) | $107,196 |
| Total | 4,418 (100.0%) | $58,000 |
Household Income in Bay City
Household Income Brackets in Bay City
With 1,048 households falling in the category, the $50,000 to $74,999 income range is the most frequent in Bay City, accounting for 15.7% of all households. In contrast, only 247 households (3.7%) fall into the $150,000 to $199,999 income bracket, making it the least populous group.
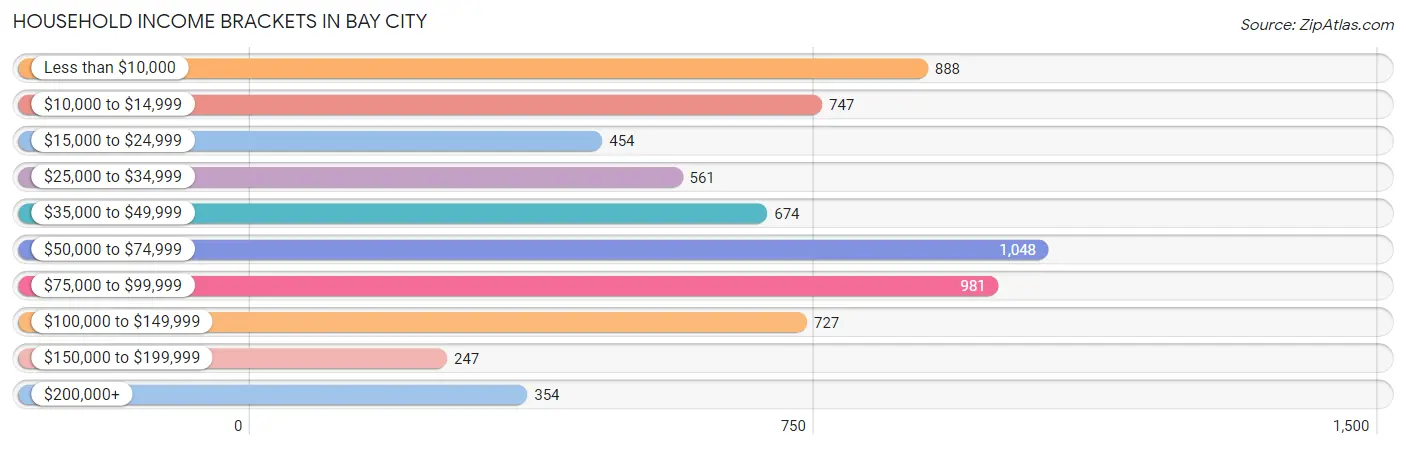
| Income Bracket | # Households | % Households |
| Less than $10,000 | 888 | 13.3% |
| $10,000 to $14,999 | 747 | 11.2% |
| $15,000 to $24,999 | 454 | 6.8% |
| $25,000 to $34,999 | 561 | 8.4% |
| $35,000 to $49,999 | 674 | 10.1% |
| $50,000 to $74,999 | 1,048 | 15.7% |
| $75,000 to $99,999 | 981 | 14.7% |
| $100,000 to $149,999 | 727 | 10.9% |
| $150,000 to $199,999 | 247 | 3.7% |
| $200,000+ | 354 | 5.3% |
Household Income by Householder Age in Bay City
The median household income in Bay City is $50,212, with the highest median household income of $57,054 found in the 45 to 64 years age bracket for the primary householder. A total of 2,167 households (32.5%) fall into this category. Meanwhile, the 15 to 24 years age bracket for the primary householder has the lowest median household income of $18,008, with 370 households (5.5%) in this group.
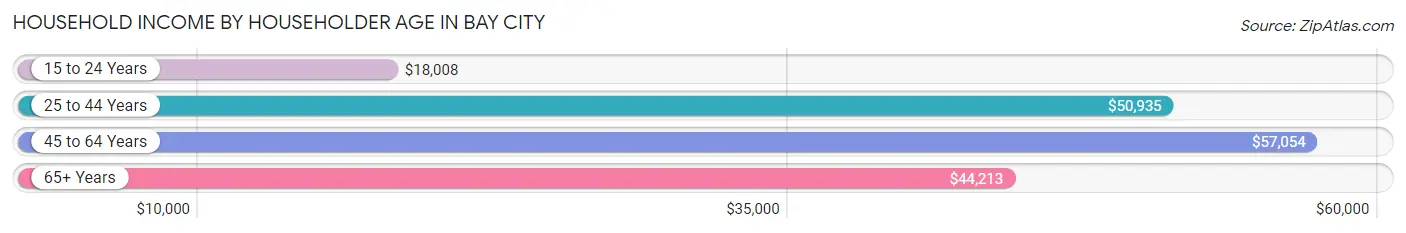
| Income Bracket | # Households | Median Income |
| 15 to 24 Years | 370 (5.5%) | $18,008 |
| 25 to 44 Years | 2,624 (39.3%) | $50,935 |
| 45 to 64 Years | 2,167 (32.5%) | $57,054 |
| 65+ Years | 1,513 (22.7%) | $44,213 |
| Total | 6,674 (100.0%) | $50,212 |
Poverty in Bay City
Income Below Poverty by Sex and Age in Bay City
With 25.8% poverty level for males and 31.1% for females among the residents of Bay City, 6 to 11 year old males and 16 and 17 year old females are the most vulnerable to poverty, with 400 males (54.9%) and 116 females (62.0%) in their respective age groups living below the poverty level.
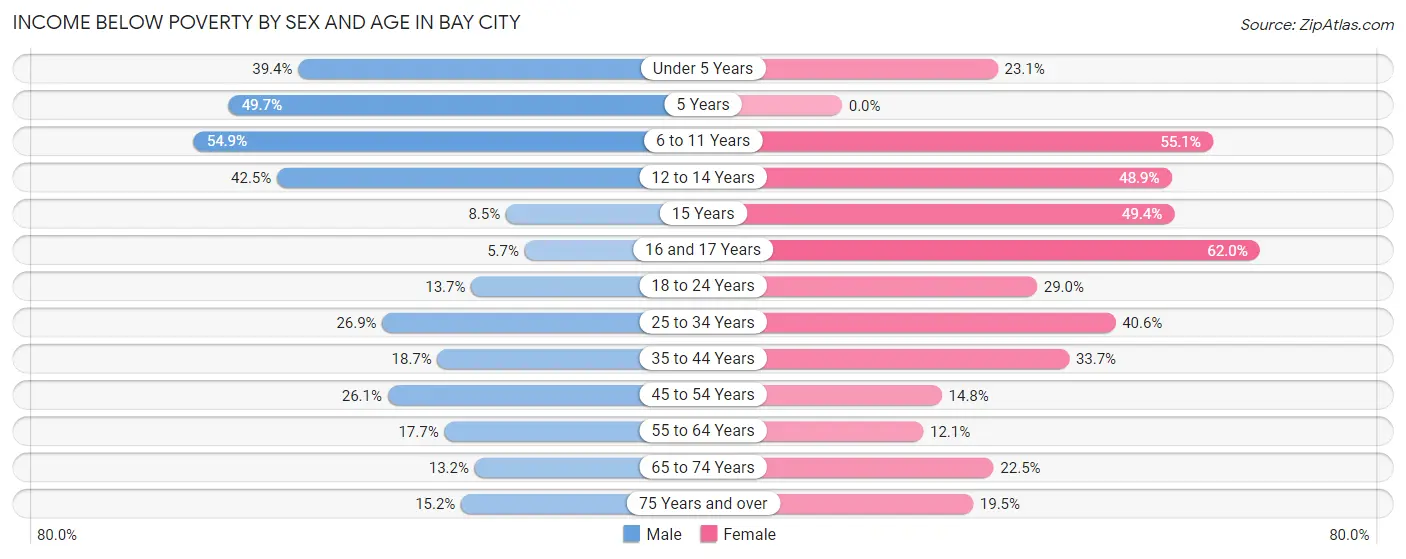
| Age Bracket | Male | Female |
| Under 5 Years | 257 (39.4%) | 263 (23.1%) |
| 5 Years | 77 (49.7%) | 0 (0.0%) |
| 6 to 11 Years | 400 (54.9%) | 522 (55.1%) |
| 12 to 14 Years | 170 (42.5%) | 251 (48.9%) |
| 15 Years | 12 (8.5%) | 38 (49.3%) |
| 16 and 17 Years | 11 (5.7%) | 116 (62.0%) |
| 18 to 24 Years | 115 (13.7%) | 289 (29.0%) |
| 25 to 34 Years | 415 (26.9%) | 473 (40.6%) |
| 35 to 44 Years | 155 (18.7%) | 480 (33.7%) |
| 45 to 54 Years | 188 (26.1%) | 103 (14.8%) |
| 55 to 64 Years | 156 (17.6%) | 116 (12.1%) |
| 65 to 74 Years | 89 (13.2%) | 174 (22.5%) |
| 75 Years and over | 64 (15.2%) | 80 (19.5%) |
| Total | 2,109 (25.8%) | 2,905 (31.1%) |
Income Above Poverty by Sex and Age in Bay City
According to the poverty statistics in Bay City, males aged 16 and 17 years and females aged 5 years are the age groups that are most secure financially, with 94.3% of males and 100.0% of females in these age groups living above the poverty line.
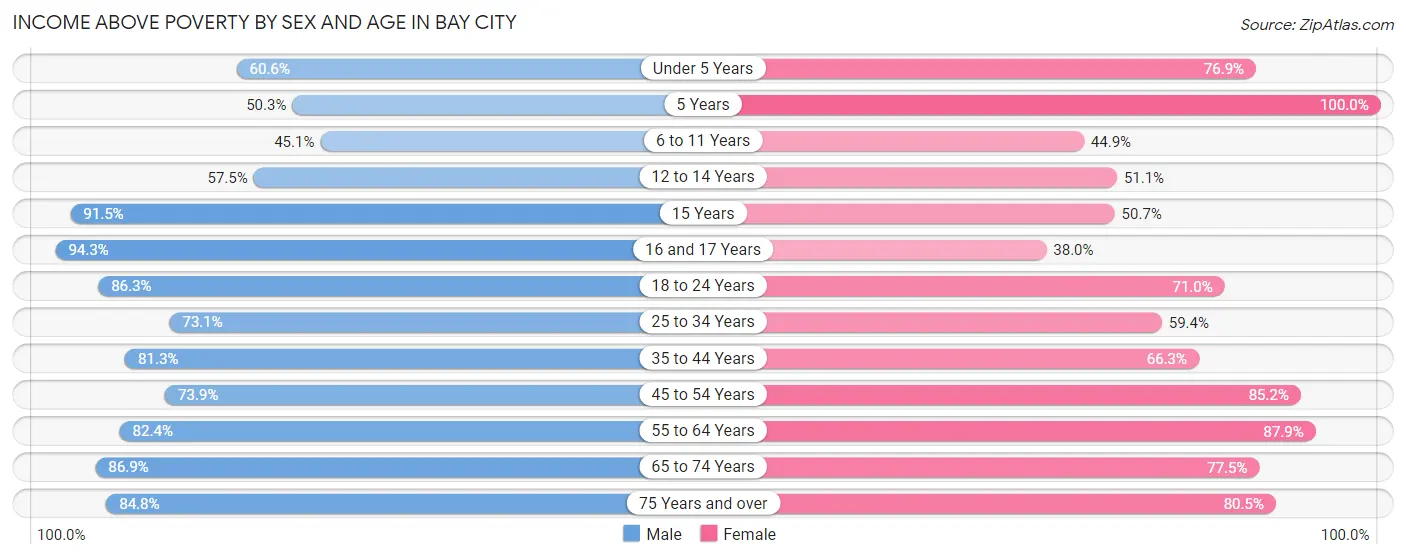
| Age Bracket | Male | Female |
| Under 5 Years | 396 (60.6%) | 874 (76.9%) |
| 5 Years | 78 (50.3%) | 62 (100.0%) |
| 6 to 11 Years | 329 (45.1%) | 426 (44.9%) |
| 12 to 14 Years | 230 (57.5%) | 262 (51.1%) |
| 15 Years | 129 (91.5%) | 39 (50.6%) |
| 16 and 17 Years | 181 (94.3%) | 71 (38.0%) |
| 18 to 24 Years | 726 (86.3%) | 709 (71.0%) |
| 25 to 34 Years | 1,130 (73.1%) | 692 (59.4%) |
| 35 to 44 Years | 675 (81.3%) | 943 (66.3%) |
| 45 to 54 Years | 533 (73.9%) | 592 (85.2%) |
| 55 to 64 Years | 728 (82.4%) | 846 (87.9%) |
| 65 to 74 Years | 588 (86.9%) | 599 (77.5%) |
| 75 Years and over | 358 (84.8%) | 331 (80.5%) |
| Total | 6,081 (74.3%) | 6,446 (68.9%) |
Income Below Poverty Among Married-Couple Families in Bay City
The poverty statistics for married-couple families in Bay City show that 18.6% or 538 of the total 2,886 families live below the poverty line. Families with 5 or more children have the highest poverty rate of 84.1%, comprising of 53 families. On the other hand, families with 1 or 2 children have the lowest poverty rate of 4.6%, which includes 38 families.
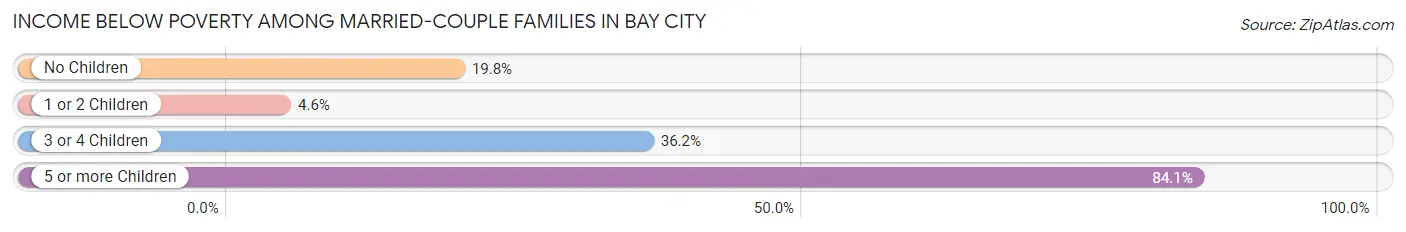
| Children | Above Poverty | Below Poverty |
| No Children | 1,353 (80.2%) | 333 (19.8%) |
| 1 or 2 Children | 784 (95.4%) | 38 (4.6%) |
| 3 or 4 Children | 201 (63.8%) | 114 (36.2%) |
| 5 or more Children | 10 (15.9%) | 53 (84.1%) |
| Total | 2,348 (81.4%) | 538 (18.6%) |
Income Below Poverty Among Single-Parent Households in Bay City
According to the poverty data in Bay City, 6.1% or 14 single-father households and 51.5% or 671 single-mother households are living below the poverty line. Among single-father households, those with 1 or 2 children have the highest poverty rate, with 14 households (15.9%) experiencing poverty. Likewise, among single-mother households, those with 5 or more children have the highest poverty rate, with 33 households (100.0%) falling below the poverty line.
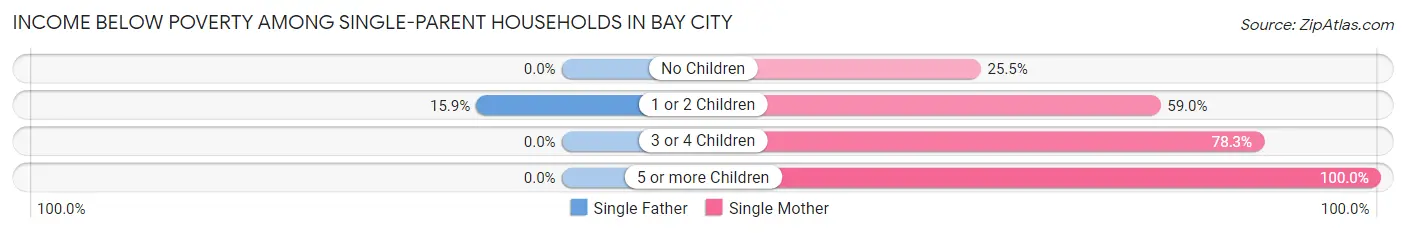
| Children | Single Father | Single Mother |
| No Children | 0 (0.0%) | 101 (25.5%) |
| 1 or 2 Children | 14 (15.9%) | 447 (59.0%) |
| 3 or 4 Children | 0 (0.0%) | 90 (78.3%) |
| 5 or more Children | 0 (0.0%) | 33 (100.0%) |
| Total | 14 (6.1%) | 671 (51.5%) |
Income Below Poverty Among Married-Couple vs Single-Parent Households in Bay City
The poverty data for Bay City shows that 538 of the married-couple family households (18.6%) and 685 of the single-parent households (44.7%) are living below the poverty level. Within the married-couple family households, those with 5 or more children have the highest poverty rate, with 53 households (84.1%) falling below the poverty line. Among the single-parent households, those with 5 or more children have the highest poverty rate, with 33 household (100.0%) living below poverty.
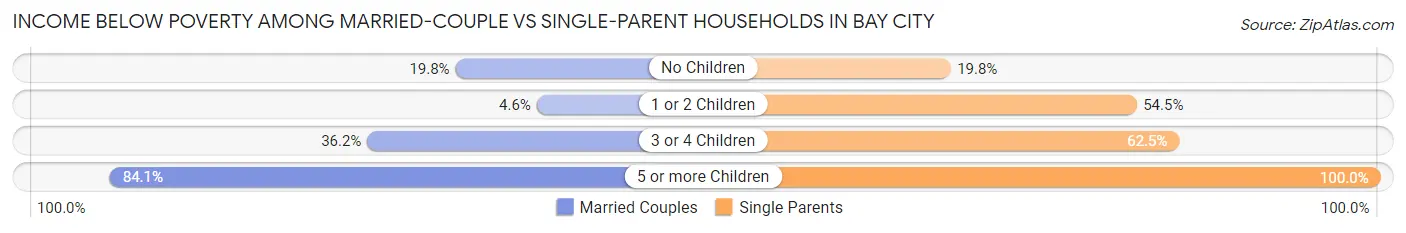
| Children | Married-Couple Families | Single-Parent Households |
| No Children | 333 (19.8%) | 101 (19.8%) |
| 1 or 2 Children | 38 (4.6%) | 461 (54.5%) |
| 3 or 4 Children | 114 (36.2%) | 90 (62.5%) |
| 5 or more Children | 53 (84.1%) | 33 (100.0%) |
| Total | 538 (18.6%) | 685 (44.7%) |
Race in Bay City
The most populous races in Bay City are Hispanic or Latino (10,190 | 57.0%), White / Caucasian (8,143 | 45.6%), and Some other Race (4,753 | 26.6%).
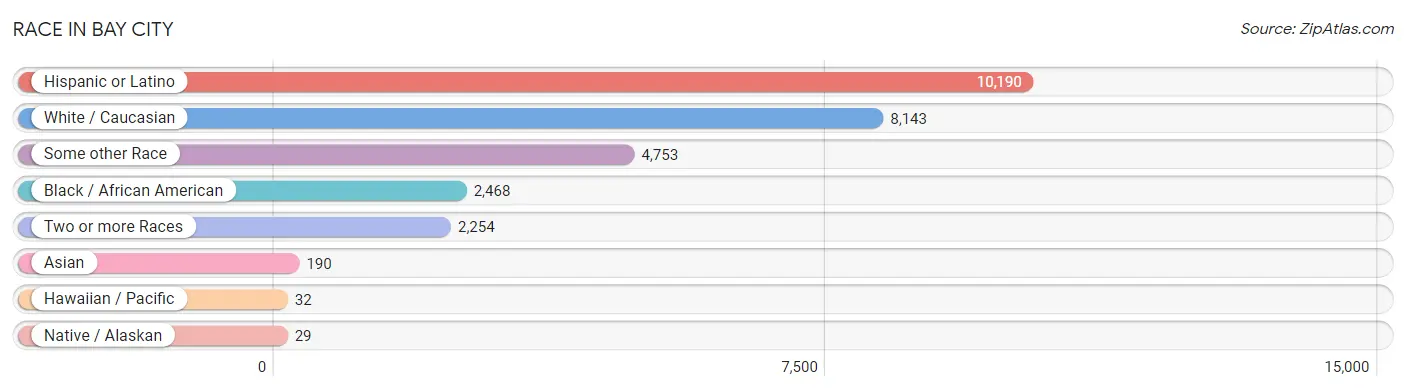
| Race | # Population | % Population |
| Asian | 190 | 1.1% |
| Black / African American | 2,468 | 13.8% |
| Hawaiian / Pacific | 32 | 0.2% |
| Hispanic or Latino | 10,190 | 57.0% |
| Native / Alaskan | 29 | 0.2% |
| White / Caucasian | 8,143 | 45.6% |
| Two or more Races | 2,254 | 12.6% |
| Some other Race | 4,753 | 26.6% |
| Total | 17,869 | 100.0% |
Ancestry in Bay City
The most populous ancestries reported in Bay City are Mexican (8,356 | 46.8%), Irish (964 | 5.4%), English (855 | 4.8%), German (796 | 4.4%), and American (475 | 2.7%), together accounting for 64.0% of all Bay City residents.
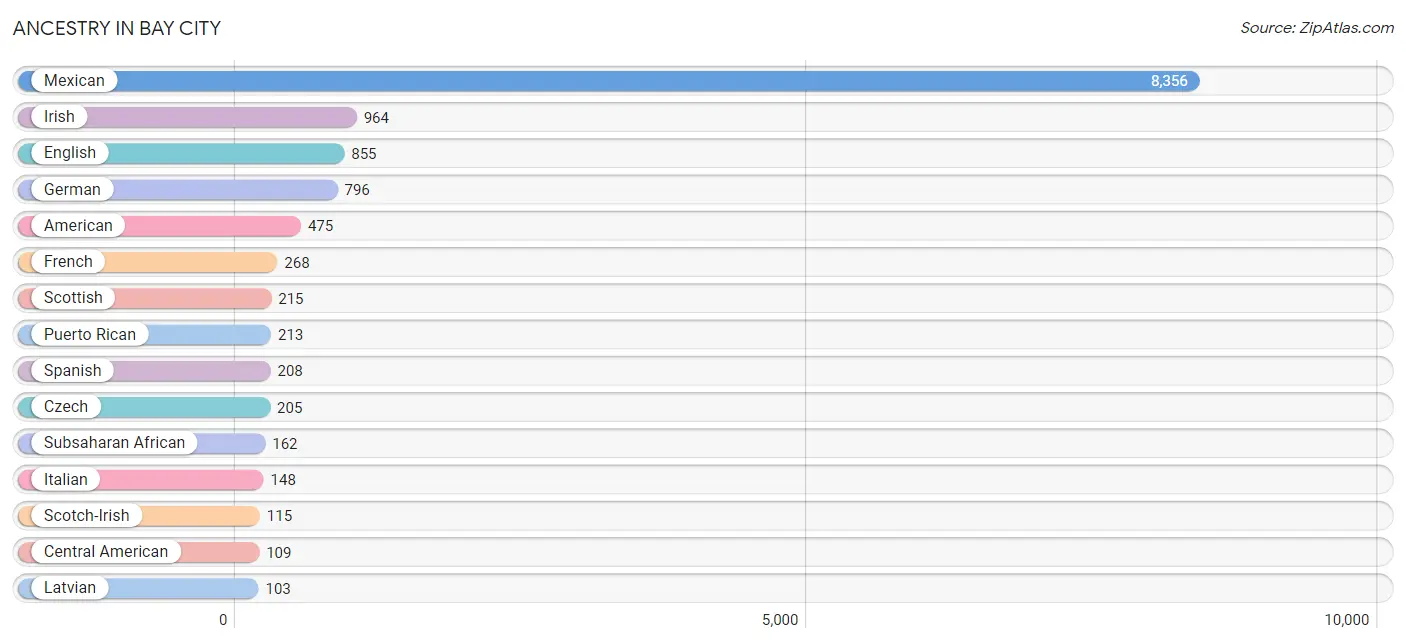
| Ancestry | # Population | % Population |
| African | 13 | 0.1% |
| American | 475 | 2.7% |
| Arab | 7 | 0.0% |
| Argentinean | 41 | 0.2% |
| Austrian | 36 | 0.2% |
| Bhutanese | 8 | 0.0% |
| British | 40 | 0.2% |
| Cajun | 15 | 0.1% |
| Central American | 109 | 0.6% |
| Costa Rican | 13 | 0.1% |
| Cuban | 9 | 0.1% |
| Czech | 205 | 1.1% |
| Czechoslovakian | 4 | 0.0% |
| Danish | 7 | 0.0% |
| Dutch | 61 | 0.3% |
| Eastern European | 4 | 0.0% |
| English | 855 | 4.8% |
| European | 74 | 0.4% |
| Filipino | 55 | 0.3% |
| French | 268 | 1.5% |
| French Canadian | 27 | 0.2% |
| German | 796 | 4.4% |
| Greek | 36 | 0.2% |
| Irish | 964 | 5.4% |
| Italian | 148 | 0.8% |
| Korean | 13 | 0.1% |
| Latvian | 103 | 0.6% |
| Mexican | 8,356 | 46.8% |
| Mexican American Indian | 85 | 0.5% |
| Native Hawaiian | 32 | 0.2% |
| Nigerian | 27 | 0.2% |
| Northern European | 48 | 0.3% |
| Norwegian | 12 | 0.1% |
| Panamanian | 30 | 0.2% |
| Polish | 38 | 0.2% |
| Puerto Rican | 213 | 1.2% |
| Salvadoran | 66 | 0.4% |
| Scandinavian | 8 | 0.0% |
| Scotch-Irish | 115 | 0.6% |
| Scottish | 215 | 1.2% |
| South African | 66 | 0.4% |
| South American | 57 | 0.3% |
| South American Indian | 16 | 0.1% |
| Spaniard | 25 | 0.1% |
| Spanish | 208 | 1.2% |
| Subsaharan African | 162 | 0.9% |
| Swedish | 15 | 0.1% |
| Syrian | 7 | 0.0% |
| Thai | 10 | 0.1% |
| Ukrainian | 8 | 0.0% |
| Venezuelan | 16 | 0.1% |
| Welsh | 22 | 0.1% | View All 52 Rows |
Immigrants in Bay City
The most numerous immigrant groups reported in Bay City came from Latin America (1,964 | 11.0%), Central America (1,888 | 10.6%), Mexico (1,825 | 10.2%), Europe (274 | 1.5%), and Eastern Europe (181 | 1.0%), together accounting for 34.3% of all Bay City residents.
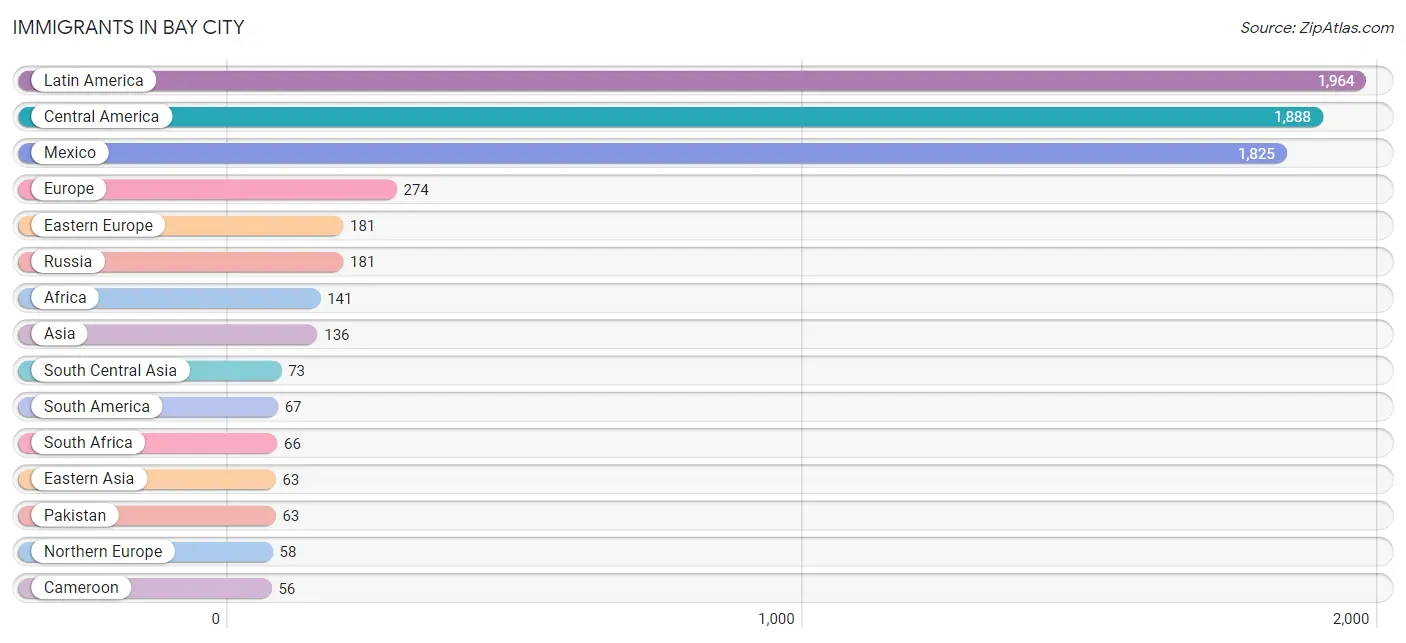
| Immigration Origin | # Population | % Population |
| Africa | 141 | 0.8% |
| Argentina | 41 | 0.2% |
| Asia | 136 | 0.8% |
| Cameroon | 56 | 0.3% |
| Caribbean | 9 | 0.1% |
| Central America | 1,888 | 10.6% |
| China | 55 | 0.3% |
| Costa Rica | 13 | 0.1% |
| Cuba | 9 | 0.1% |
| Eastern Asia | 63 | 0.4% |
| Eastern Europe | 181 | 1.0% |
| El Salvador | 16 | 0.1% |
| Europe | 274 | 1.5% |
| Germany | 6 | 0.0% |
| Guatemala | 4 | 0.0% |
| India | 10 | 0.1% |
| Italy | 29 | 0.2% |
| Japan | 8 | 0.0% |
| Latin America | 1,964 | 11.0% |
| Mexico | 1,825 | 10.2% |
| Middle Africa | 56 | 0.3% |
| Nigeria | 19 | 0.1% |
| Northern Europe | 58 | 0.3% |
| Norway | 8 | 0.0% |
| Pakistan | 63 | 0.4% |
| Panama | 30 | 0.2% |
| Russia | 181 | 1.0% |
| South Africa | 66 | 0.4% |
| South America | 67 | 0.4% |
| South Central Asia | 73 | 0.4% |
| Southern Europe | 29 | 0.2% |
| Taiwan | 55 | 0.3% |
| Venezuela | 26 | 0.2% |
| Western Africa | 19 | 0.1% |
| Western Europe | 6 | 0.0% | View All 35 Rows |
Sex and Age in Bay City
Sex and Age in Bay City
The most populous age groups in Bay City are 30 to 34 Years (860 | 10.3%) for men and Under 5 Years (1,137 | 11.9%) for women.
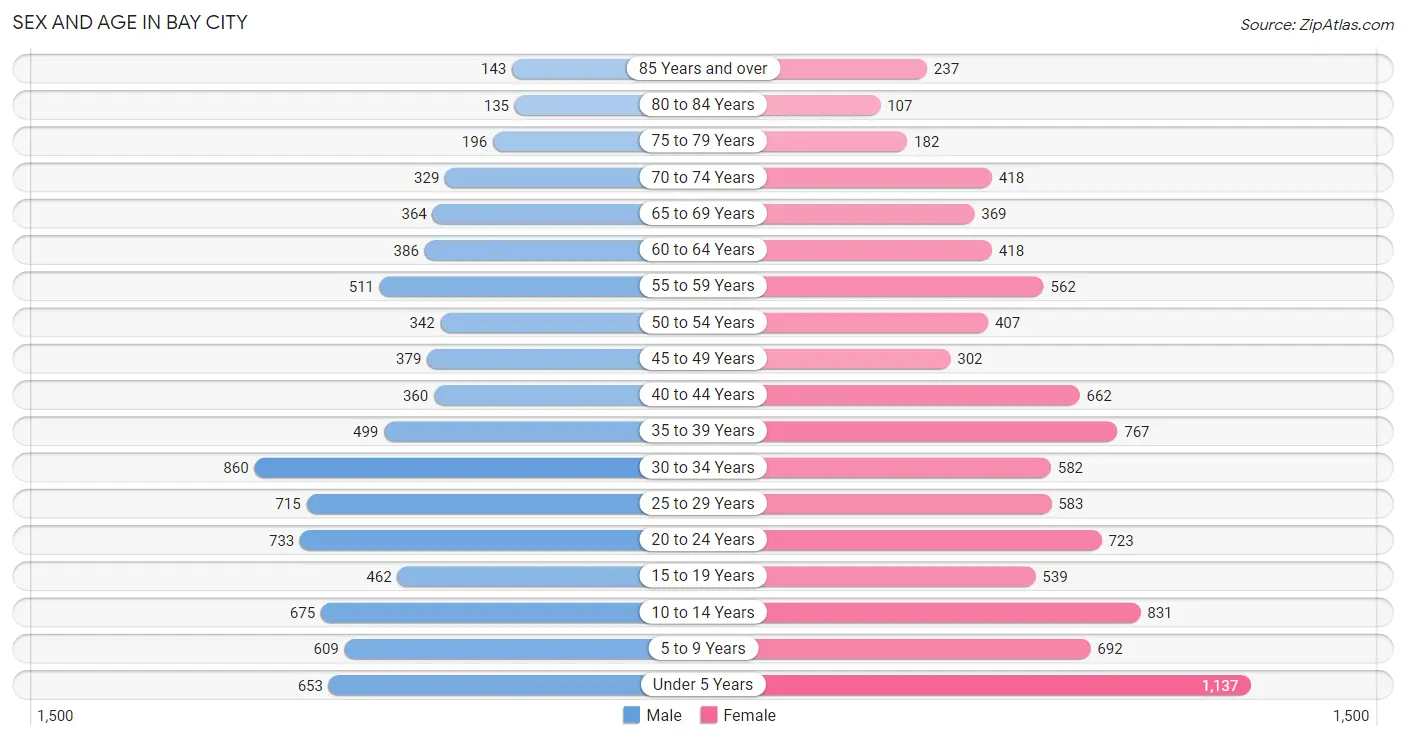
| Age Bracket | Male | Female |
| Under 5 Years | 653 (7.8%) | 1,137 (11.9%) |
| 5 to 9 Years | 609 (7.3%) | 692 (7.3%) |
| 10 to 14 Years | 675 (8.1%) | 831 (8.7%) |
| 15 to 19 Years | 462 (5.5%) | 539 (5.7%) |
| 20 to 24 Years | 733 (8.8%) | 723 (7.6%) |
| 25 to 29 Years | 715 (8.6%) | 583 (6.1%) |
| 30 to 34 Years | 860 (10.3%) | 582 (6.1%) |
| 35 to 39 Years | 499 (6.0%) | 767 (8.1%) |
| 40 to 44 Years | 360 (4.3%) | 662 (7.0%) |
| 45 to 49 Years | 379 (4.5%) | 302 (3.2%) |
| 50 to 54 Years | 342 (4.1%) | 407 (4.3%) |
| 55 to 59 Years | 511 (6.1%) | 562 (5.9%) |
| 60 to 64 Years | 386 (4.6%) | 418 (4.4%) |
| 65 to 69 Years | 364 (4.4%) | 369 (3.9%) |
| 70 to 74 Years | 329 (3.9%) | 418 (4.4%) |
| 75 to 79 Years | 196 (2.4%) | 182 (1.9%) |
| 80 to 84 Years | 135 (1.6%) | 107 (1.1%) |
| 85 Years and over | 143 (1.7%) | 237 (2.5%) |
| Total | 8,351 (100.0%) | 9,518 (100.0%) |
Families and Households in Bay City
Median Family Size in Bay City
The median family size in Bay City is 3.37 persons per family, with married-couple families (2,886 | 65.3%) accounting for the largest median family size of 3.49 persons per family. On the other hand, single male/father families (230 | 5.2%) represent the smallest median family size with 2.48 persons per family.
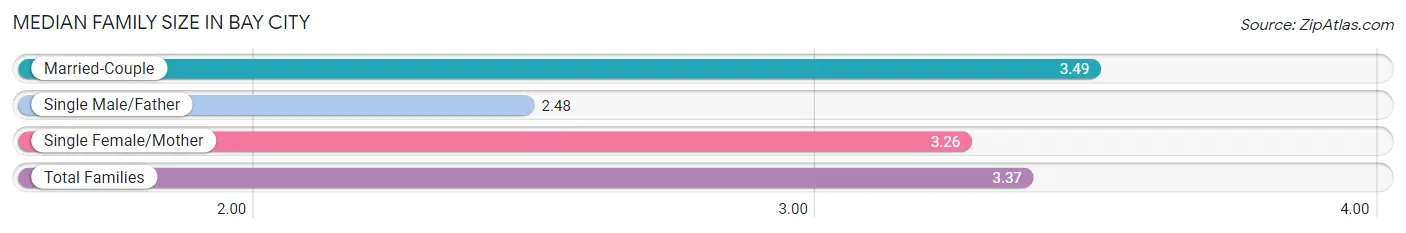
| Family Type | # Families | Family Size |
| Married-Couple | 2,886 (65.3%) | 3.49 |
| Single Male/Father | 230 (5.2%) | 2.48 |
| Single Female/Mother | 1,302 (29.5%) | 3.26 |
| Total Families | 4,418 (100.0%) | 3.37 |
Median Household Size in Bay City
The median household size in Bay City is 2.63 persons per household, with married-couple households (2,886 | 43.2%) accounting for the largest median household size of 3.49 persons per household. non-family households (2,256 | 33.8%) represent the smallest median household size with 1.04 persons per household.
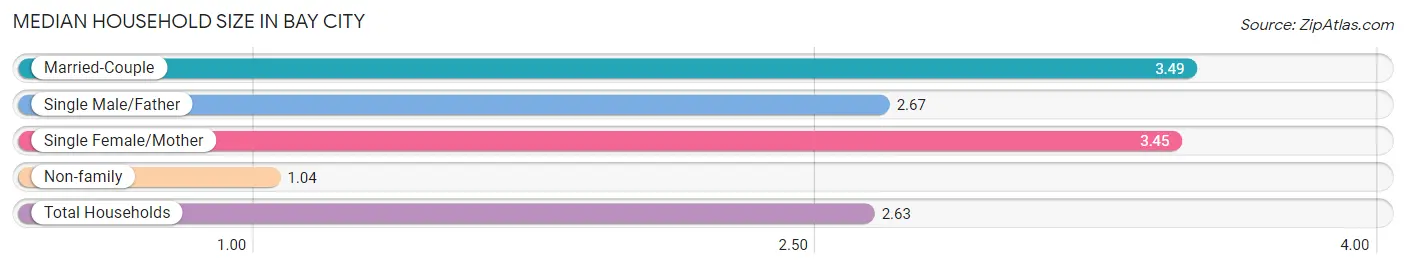
| Household Type | # Households | Household Size |
| Married-Couple | 2,886 (43.2%) | 3.49 |
| Single Male/Father | 230 (3.5%) | 2.67 |
| Single Female/Mother | 1,302 (19.5%) | 3.45 |
| Non-family | 2,256 (33.8%) | 1.04 |
| Total Households | 6,674 (100.0%) | 2.63 |
Household Size by Marriage Status in Bay City
Out of a total of 6,674 households in Bay City, 4,418 (66.2%) are family households, while 2,256 (33.8%) are nonfamily households. The most numerous type of family households are 2-person households, comprising 1,817, and the most common type of nonfamily households are 1-person households, comprising 2,148.
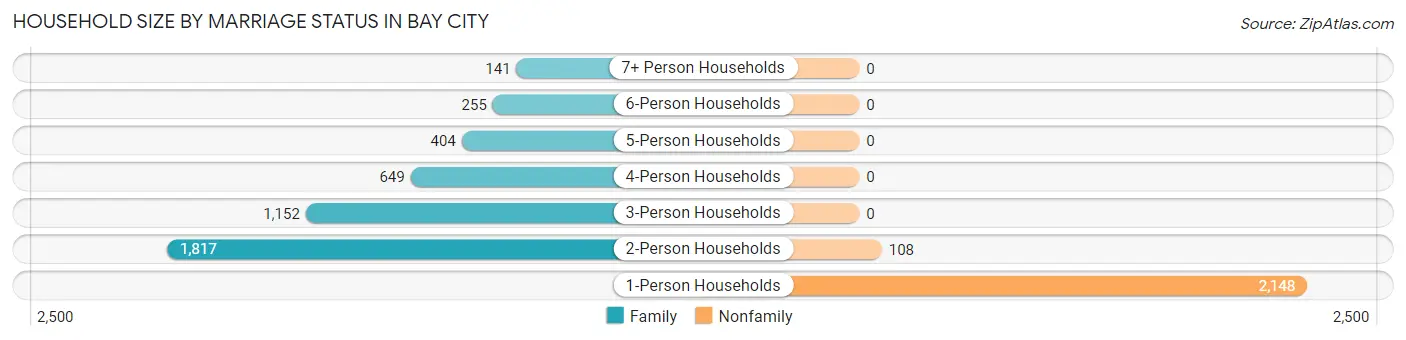
| Household Size | Family Households | Nonfamily Households |
| 1-Person Households | - | 2,148 (32.2%) |
| 2-Person Households | 1,817 (27.2%) | 108 (1.6%) |
| 3-Person Households | 1,152 (17.3%) | 0 (0.0%) |
| 4-Person Households | 649 (9.7%) | 0 (0.0%) |
| 5-Person Households | 404 (6.0%) | 0 (0.0%) |
| 6-Person Households | 255 (3.8%) | 0 (0.0%) |
| 7+ Person Households | 141 (2.1%) | 0 (0.0%) |
| Total | 4,418 (66.2%) | 2,256 (33.8%) |
Female Fertility in Bay City
Fertility by Age in Bay City
Average fertility rate in Bay City is 59.0 births per 1,000 women. Women in the age bracket of 15 to 19 years have the highest fertility rate with 98.0 births per 1,000 women. Women in the age bracket of 20 to 34 years acount for 54.8% of all women with births.
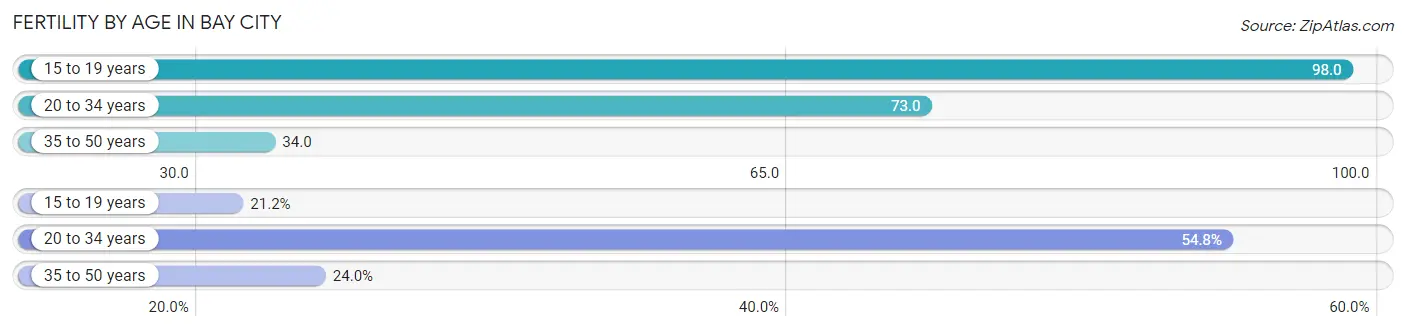
| Age Bracket | Women with Births | Births / 1,000 Women |
| 15 to 19 years | 53 (21.2%) | 98.0 |
| 20 to 34 years | 137 (54.8%) | 73.0 |
| 35 to 50 years | 60 (24.0%) | 34.0 |
| Total | 250 (100.0%) | 59.0 |
Fertility by Age by Marriage Status in Bay City
46.4% of women with births (250) in Bay City are married. The highest percentage of unmarried women with births falls into 15 to 19 years age bracket with 100.0% of them unmarried at the time of birth, while the lowest percentage of unmarried women with births belong to 20 to 34 years age bracket with 38.0% of them unmarried.
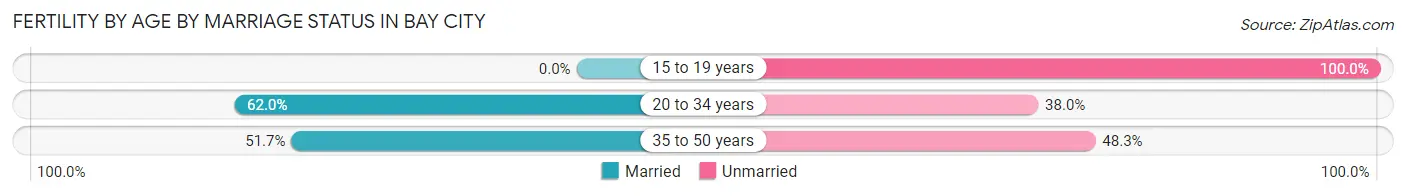
| Age Bracket | Married | Unmarried |
| 15 to 19 years | 0 (0.0%) | 53 (100.0%) |
| 20 to 34 years | 85 (62.0%) | 52 (38.0%) |
| 35 to 50 years | 31 (51.7%) | 29 (48.3%) |
| Total | 116 (46.4%) | 134 (53.6%) |
Fertility by Education in Bay City
Average fertility rate in Bay City is 59.0 births per 1,000 women. Women with the education attainment of bachelor's degree have the highest fertility rate of 160.0 births per 1,000 women, while women with the education attainment of college or associate's degree have the lowest fertility at 6.0 births per 1,000 women. Women with the education attainment of high school diploma represent 36.8% of all women with births.
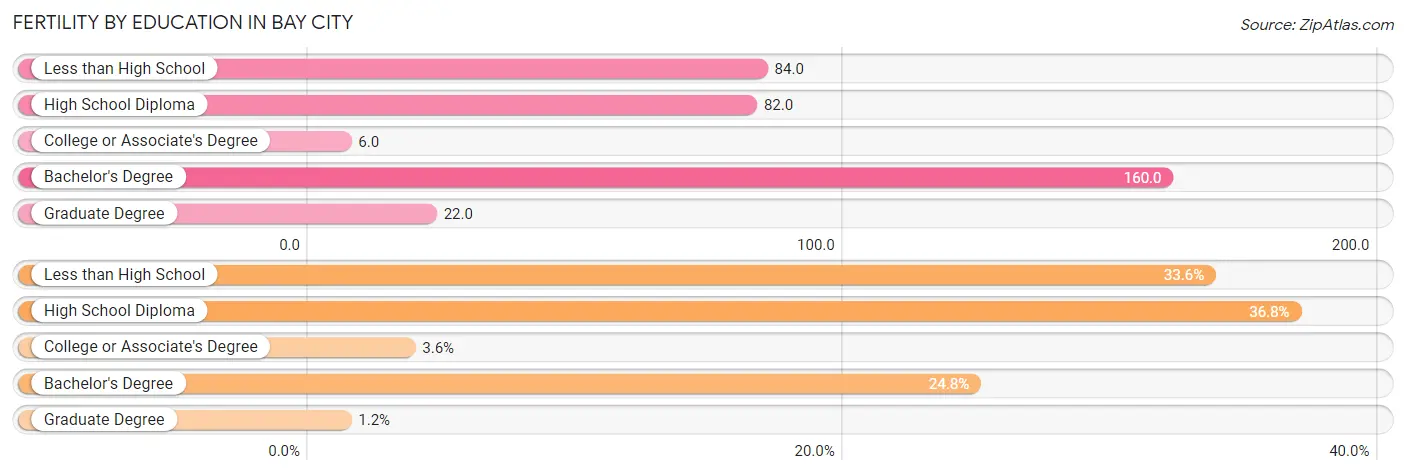
| Educational Attainment | Women with Births | Births / 1,000 Women |
| Less than High School | 84 (33.6%) | 84.0 |
| High School Diploma | 92 (36.8%) | 82.0 |
| College or Associate's Degree | 9 (3.6%) | 6.0 |
| Bachelor's Degree | 62 (24.8%) | 160.0 |
| Graduate Degree | 3 (1.2%) | 22.0 |
| Total | 250 (100.0%) | 59.0 |
Fertility by Education by Marriage Status in Bay City
53.6% of women with births in Bay City are unmarried. Women with the educational attainment of bachelor's degree are most likely to be married with 100.0% of them married at childbirth, while women with the educational attainment of less than high school are least likely to be married with 100.0% of them unmarried at childbirth.
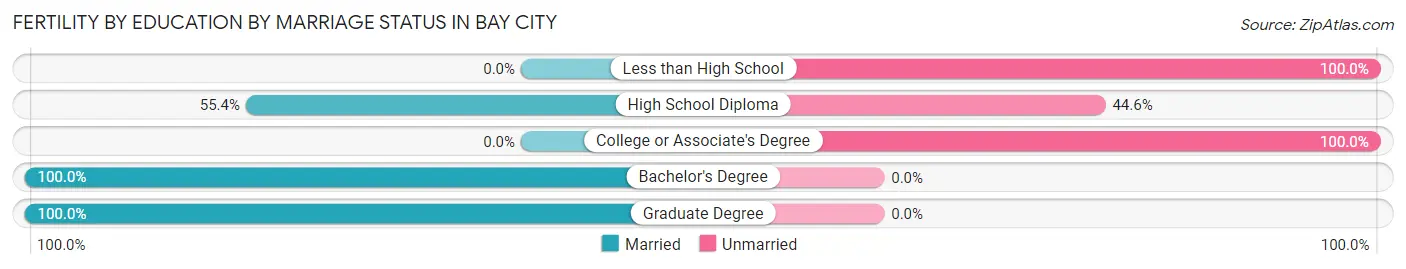
| Educational Attainment | Married | Unmarried |
| Less than High School | 0 (0.0%) | 84 (100.0%) |
| High School Diploma | 51 (55.4%) | 41 (44.6%) |
| College or Associate's Degree | 0 (0.0%) | 9 (100.0%) |
| Bachelor's Degree | 62 (100.0%) | 0 (0.0%) |
| Graduate Degree | 3 (100.0%) | 0 (0.0%) |
| Total | 116 (46.4%) | 134 (53.6%) |
Employment Characteristics in Bay City
Employment by Class of Employer in Bay City
Among the 6,810 employed individuals in Bay City, private company employees (5,051 | 74.2%), local government employees (594 | 8.7%), and self-employed (not incorporated) (516 | 7.6%) make up the most common classes of employment.
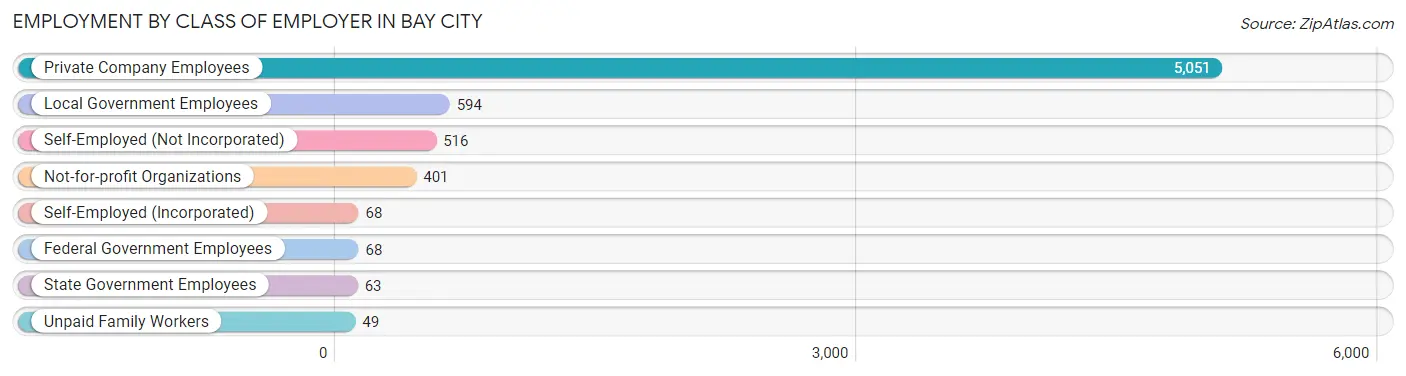
| Employer Class | # Employees | % Employees |
| Private Company Employees | 5,051 | 74.2% |
| Self-Employed (Incorporated) | 68 | 1.0% |
| Self-Employed (Not Incorporated) | 516 | 7.6% |
| Not-for-profit Organizations | 401 | 5.9% |
| Local Government Employees | 594 | 8.7% |
| State Government Employees | 63 | 0.9% |
| Federal Government Employees | 68 | 1.0% |
| Unpaid Family Workers | 49 | 0.7% |
| Total | 6,810 | 100.0% |
Employment Status by Age in Bay City
According to the labor force statistics for Bay City, out of the total population over 16 years of age (13,053), 59.4% or 7,753 individuals are in the labor force, with 11.1% or 861 of them unemployed. The age group with the highest labor force participation rate is 30 to 34 years, with 85.5% or 1,233 individuals in the labor force. Within the labor force, the 60 to 64 years age range has the highest percentage of unemployed individuals, with 27.1% or 105 of them being unemployed.
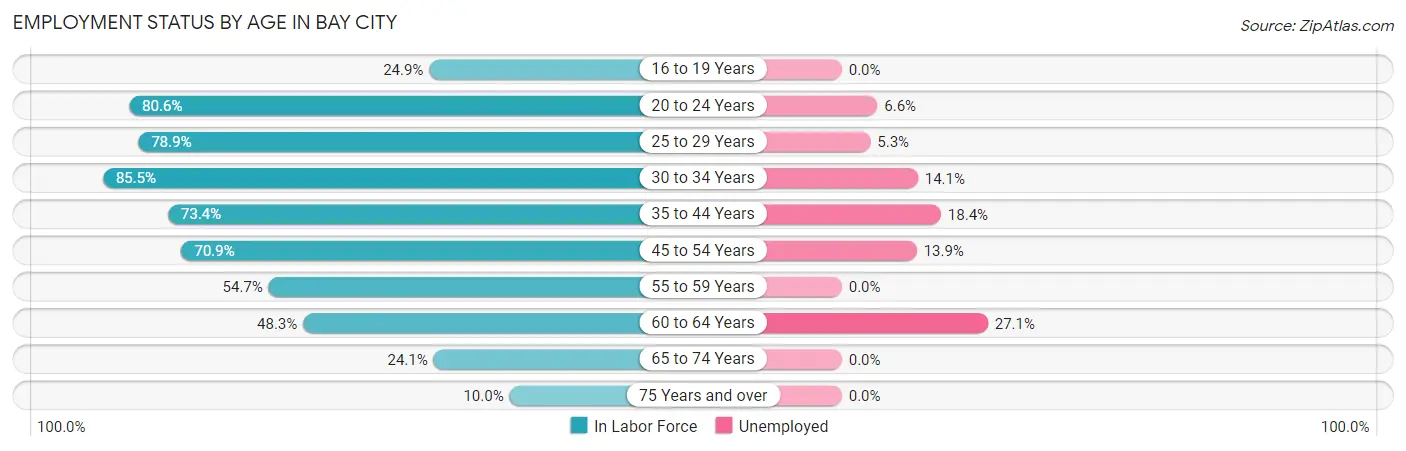
| Age Bracket | In Labor Force | Unemployed |
| 16 to 19 Years | 195 (24.9%) | 0 (0.0%) |
| 20 to 24 Years | 1,174 (80.6%) | 77 (6.6%) |
| 25 to 29 Years | 1,024 (78.9%) | 54 (5.3%) |
| 30 to 34 Years | 1,233 (85.5%) | 174 (14.1%) |
| 35 to 44 Years | 1,679 (73.4%) | 309 (18.4%) |
| 45 to 54 Years | 1,014 (70.9%) | 141 (13.9%) |
| 55 to 59 Years | 587 (54.7%) | 0 (0.0%) |
| 60 to 64 Years | 388 (48.3%) | 105 (27.1%) |
| 65 to 74 Years | 357 (24.1%) | 0 (0.0%) |
| 75 Years and over | 100 (10.0%) | 0 (0.0%) |
| Total | 7,753 (59.4%) | 861 (11.1%) |
Employment Status by Educational Attainment in Bay City
According to labor force statistics for Bay City, 71.1% of individuals (5,926) out of the total population between 25 and 64 years of age (8,335) are in the labor force, with 13.2% or 782 of them being unemployed. The group with the highest labor force participation rate are those with the educational attainment of college / associate degree, with 76.8% or 2,032 individuals in the labor force. Within the labor force, individuals with bachelor's degree or higher education have the highest percentage of unemployment, with 16.2% or 206 of them being unemployed.
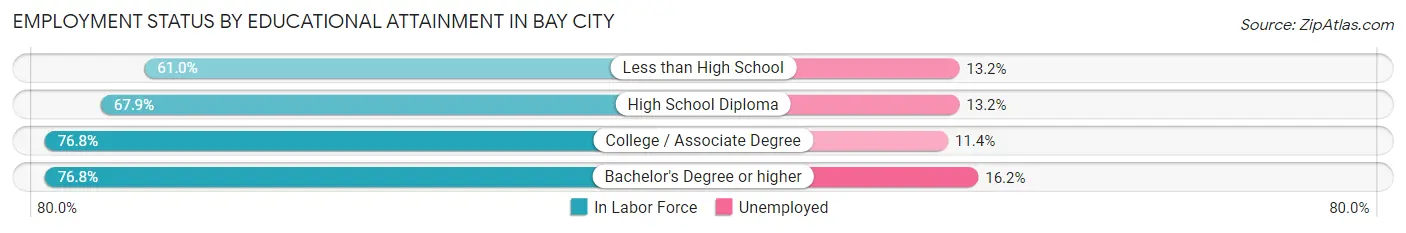
| Educational Attainment | In Labor Force | Unemployed |
| Less than High School | 1,016 (61.0%) | 220 (13.2%) |
| High School Diploma | 1,607 (67.9%) | 312 (13.2%) |
| College / Associate Degree | 2,032 (76.8%) | 302 (11.4%) |
| Bachelor's Degree or higher | 1,273 (76.8%) | 269 (16.2%) |
| Total | 5,926 (71.1%) | 1,100 (13.2%) |
Employment Occupations by Sex in Bay City
Management, Business, Science and Arts Occupations
The most common Management, Business, Science and Arts occupations in Bay City are Community & Social Service (586 | 8.5%), Education Instruction & Library (400 | 5.8%), Management (371 | 5.4%), Computers, Engineering & Science (346 | 5.0%), and Architecture & Engineering (317 | 4.6%).
Management, Business, Science and Arts Occupations by Sex
Within the Management, Business, Science and Arts occupations in Bay City, the most male-oriented occupations are Computers & Mathematics (100.0%), Computers, Engineering & Science (98.6%), and Architecture & Engineering (98.4%), while the most female-oriented occupations are Education Instruction & Library (96.8%), Business & Financial (91.3%), and Health Diagnosing & Treating (89.3%).
| Occupation | Male | Female |
| Management | 257 (69.3%) | 114 (30.7%) |
| Business & Financial | 8 (8.7%) | 84 (91.3%) |
| Computers, Engineering & Science | 341 (98.6%) | 5 (1.5%) |
| Computers & Mathematics | 29 (100.0%) | 0 (0.0%) |
| Architecture & Engineering | 312 (98.4%) | 5 (1.6%) |
| Life, Physical & Social Science | 0 (0.0%) | 0 (0.0%) |
| Community & Social Service | 65 (11.1%) | 521 (88.9%) |
| Education, Arts & Media | 18 (47.4%) | 20 (52.6%) |
| Legal Services & Support | 6 (15.8%) | 32 (84.2%) |
| Education Instruction & Library | 13 (3.3%) | 387 (96.8%) |
| Arts, Media & Entertainment | 28 (25.5%) | 82 (74.6%) |
| Health Diagnosing & Treating | 28 (10.6%) | 235 (89.3%) |
| Health Technologists | 13 (10.8%) | 107 (89.2%) |
| Total (Category) | 699 (42.2%) | 959 (57.8%) |
| Total (Overall) | 3,876 (56.3%) | 3,014 (43.7%) |
Services Occupations
The most common Services occupations in Bay City are Healthcare Support (507 | 7.4%), Food Preparation & Serving (460 | 6.7%), Cleaning & Maintenance (300 | 4.3%), Security & Protection (174 | 2.5%), and Firefighting & Prevention (161 | 2.3%).
Services Occupations by Sex
Within the Services occupations in Bay City, the most male-oriented occupations are Cleaning & Maintenance (70.0%), Firefighting & Prevention (47.8%), and Security & Protection (44.3%), while the most female-oriented occupations are Healthcare Support (100.0%), Law Enforcement (100.0%), and Food Preparation & Serving (79.1%).
| Occupation | Male | Female |
| Healthcare Support | 0 (0.0%) | 507 (100.0%) |
| Security & Protection | 77 (44.3%) | 97 (55.7%) |
| Firefighting & Prevention | 77 (47.8%) | 84 (52.2%) |
| Law Enforcement | 0 (0.0%) | 13 (100.0%) |
| Food Preparation & Serving | 96 (20.9%) | 364 (79.1%) |
| Cleaning & Maintenance | 210 (70.0%) | 90 (30.0%) |
| Personal Care & Service | 38 (31.9%) | 81 (68.1%) |
| Total (Category) | 421 (27.0%) | 1,139 (73.0%) |
| Total (Overall) | 3,876 (56.3%) | 3,014 (43.7%) |
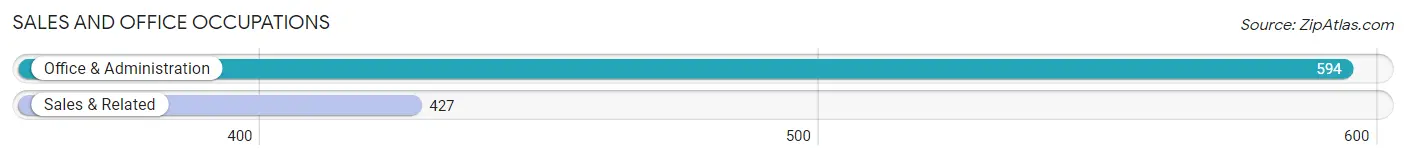
Sales and Office Occupations
The most common Sales and Office occupations in Bay City are Office & Administration (594 | 8.6%), and Sales & Related (427 | 6.2%).
Sales and Office Occupations by Sex
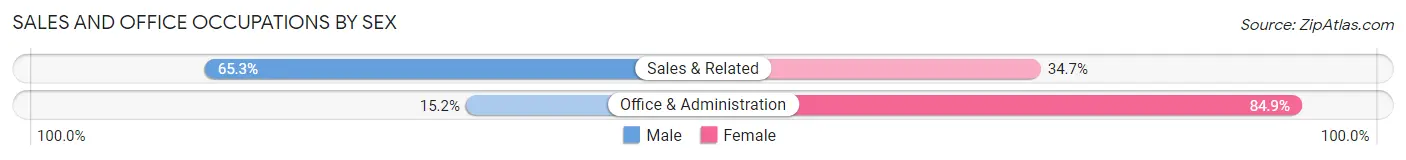
| Occupation | Male | Female |
| Sales & Related | 279 (65.3%) | 148 (34.7%) |
| Office & Administration | 90 (15.1%) | 504 (84.9%) |
| Total (Category) | 369 (36.1%) | 652 (63.9%) |
| Total (Overall) | 3,876 (56.3%) | 3,014 (43.7%) |
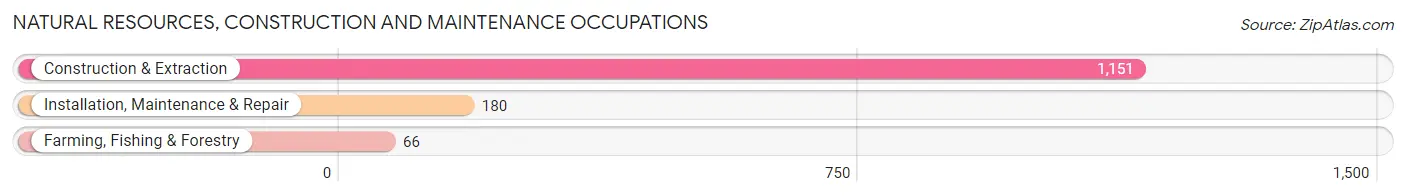
Natural Resources, Construction and Maintenance Occupations
The most common Natural Resources, Construction and Maintenance occupations in Bay City are Construction & Extraction (1,151 | 16.7%), Installation, Maintenance & Repair (180 | 2.6%), and Farming, Fishing & Forestry (66 | 1.0%).
Natural Resources, Construction and Maintenance Occupations by Sex
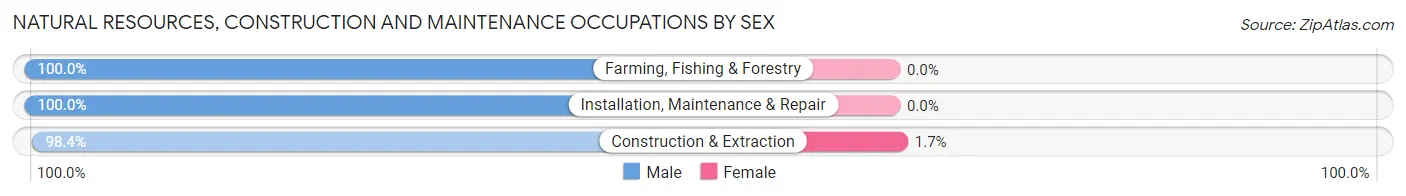
| Occupation | Male | Female |
| Farming, Fishing & Forestry | 66 (100.0%) | 0 (0.0%) |
| Construction & Extraction | 1,132 (98.4%) | 19 (1.7%) |
| Installation, Maintenance & Repair | 180 (100.0%) | 0 (0.0%) |
| Total (Category) | 1,378 (98.6%) | 19 (1.4%) |
| Total (Overall) | 3,876 (56.3%) | 3,014 (43.7%) |
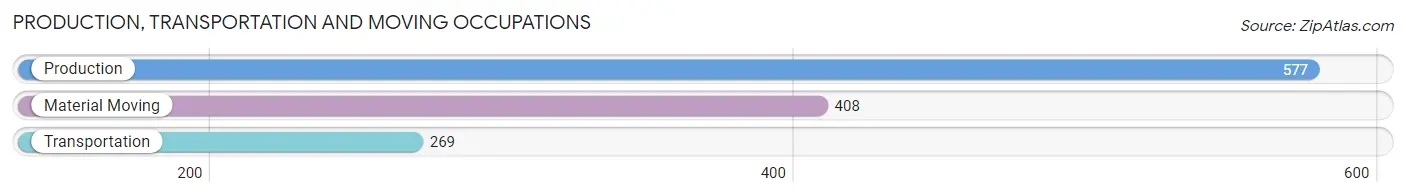
Production, Transportation and Moving Occupations
The most common Production, Transportation and Moving occupations in Bay City are Production (577 | 8.4%), Material Moving (408 | 5.9%), and Transportation (269 | 3.9%).
Production, Transportation and Moving Occupations by Sex
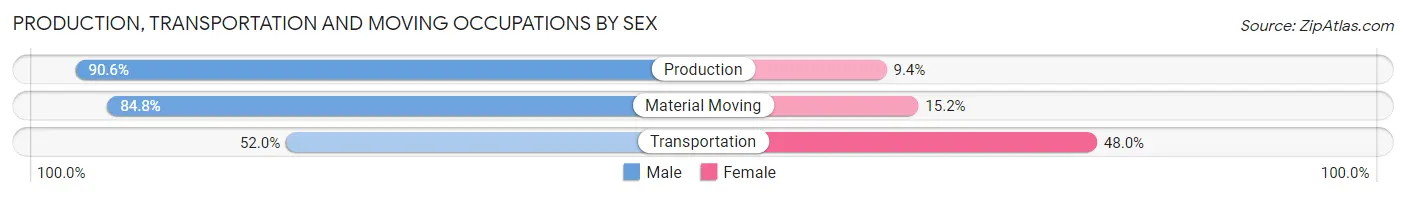
| Occupation | Male | Female |
| Production | 523 (90.6%) | 54 (9.4%) |
| Transportation | 140 (52.0%) | 129 (48.0%) |
| Material Moving | 346 (84.8%) | 62 (15.2%) |
| Total (Category) | 1,009 (80.5%) | 245 (19.5%) |
| Total (Overall) | 3,876 (56.3%) | 3,014 (43.7%) |
Employment Industries by Sex in Bay City
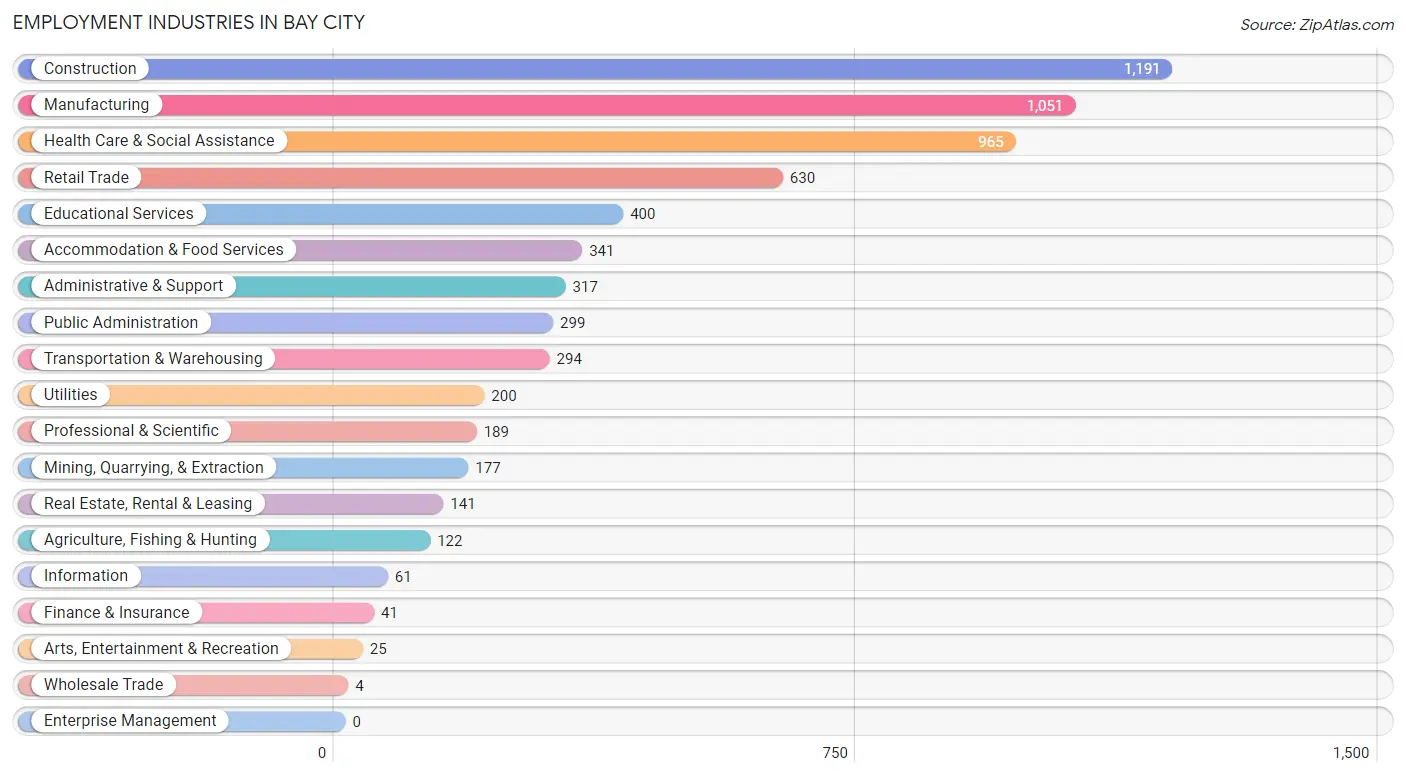
Employment Industries in Bay City
The major employment industries in Bay City include Construction (1,191 | 17.3%), Manufacturing (1,051 | 15.2%), Health Care & Social Assistance (965 | 14.0%), Retail Trade (630 | 9.1%), and Educational Services (400 | 5.8%).
Employment Industries by Sex in Bay City
The Bay City industries that see more men than women are Agriculture, Fishing & Hunting (100.0%), Mining, Quarrying, & Extraction (100.0%), and Wholesale Trade (100.0%), whereas the industries that tend to have a higher number of women are Finance & Insurance (100.0%), Educational Services (94.8%), and Health Care & Social Assistance (94.0%).
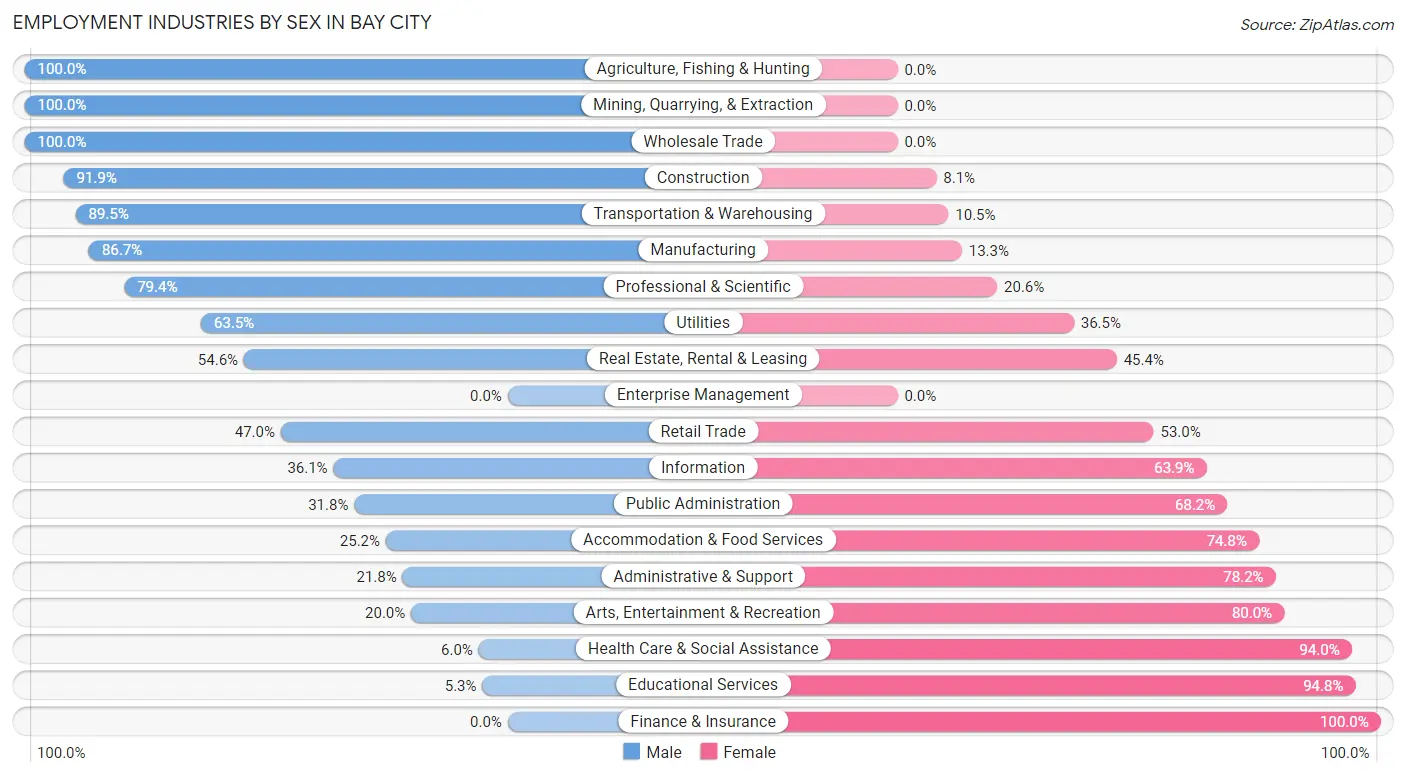
| Industry | Male | Female |
| Agriculture, Fishing & Hunting | 122 (100.0%) | 0 (0.0%) |
| Mining, Quarrying, & Extraction | 177 (100.0%) | 0 (0.0%) |
| Construction | 1,095 (91.9%) | 96 (8.1%) |
| Manufacturing | 911 (86.7%) | 140 (13.3%) |
| Wholesale Trade | 4 (100.0%) | 0 (0.0%) |
| Retail Trade | 296 (47.0%) | 334 (53.0%) |
| Transportation & Warehousing | 263 (89.5%) | 31 (10.5%) |
| Utilities | 127 (63.5%) | 73 (36.5%) |
| Information | 22 (36.1%) | 39 (63.9%) |
| Finance & Insurance | 0 (0.0%) | 41 (100.0%) |
| Real Estate, Rental & Leasing | 77 (54.6%) | 64 (45.4%) |
| Professional & Scientific | 150 (79.4%) | 39 (20.6%) |
| Enterprise Management | 0 (0.0%) | 0 (0.0%) |
| Administrative & Support | 69 (21.8%) | 248 (78.2%) |
| Educational Services | 21 (5.2%) | 379 (94.8%) |
| Health Care & Social Assistance | 58 (6.0%) | 907 (94.0%) |
| Arts, Entertainment & Recreation | 5 (20.0%) | 20 (80.0%) |
| Accommodation & Food Services | 86 (25.2%) | 255 (74.8%) |
| Public Administration | 95 (31.8%) | 204 (68.2%) |
| Total | 3,876 (56.3%) | 3,014 (43.7%) |
Education in Bay City
School Enrollment in Bay City
The most common levels of schooling among the 4,831 students in Bay City are middle school (1,421 | 29.4%), elementary school (965 | 20.0%), and high school (803 | 16.6%).
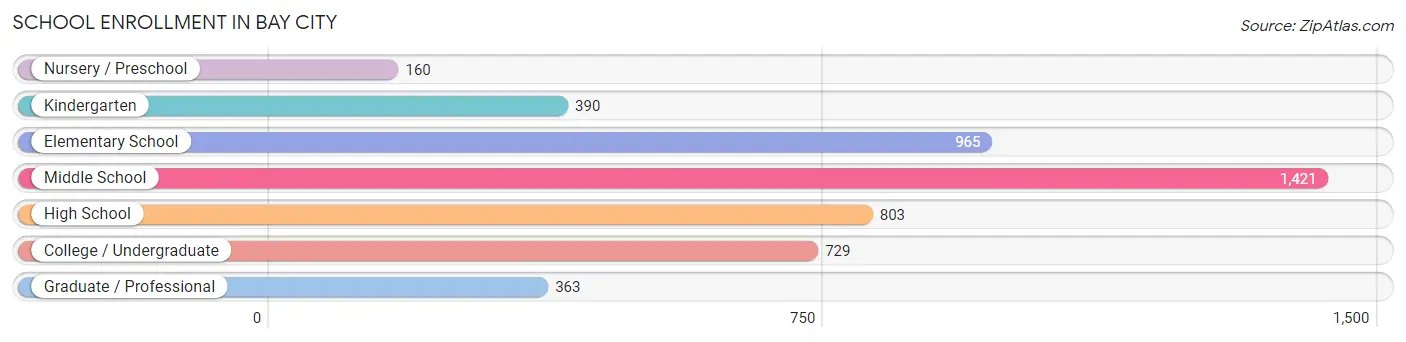
| School Level | # Students | % Students |
| Nursery / Preschool | 160 | 3.3% |
| Kindergarten | 390 | 8.1% |
| Elementary School | 965 | 20.0% |
| Middle School | 1,421 | 29.4% |
| High School | 803 | 16.6% |
| College / Undergraduate | 729 | 15.1% |
| Graduate / Professional | 363 | 7.5% |
| Total | 4,831 | 100.0% |
School Enrollment by Age by Funding Source in Bay City
Out of a total of 4,831 students who are enrolled in schools in Bay City, 348 (7.2%) attend a private institution, while the remaining 4,483 (92.8%) are enrolled in public schools. The age group of 25 to 34 year olds has the highest likelihood of being enrolled in private schools, with 83 (31.2% in the age bracket) enrolled. Conversely, the age group of 10 to 14 year olds has the lowest likelihood of being enrolled in a private school, with 1,506 (100.0% in the age bracket) attending a public institution.
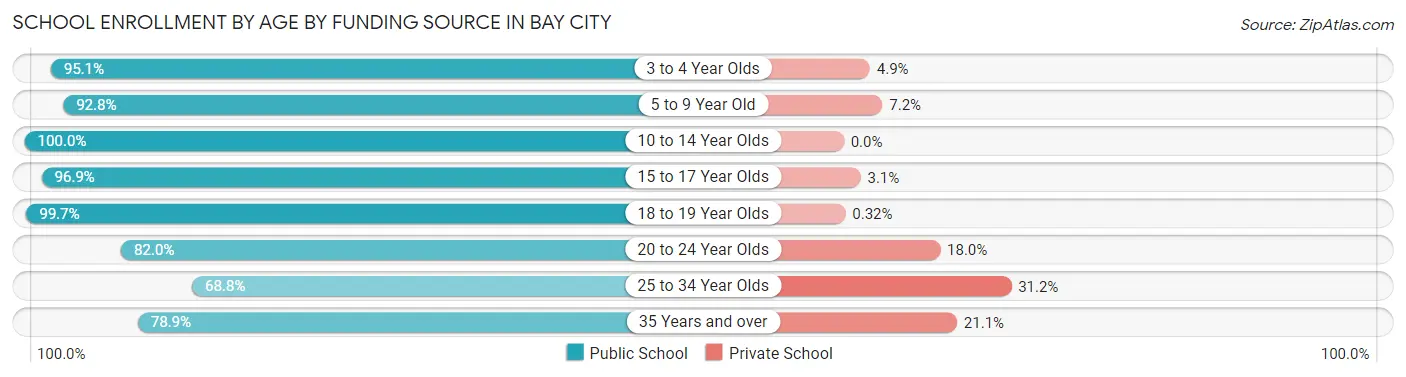
| Age Bracket | Public School | Private School |
| 3 to 4 Year Olds | 234 (95.1%) | 12 (4.9%) |
| 5 to 9 Year Old | 1,135 (92.8%) | 88 (7.2%) |
| 10 to 14 Year Olds | 1,506 (100.0%) | 0 (0.0%) |
| 15 to 17 Year Olds | 524 (96.9%) | 17 (3.1%) |
| 18 to 19 Year Olds | 311 (99.7%) | 1 (0.3%) |
| 20 to 24 Year Olds | 274 (82.0%) | 60 (18.0%) |
| 25 to 34 Year Olds | 183 (68.8%) | 83 (31.2%) |
| 35 Years and over | 318 (78.9%) | 85 (21.1%) |
| Total | 4,483 (92.8%) | 348 (7.2%) |
Educational Attainment by Field of Study in Bay City
Engineering (468 | 20.4%), education (422 | 18.4%), business (314 | 13.7%), science & technology (258 | 11.2%), and visual & performing arts (147 | 6.4%) are the most common fields of study among 2,295 individuals in Bay City who have obtained a bachelor's degree or higher.
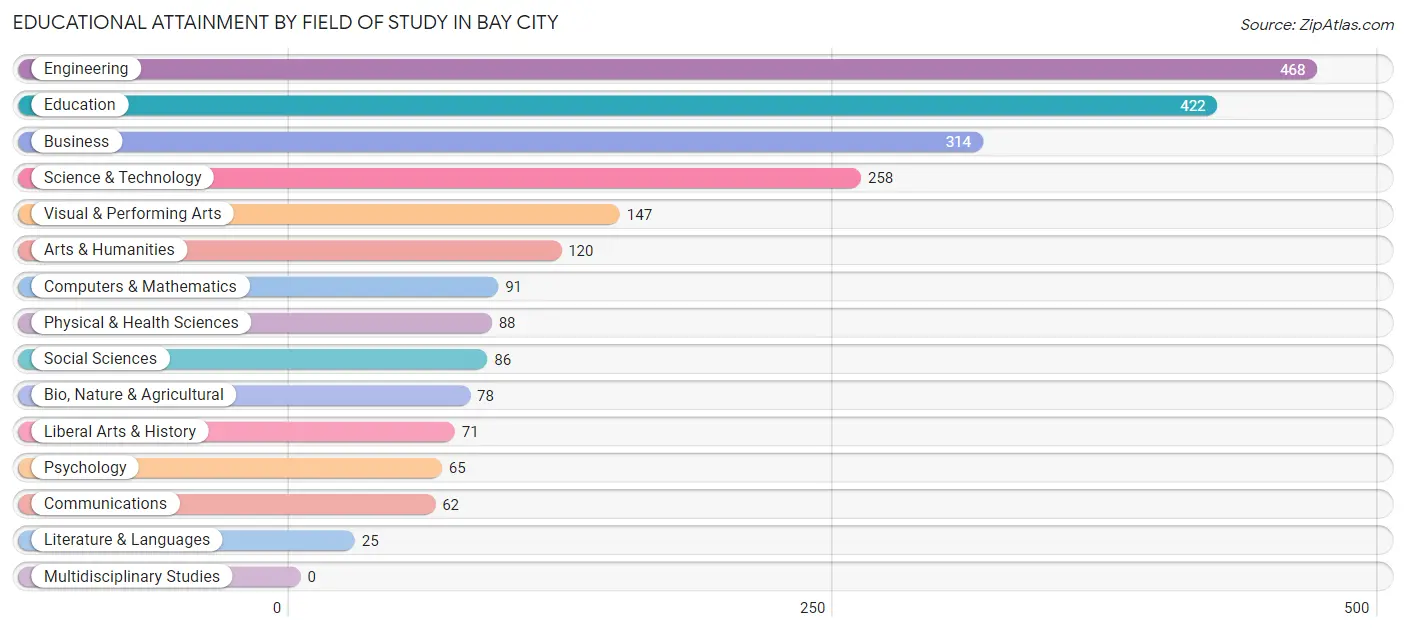
| Field of Study | # Graduates | % Graduates |
| Computers & Mathematics | 91 | 4.0% |
| Bio, Nature & Agricultural | 78 | 3.4% |
| Physical & Health Sciences | 88 | 3.8% |
| Psychology | 65 | 2.8% |
| Social Sciences | 86 | 3.7% |
| Engineering | 468 | 20.4% |
| Multidisciplinary Studies | 0 | 0.0% |
| Science & Technology | 258 | 11.2% |
| Business | 314 | 13.7% |
| Education | 422 | 18.4% |
| Literature & Languages | 25 | 1.1% |
| Liberal Arts & History | 71 | 3.1% |
| Visual & Performing Arts | 147 | 6.4% |
| Communications | 62 | 2.7% |
| Arts & Humanities | 120 | 5.2% |
| Total | 2,295 | 100.0% |
Transportation & Commute in Bay City
Vehicle Availability by Sex in Bay City
The most prevalent vehicle ownership categories in Bay City are males with 2 vehicles (1,644, accounting for 43.1%) and females with 2 vehicles (1,020, making up 54.9%).
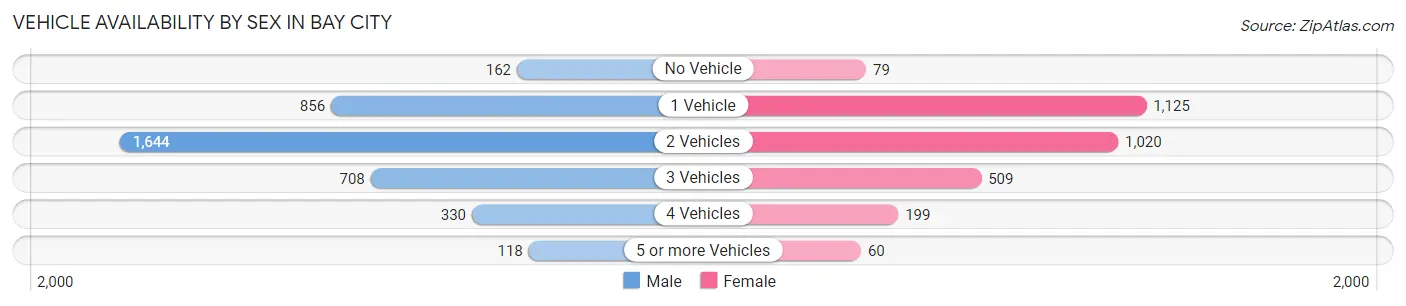
| Vehicles Available | Male | Female |
| No Vehicle | 162 (4.2%) | 79 (2.6%) |
| 1 Vehicle | 856 (22.4%) | 1,125 (37.6%) |
| 2 Vehicles | 1,644 (43.1%) | 1,020 (34.1%) |
| 3 Vehicles | 708 (18.5%) | 509 (17.0%) |
| 4 Vehicles | 330 (8.6%) | 199 (6.7%) |
| 5 or more Vehicles | 118 (3.1%) | 60 (2.0%) |
| Total | 3,818 (100.0%) | 2,992 (100.0%) |
Commute Time in Bay City
The most frequently occuring commute durations in Bay City are 5 to 9 minutes (1,456 commuters, 21.6%), 10 to 14 minutes (1,278 commuters, 19.0%), and 20 to 24 minutes (1,020 commuters, 15.1%).
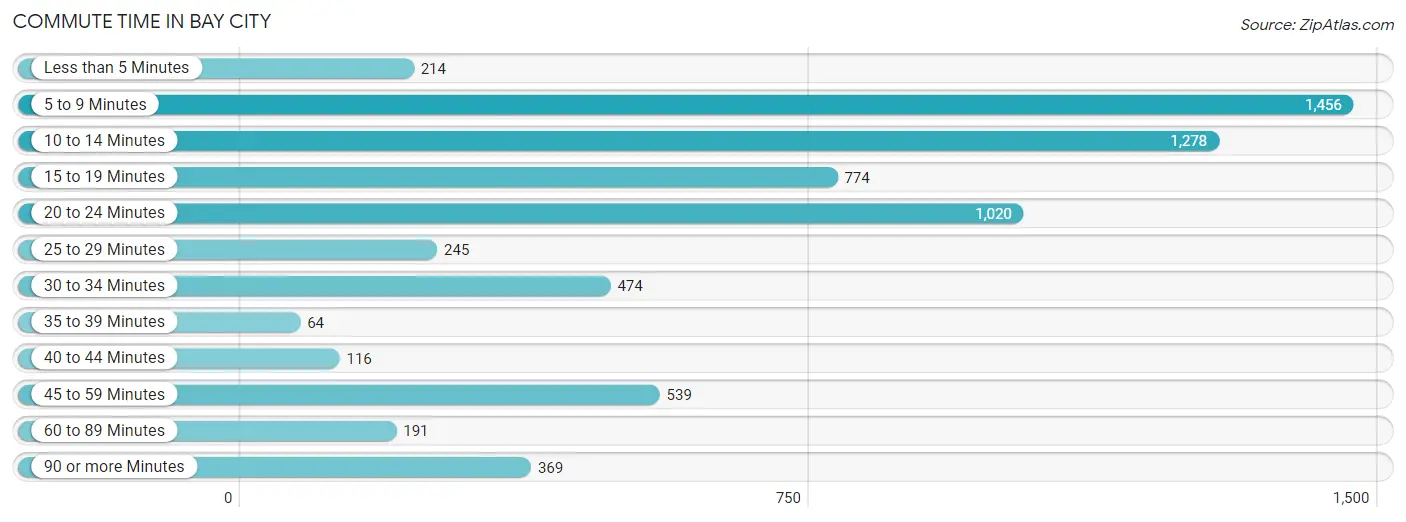
| Commute Time | # Commuters | % Commuters |
| Less than 5 Minutes | 214 | 3.2% |
| 5 to 9 Minutes | 1,456 | 21.6% |
| 10 to 14 Minutes | 1,278 | 19.0% |
| 15 to 19 Minutes | 774 | 11.5% |
| 20 to 24 Minutes | 1,020 | 15.1% |
| 25 to 29 Minutes | 245 | 3.6% |
| 30 to 34 Minutes | 474 | 7.0% |
| 35 to 39 Minutes | 64 | 0.9% |
| 40 to 44 Minutes | 116 | 1.7% |
| 45 to 59 Minutes | 539 | 8.0% |
| 60 to 89 Minutes | 191 | 2.8% |
| 90 or more Minutes | 369 | 5.5% |
Commute Time by Sex in Bay City
The most common commute times in Bay City are 20 to 24 minutes (854 commuters, 22.4%) for males and 5 to 9 minutes (1,236 commuters, 42.2%) for females.
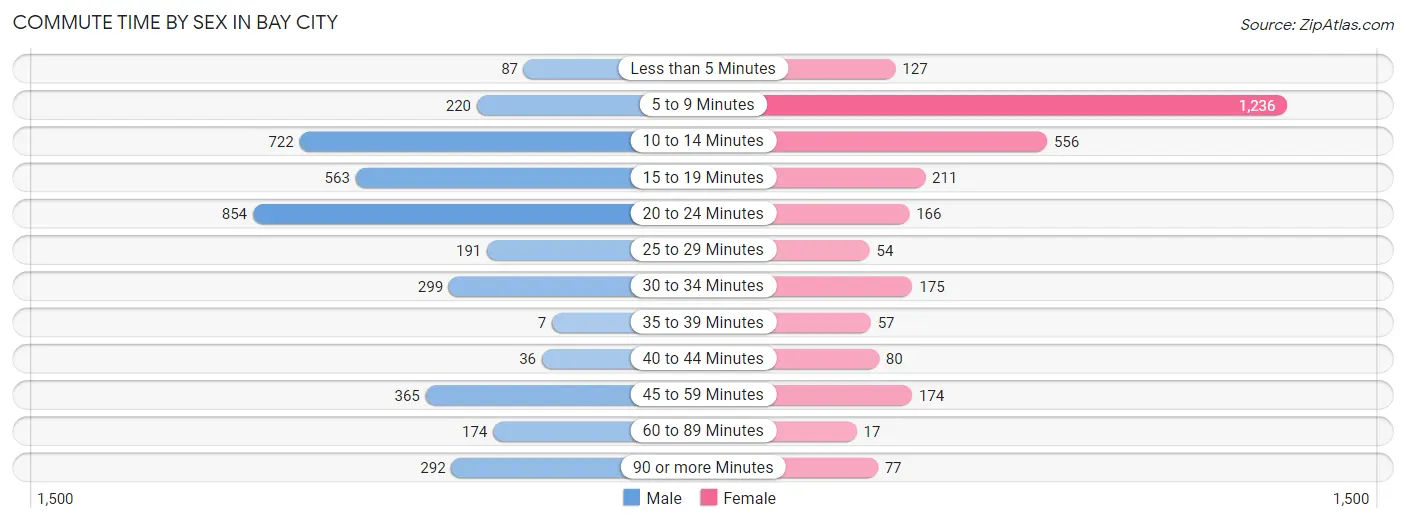
| Commute Time | Male | Female |
| Less than 5 Minutes | 87 (2.3%) | 127 (4.3%) |
| 5 to 9 Minutes | 220 (5.8%) | 1,236 (42.2%) |
| 10 to 14 Minutes | 722 (19.0%) | 556 (19.0%) |
| 15 to 19 Minutes | 563 (14.8%) | 211 (7.2%) |
| 20 to 24 Minutes | 854 (22.4%) | 166 (5.7%) |
| 25 to 29 Minutes | 191 (5.0%) | 54 (1.8%) |
| 30 to 34 Minutes | 299 (7.9%) | 175 (6.0%) |
| 35 to 39 Minutes | 7 (0.2%) | 57 (1.9%) |
| 40 to 44 Minutes | 36 (0.9%) | 80 (2.7%) |
| 45 to 59 Minutes | 365 (9.6%) | 174 (5.9%) |
| 60 to 89 Minutes | 174 (4.6%) | 17 (0.6%) |
| 90 or more Minutes | 292 (7.7%) | 77 (2.6%) |
Time of Departure to Work by Sex in Bay City
The most frequent times of departure to work in Bay City are 6:00 AM to 6:29 AM (590, 15.5%) for males and 7:00 AM to 7:29 AM (453, 15.5%) for females.
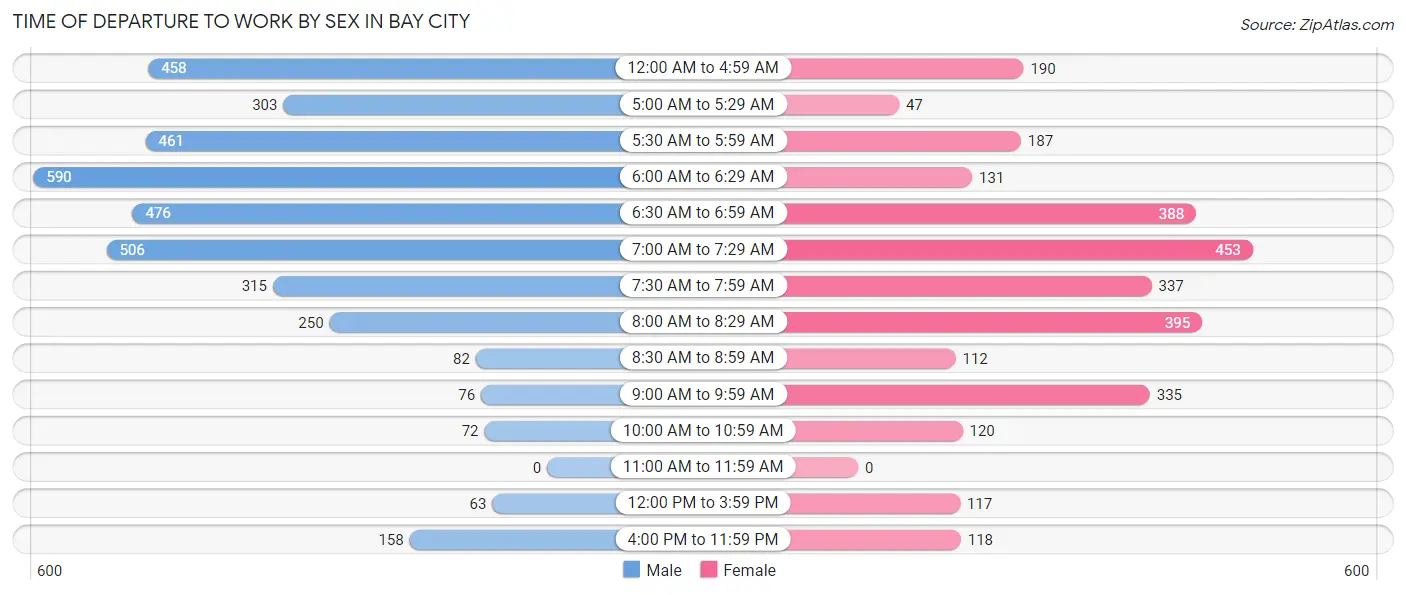
| Time of Departure | Male | Female |
| 12:00 AM to 4:59 AM | 458 (12.0%) | 190 (6.5%) |
| 5:00 AM to 5:29 AM | 303 (8.0%) | 47 (1.6%) |
| 5:30 AM to 5:59 AM | 461 (12.1%) | 187 (6.4%) |
| 6:00 AM to 6:29 AM | 590 (15.5%) | 131 (4.5%) |
| 6:30 AM to 6:59 AM | 476 (12.5%) | 388 (13.2%) |
| 7:00 AM to 7:29 AM | 506 (13.3%) | 453 (15.5%) |
| 7:30 AM to 7:59 AM | 315 (8.3%) | 337 (11.5%) |
| 8:00 AM to 8:29 AM | 250 (6.6%) | 395 (13.5%) |
| 8:30 AM to 8:59 AM | 82 (2.1%) | 112 (3.8%) |
| 9:00 AM to 9:59 AM | 76 (2.0%) | 335 (11.4%) |
| 10:00 AM to 10:59 AM | 72 (1.9%) | 120 (4.1%) |
| 11:00 AM to 11:59 AM | 0 (0.0%) | 0 (0.0%) |
| 12:00 PM to 3:59 PM | 63 (1.7%) | 117 (4.0%) |
| 4:00 PM to 11:59 PM | 158 (4.2%) | 118 (4.0%) |
| Total | 3,810 (100.0%) | 2,930 (100.0%) |
Housing Occupancy in Bay City
Occupancy by Ownership in Bay City
Of the total 6,674 dwellings in Bay City, owner-occupied units account for 3,613 (54.1%), while renter-occupied units make up 3,061 (45.9%).
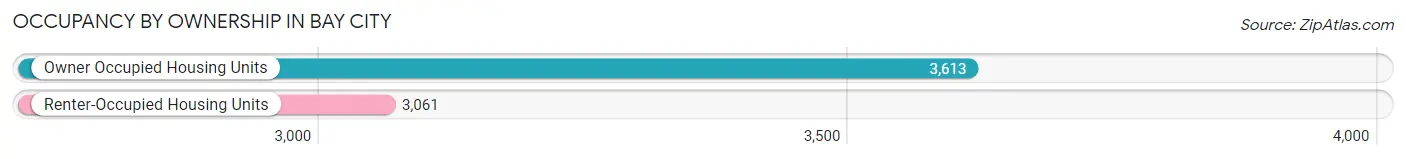
| Occupancy | # Housing Units | % Housing Units |
| Owner Occupied Housing Units | 3,613 | 54.1% |
| Renter-Occupied Housing Units | 3,061 | 45.9% |
| Total Occupied Housing Units | 6,674 | 100.0% |
Occupancy by Household Size in Bay City
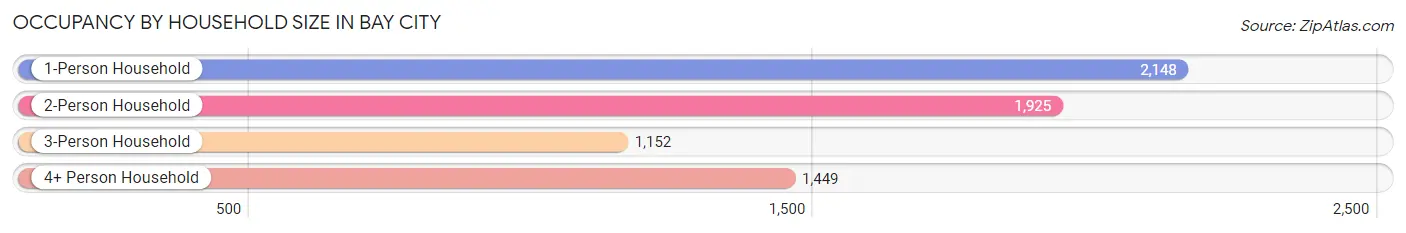
| Household Size | # Housing Units | % Housing Units |
| 1-Person Household | 2,148 | 32.2% |
| 2-Person Household | 1,925 | 28.8% |
| 3-Person Household | 1,152 | 17.3% |
| 4+ Person Household | 1,449 | 21.7% |
| Total Housing Units | 6,674 | 100.0% |
Occupancy by Ownership by Household Size in Bay City
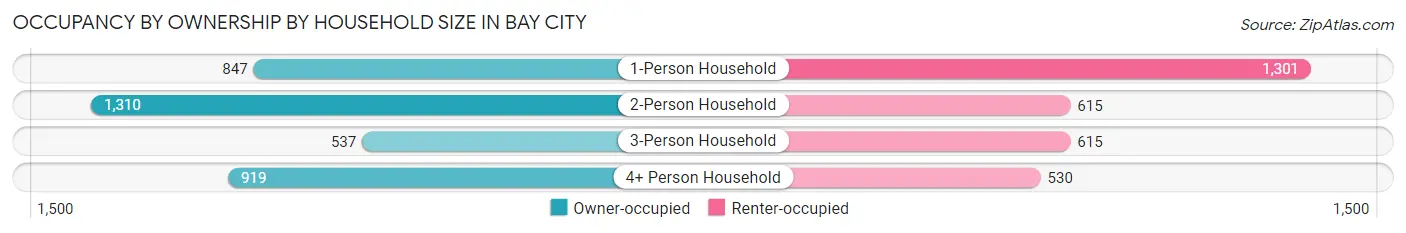
| Household Size | Owner-occupied | Renter-occupied |
| 1-Person Household | 847 (39.4%) | 1,301 (60.6%) |
| 2-Person Household | 1,310 (68.0%) | 615 (32.0%) |
| 3-Person Household | 537 (46.6%) | 615 (53.4%) |
| 4+ Person Household | 919 (63.4%) | 530 (36.6%) |
| Total Housing Units | 3,613 (54.1%) | 3,061 (45.9%) |
Occupancy by Educational Attainment in Bay City
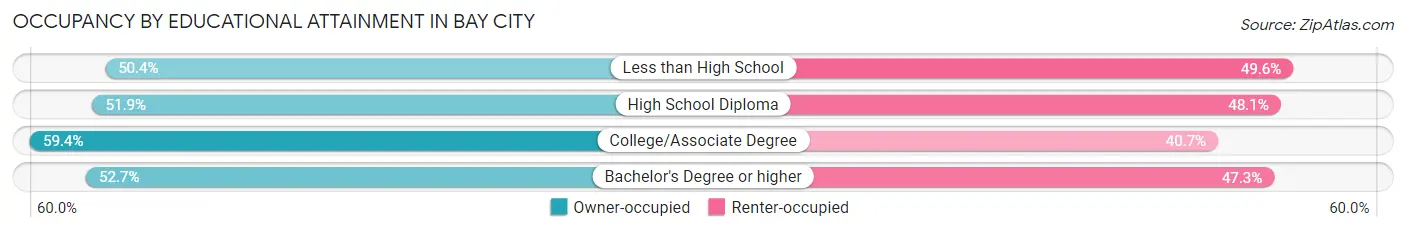
| Household Size | Owner-occupied | Renter-occupied |
| Less than High School | 614 (50.4%) | 604 (49.6%) |
| High School Diploma | 971 (51.9%) | 900 (48.1%) |
| College/Associate Degree | 1,241 (59.4%) | 850 (40.6%) |
| Bachelor's Degree or higher | 787 (52.7%) | 707 (47.3%) |
Occupancy by Age of Householder in Bay City
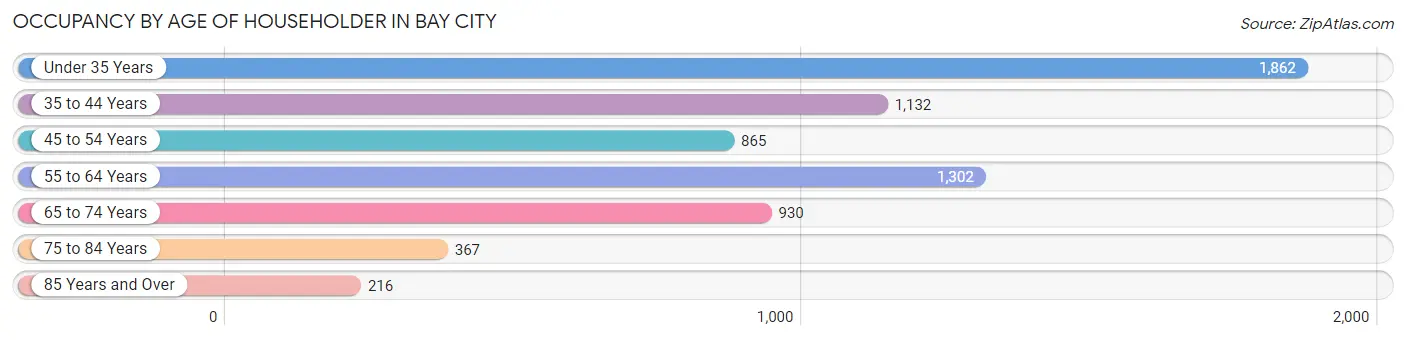
| Age Bracket | # Households | % Households |
| Under 35 Years | 1,862 | 27.9% |
| 35 to 44 Years | 1,132 | 17.0% |
| 45 to 54 Years | 865 | 13.0% |
| 55 to 64 Years | 1,302 | 19.5% |
| 65 to 74 Years | 930 | 13.9% |
| 75 to 84 Years | 367 | 5.5% |
| 85 Years and Over | 216 | 3.2% |
| Total | 6,674 | 100.0% |
Housing Finances in Bay City
Median Income by Occupancy in Bay City
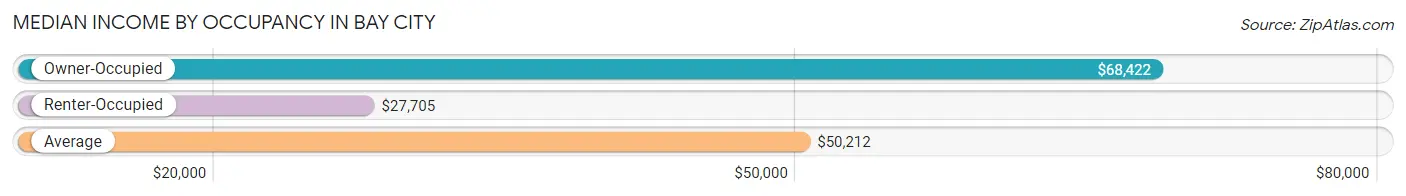
| Occupancy Type | # Households | Median Income |
| Owner-Occupied | 3,613 (54.1%) | $68,422 |
| Renter-Occupied | 3,061 (45.9%) | $27,705 |
| Average | 6,674 (100.0%) | $50,212 |
Occupancy by Householder Income Bracket in Bay City
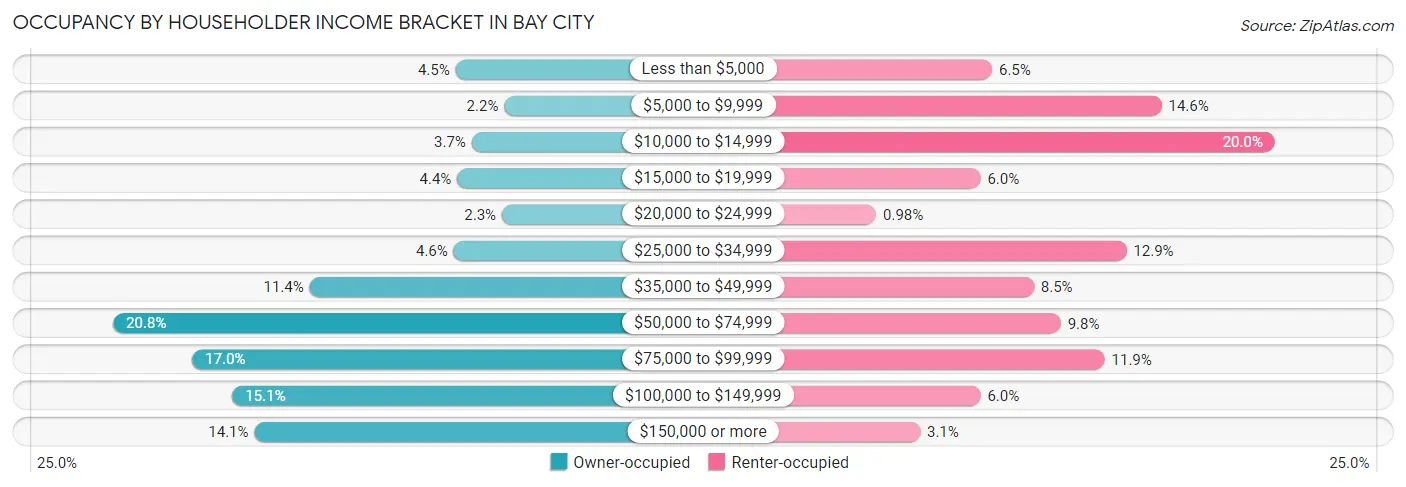
| Income Bracket | Owner-occupied | Renter-occupied |
| Less than $5,000 | 162 (4.5%) | 199 (6.5%) |
| $5,000 to $9,999 | 78 (2.2%) | 446 (14.6%) |
| $10,000 to $14,999 | 134 (3.7%) | 611 (20.0%) |
| $15,000 to $19,999 | 159 (4.4%) | 182 (5.9%) |
| $20,000 to $24,999 | 82 (2.3%) | 30 (1.0%) |
| $25,000 to $34,999 | 165 (4.6%) | 395 (12.9%) |
| $35,000 to $49,999 | 413 (11.4%) | 260 (8.5%) |
| $50,000 to $74,999 | 751 (20.8%) | 299 (9.8%) |
| $75,000 to $99,999 | 615 (17.0%) | 363 (11.9%) |
| $100,000 to $149,999 | 546 (15.1%) | 182 (5.9%) |
| $150,000 or more | 508 (14.1%) | 94 (3.1%) |
| Total | 3,613 (100.0%) | 3,061 (100.0%) |
Monthly Housing Cost Tiers in Bay City
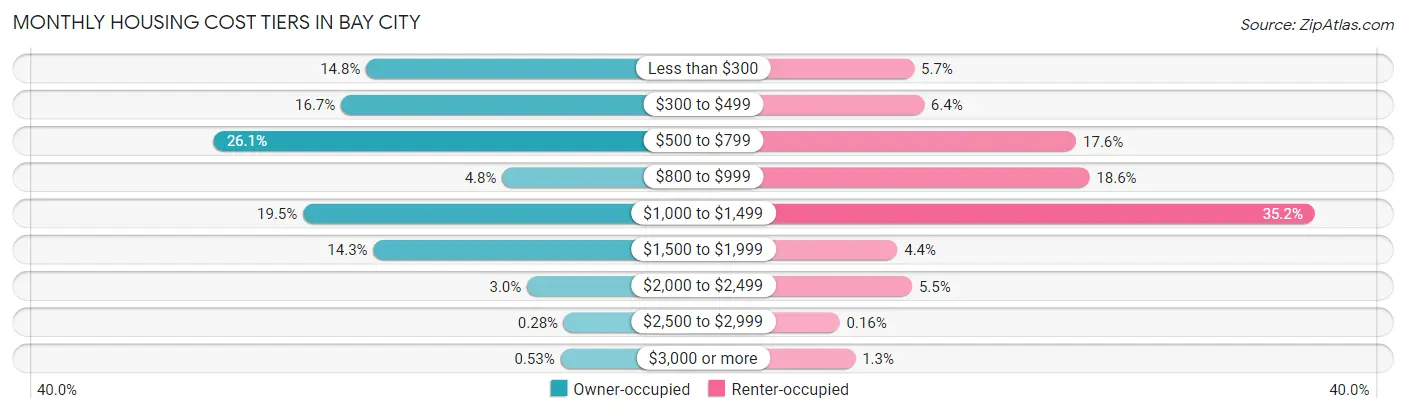
| Monthly Cost | Owner-occupied | Renter-occupied |
| Less than $300 | 536 (14.8%) | 173 (5.7%) |
| $300 to $499 | 603 (16.7%) | 195 (6.4%) |
| $500 to $799 | 942 (26.1%) | 538 (17.6%) |
| $800 to $999 | 174 (4.8%) | 568 (18.6%) |
| $1,000 to $1,499 | 704 (19.5%) | 1,076 (35.1%) |
| $1,500 to $1,999 | 517 (14.3%) | 135 (4.4%) |
| $2,000 to $2,499 | 108 (3.0%) | 168 (5.5%) |
| $2,500 to $2,999 | 10 (0.3%) | 5 (0.2%) |
| $3,000 or more | 19 (0.5%) | 40 (1.3%) |
| Total | 3,613 (100.0%) | 3,061 (100.0%) |
Physical Housing Characteristics in Bay City
Housing Structures in Bay City
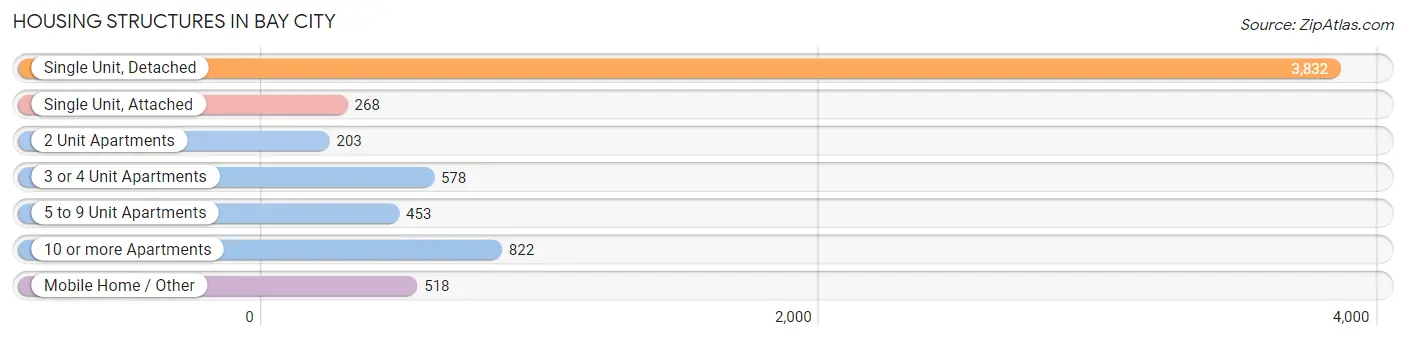
| Structure Type | # Housing Units | % Housing Units |
| Single Unit, Detached | 3,832 | 57.4% |
| Single Unit, Attached | 268 | 4.0% |
| 2 Unit Apartments | 203 | 3.0% |
| 3 or 4 Unit Apartments | 578 | 8.7% |
| 5 to 9 Unit Apartments | 453 | 6.8% |
| 10 or more Apartments | 822 | 12.3% |
| Mobile Home / Other | 518 | 7.8% |
| Total | 6,674 | 100.0% |
Housing Structures by Occupancy in Bay City
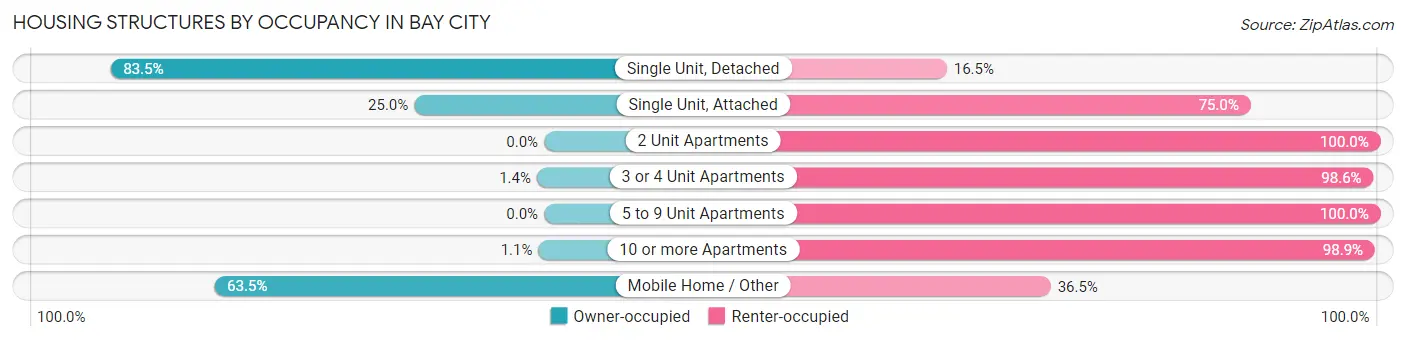
| Structure Type | Owner-occupied | Renter-occupied |
| Single Unit, Detached | 3,200 (83.5%) | 632 (16.5%) |
| Single Unit, Attached | 67 (25.0%) | 201 (75.0%) |
| 2 Unit Apartments | 0 (0.0%) | 203 (100.0%) |
| 3 or 4 Unit Apartments | 8 (1.4%) | 570 (98.6%) |
| 5 to 9 Unit Apartments | 0 (0.0%) | 453 (100.0%) |
| 10 or more Apartments | 9 (1.1%) | 813 (98.9%) |
| Mobile Home / Other | 329 (63.5%) | 189 (36.5%) |
| Total | 3,613 (54.1%) | 3,061 (45.9%) |
Housing Structures by Number of Rooms in Bay City
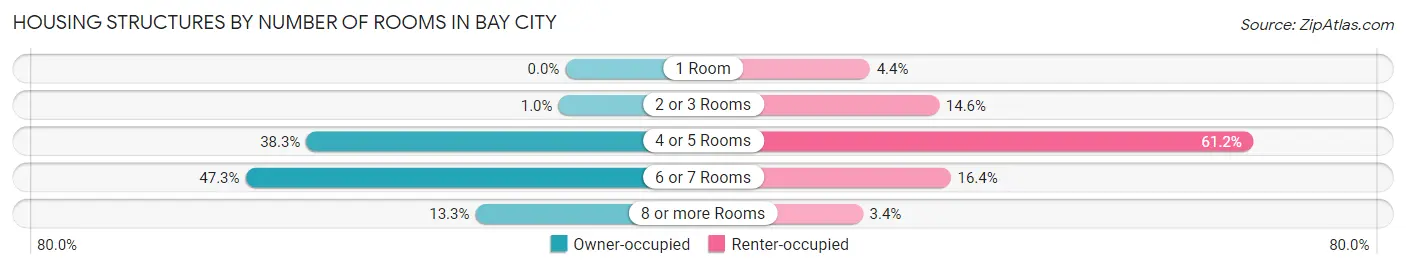
| Number of Rooms | Owner-occupied | Renter-occupied |
| 1 Room | 0 (0.0%) | 135 (4.4%) |
| 2 or 3 Rooms | 37 (1.0%) | 448 (14.6%) |
| 4 or 5 Rooms | 1,385 (38.3%) | 1,874 (61.2%) |
| 6 or 7 Rooms | 1,710 (47.3%) | 501 (16.4%) |
| 8 or more Rooms | 481 (13.3%) | 103 (3.4%) |
| Total | 3,613 (100.0%) | 3,061 (100.0%) |
Housing Structure by Heating Type in Bay City
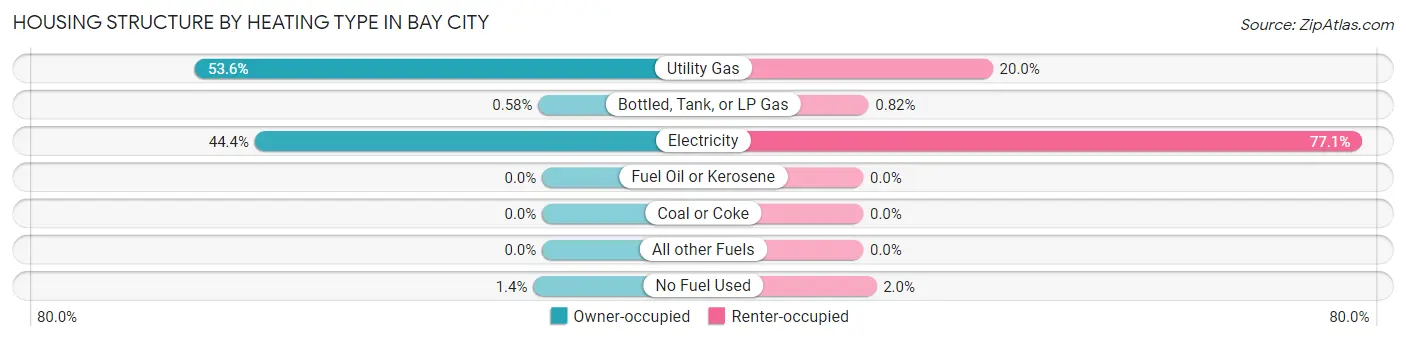
| Heating Type | Owner-occupied | Renter-occupied |
| Utility Gas | 1,938 (53.6%) | 613 (20.0%) |
| Bottled, Tank, or LP Gas | 21 (0.6%) | 25 (0.8%) |
| Electricity | 1,605 (44.4%) | 2,361 (77.1%) |
| Fuel Oil or Kerosene | 0 (0.0%) | 0 (0.0%) |
| Coal or Coke | 0 (0.0%) | 0 (0.0%) |
| All other Fuels | 0 (0.0%) | 0 (0.0%) |
| No Fuel Used | 49 (1.4%) | 62 (2.0%) |
| Total | 3,613 (100.0%) | 3,061 (100.0%) |
Household Vehicle Usage in Bay City
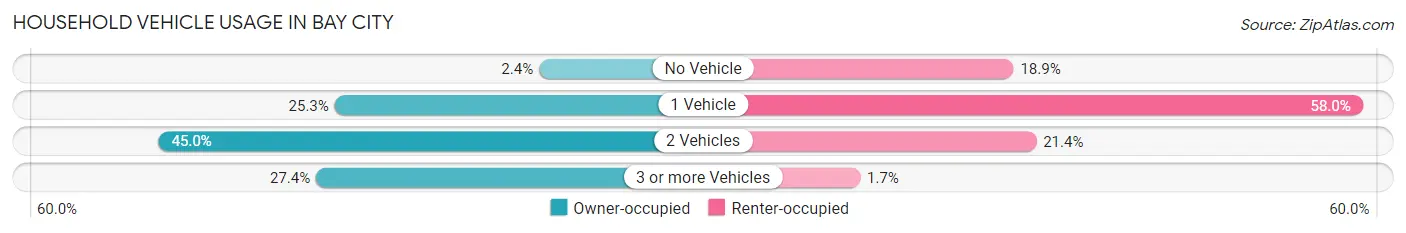
| Vehicles per Household | Owner-occupied | Renter-occupied |
| No Vehicle | 86 (2.4%) | 578 (18.9%) |
| 1 Vehicle | 913 (25.3%) | 1,775 (58.0%) |
| 2 Vehicles | 1,626 (45.0%) | 656 (21.4%) |
| 3 or more Vehicles | 988 (27.4%) | 52 (1.7%) |
| Total | 3,613 (100.0%) | 3,061 (100.0%) |
Real Estate & Mortgages in Bay City
Real Estate and Mortgage Overview in Bay City
| Characteristic | Without Mortgage | With Mortgage |
| Housing Units | 2,396 | 1,217 |
| Median Property Value | $126,200 | $151,300 |
| Median Household Income | $66,875 | $204 |
| Monthly Housing Costs | $513 | $19 |
| Real Estate Taxes | $2,011 | $82 |
Property Value by Mortgage Status in Bay City
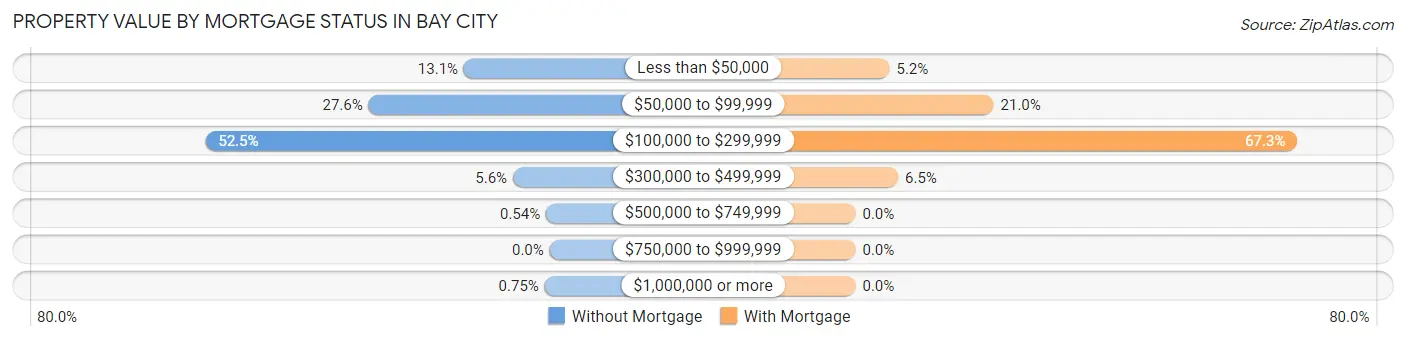
| Property Value | Without Mortgage | With Mortgage |
| Less than $50,000 | 313 (13.1%) | 63 (5.2%) |
| $50,000 to $99,999 | 661 (27.6%) | 256 (21.0%) |
| $100,000 to $299,999 | 1,257 (52.5%) | 819 (67.3%) |
| $300,000 to $499,999 | 134 (5.6%) | 79 (6.5%) |
| $500,000 to $749,999 | 13 (0.5%) | 0 (0.0%) |
| $750,000 to $999,999 | 0 (0.0%) | 0 (0.0%) |
| $1,000,000 or more | 18 (0.7%) | 0 (0.0%) |
| Total | 2,396 (100.0%) | 1,217 (100.0%) |
Household Income by Mortgage Status in Bay City
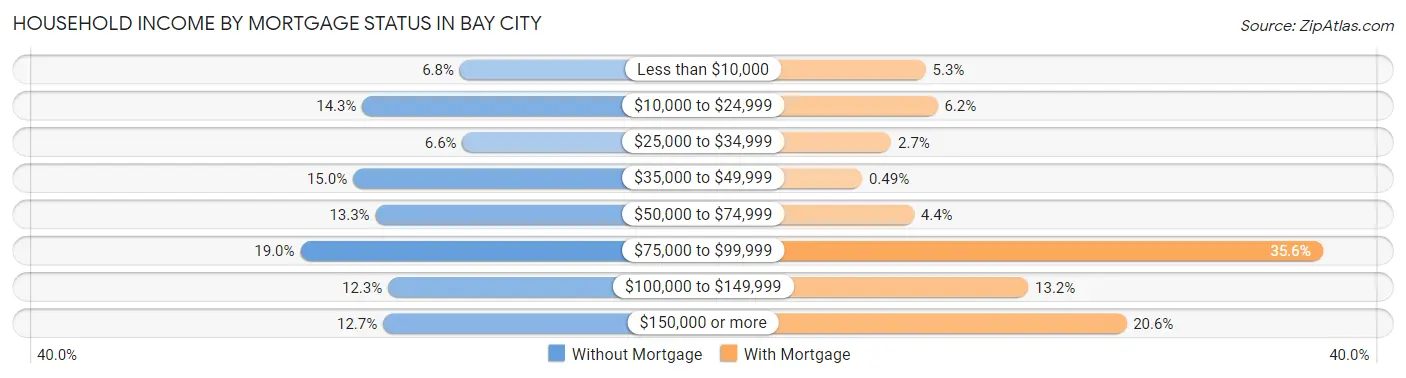
| Household Income | Without Mortgage | With Mortgage |
| Less than $10,000 | 164 (6.8%) | 65 (5.3%) |
| $10,000 to $24,999 | 342 (14.3%) | 76 (6.2%) |
| $25,000 to $34,999 | 159 (6.6%) | 33 (2.7%) |
| $35,000 to $49,999 | 359 (15.0%) | 6 (0.5%) |
| $50,000 to $74,999 | 318 (13.3%) | 54 (4.4%) |
| $75,000 to $99,999 | 455 (19.0%) | 433 (35.6%) |
| $100,000 to $149,999 | 295 (12.3%) | 160 (13.2%) |
| $150,000 or more | 304 (12.7%) | 251 (20.6%) |
| Total | 2,396 (100.0%) | 1,217 (100.0%) |
Property Value to Household Income Ratio in Bay City
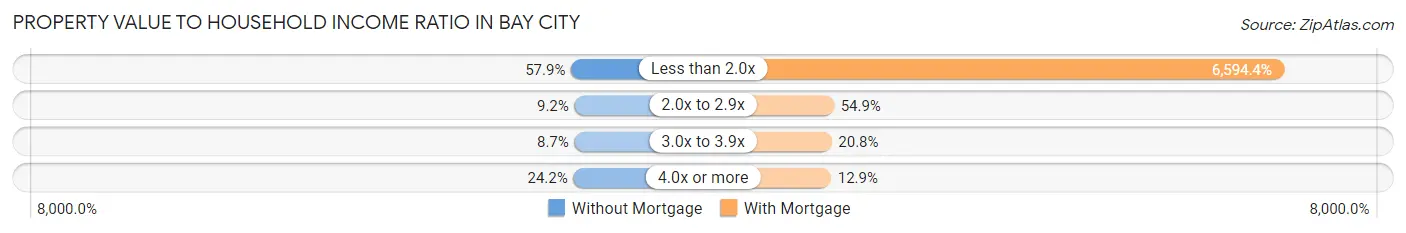
| Value-to-Income Ratio | Without Mortgage | With Mortgage |
| Less than 2.0x | 1,388 (57.9%) | 80,254 (6,594.4%) |
| 2.0x to 2.9x | 221 (9.2%) | 668 (54.9%) |
| 3.0x to 3.9x | 208 (8.7%) | 253 (20.8%) |
| 4.0x or more | 579 (24.2%) | 157 (12.9%) |
| Total | 2,396 (100.0%) | 1,217 (100.0%) |
Real Estate Taxes by Mortgage Status in Bay City
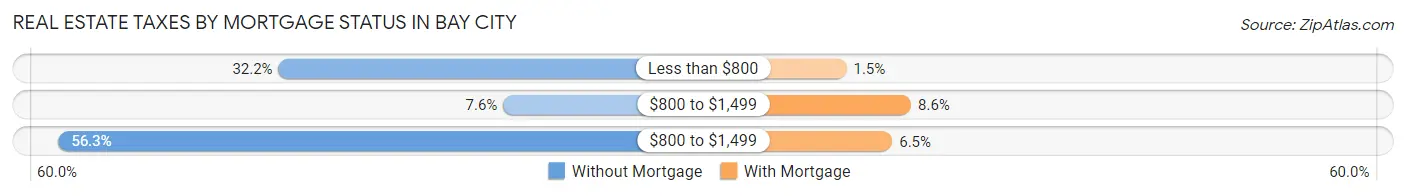
| Property Taxes | Without Mortgage | With Mortgage |
| Less than $800 | 771 (32.2%) | 18 (1.5%) |
| $800 to $1,499 | 181 (7.5%) | 104 (8.6%) |
| $800 to $1,499 | 1,349 (56.3%) | 79 (6.5%) |
| Total | 2,396 (100.0%) | 1,217 (100.0%) |
Health & Disability in Bay City
Health Insurance Coverage by Age in Bay City
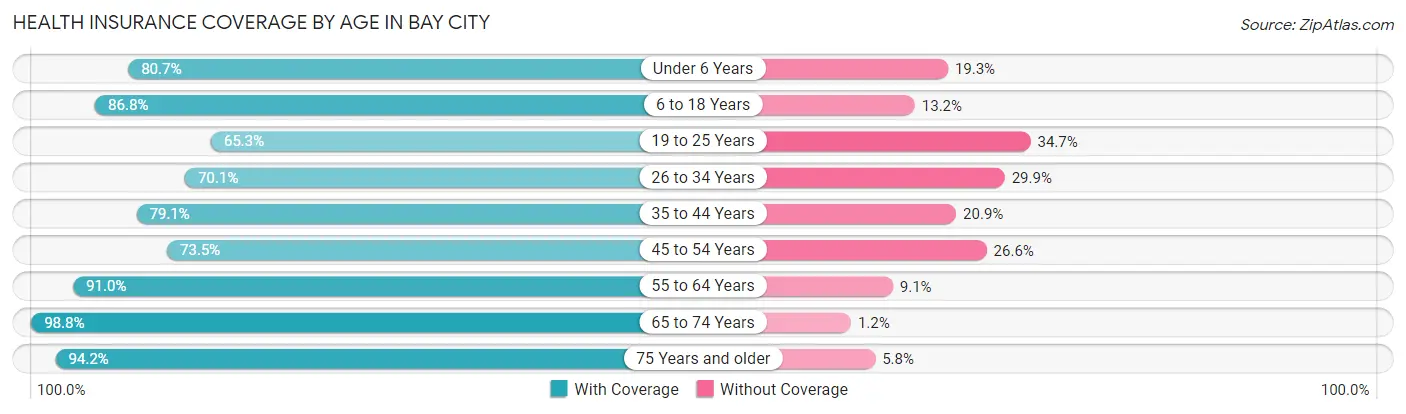
| Age Bracket | With Coverage | Without Coverage |
| Under 6 Years | 1,619 (80.7%) | 388 (19.3%) |
| 6 to 18 Years | 3,036 (86.8%) | 460 (13.2%) |
| 19 to 25 Years | 1,092 (65.3%) | 581 (34.7%) |
| 26 to 34 Years | 1,799 (70.1%) | 768 (29.9%) |
| 35 to 44 Years | 1,783 (79.1%) | 470 (20.9%) |
| 45 to 54 Years | 1,040 (73.5%) | 376 (26.6%) |
| 55 to 64 Years | 1,679 (90.9%) | 167 (9.0%) |
| 65 to 74 Years | 1,432 (98.8%) | 18 (1.2%) |
| 75 Years and older | 785 (94.2%) | 48 (5.8%) |
| Total | 14,265 (81.3%) | 3,276 (18.7%) |
Health Insurance Coverage by Citizenship Status in Bay City
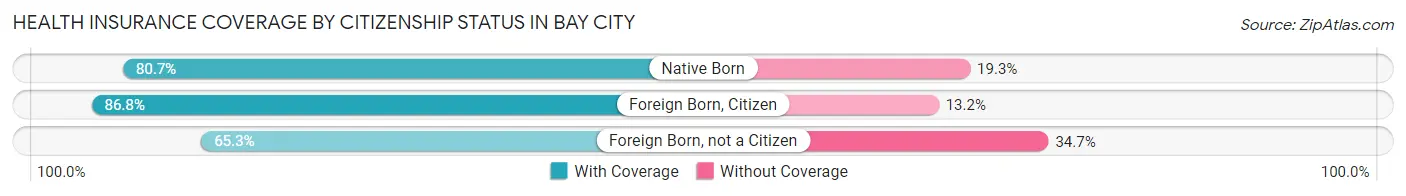
| Citizenship Status | With Coverage | Without Coverage |
| Native Born | 1,619 (80.7%) | 388 (19.3%) |
| Foreign Born, Citizen | 3,036 (86.8%) | 460 (13.2%) |
| Foreign Born, not a Citizen | 1,092 (65.3%) | 581 (34.7%) |
Health Insurance Coverage by Household Income in Bay City
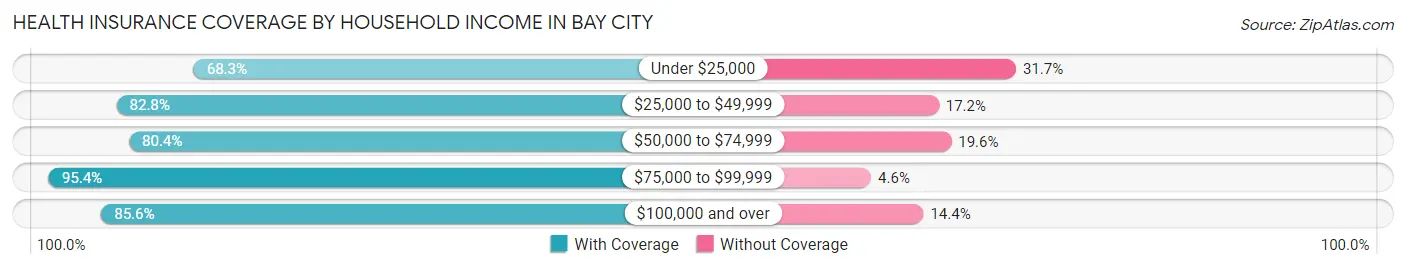
| Household Income | With Coverage | Without Coverage |
| Under $25,000 | 3,118 (68.3%) | 1,448 (31.7%) |
| $25,000 to $49,999 | 2,401 (82.8%) | 500 (17.2%) |
| $50,000 to $74,999 | 2,366 (80.4%) | 576 (19.6%) |
| $75,000 to $99,999 | 2,681 (95.4%) | 128 (4.6%) |
| $100,000 and over | 3,689 (85.6%) | 619 (14.4%) |
Public vs Private Health Insurance Coverage by Age in Bay City
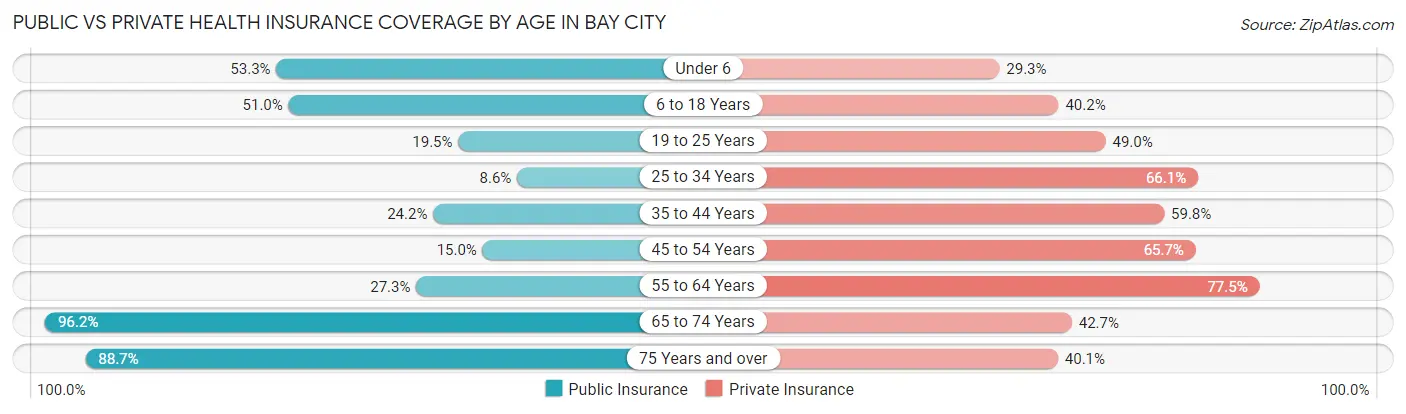
| Age Bracket | Public Insurance | Private Insurance |
| Under 6 | 1,069 (53.3%) | 587 (29.2%) |
| 6 to 18 Years | 1,783 (51.0%) | 1,406 (40.2%) |
| 19 to 25 Years | 326 (19.5%) | 819 (48.9%) |
| 25 to 34 Years | 220 (8.6%) | 1,697 (66.1%) |
| 35 to 44 Years | 544 (24.1%) | 1,348 (59.8%) |
| 45 to 54 Years | 212 (15.0%) | 930 (65.7%) |
| 55 to 64 Years | 504 (27.3%) | 1,431 (77.5%) |
| 65 to 74 Years | 1,395 (96.2%) | 619 (42.7%) |
| 75 Years and over | 739 (88.7%) | 334 (40.1%) |
| Total | 6,792 (38.7%) | 9,171 (52.3%) |
Disability Status by Sex by Age in Bay City
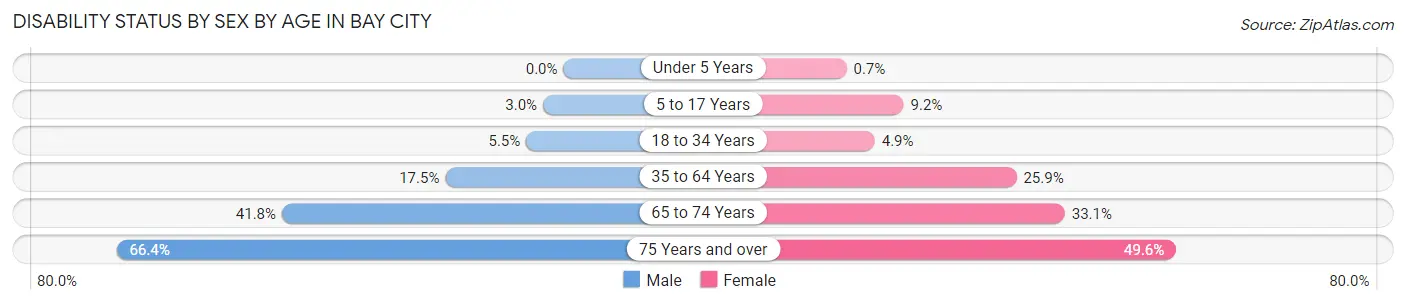
| Age Bracket | Male | Female |
| Under 5 Years | 0 (0.0%) | 8 (0.7%) |
| 5 to 17 Years | 49 (3.0%) | 164 (9.2%) |
| 18 to 34 Years | 132 (5.5%) | 106 (4.9%) |
| 35 to 64 Years | 427 (17.5%) | 799 (25.9%) |
| 65 to 74 Years | 283 (41.8%) | 256 (33.1%) |
| 75 Years and over | 280 (66.3%) | 204 (49.6%) |
Disability Class by Sex by Age in Bay City
Disability Class: Hearing Difficulty
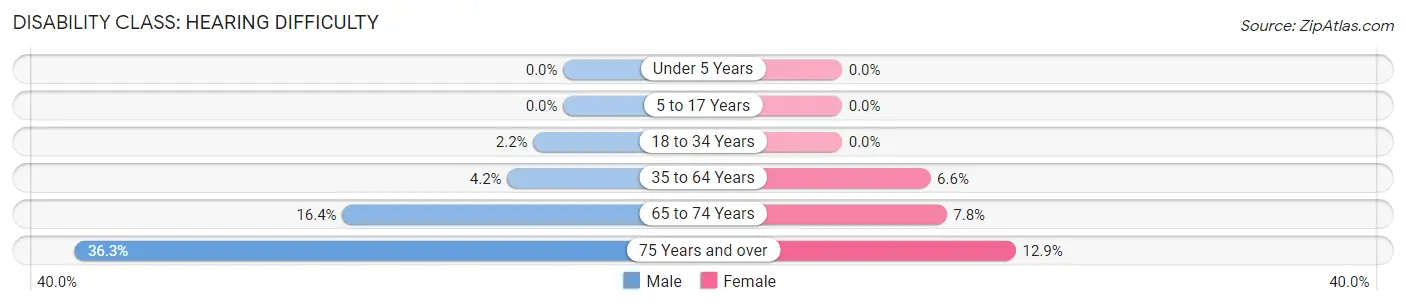
| Age Bracket | Male | Female |
| Under 5 Years | 0 (0.0%) | 0 (0.0%) |
| 5 to 17 Years | 0 (0.0%) | 0 (0.0%) |
| 18 to 34 Years | 53 (2.2%) | 0 (0.0%) |
| 35 to 64 Years | 101 (4.2%) | 202 (6.6%) |
| 65 to 74 Years | 111 (16.4%) | 60 (7.8%) |
| 75 Years and over | 153 (36.3%) | 53 (12.9%) |
Disability Class: Vision Difficulty
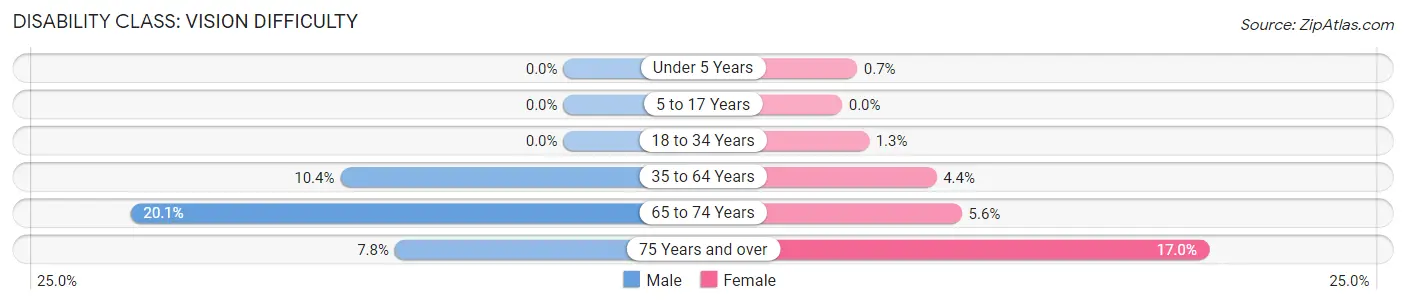
| Age Bracket | Male | Female |
| Under 5 Years | 0 (0.0%) | 8 (0.7%) |
| 5 to 17 Years | 0 (0.0%) | 0 (0.0%) |
| 18 to 34 Years | 0 (0.0%) | 27 (1.3%) |
| 35 to 64 Years | 252 (10.3%) | 135 (4.4%) |
| 65 to 74 Years | 136 (20.1%) | 43 (5.6%) |
| 75 Years and over | 33 (7.8%) | 70 (17.0%) |
Disability Class: Cognitive Difficulty
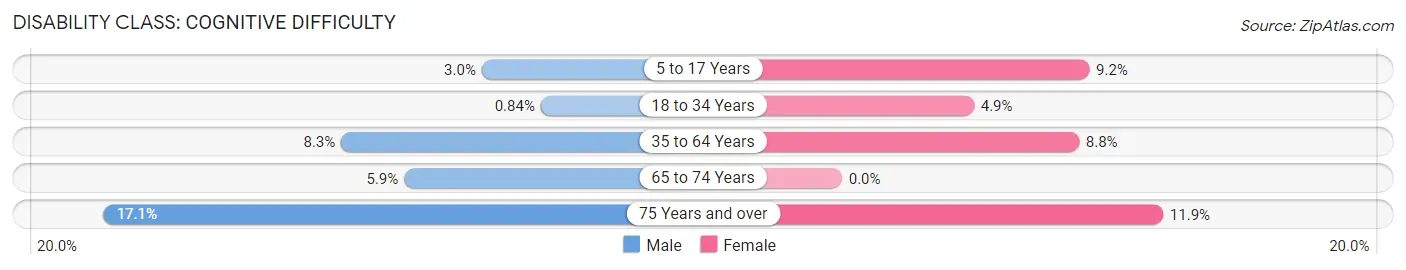
| Age Bracket | Male | Female |
| 5 to 17 Years | 49 (3.0%) | 164 (9.2%) |
| 18 to 34 Years | 20 (0.8%) | 106 (4.9%) |
| 35 to 64 Years | 201 (8.3%) | 271 (8.8%) |
| 65 to 74 Years | 40 (5.9%) | 0 (0.0%) |
| 75 Years and over | 72 (17.1%) | 49 (11.9%) |
Disability Class: Ambulatory Difficulty
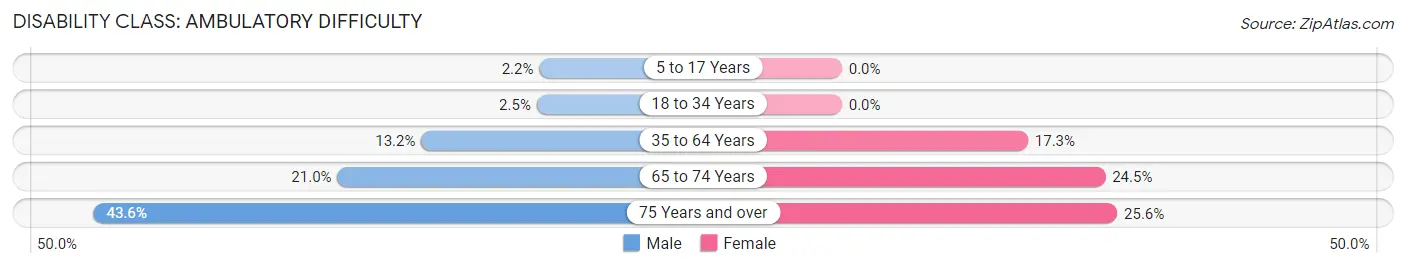
| Age Bracket | Male | Female |
| 5 to 17 Years | 36 (2.2%) | 0 (0.0%) |
| 18 to 34 Years | 59 (2.5%) | 0 (0.0%) |
| 35 to 64 Years | 321 (13.2%) | 532 (17.3%) |
| 65 to 74 Years | 142 (21.0%) | 189 (24.4%) |
| 75 Years and over | 184 (43.6%) | 105 (25.6%) |
Disability Class: Self-Care Difficulty
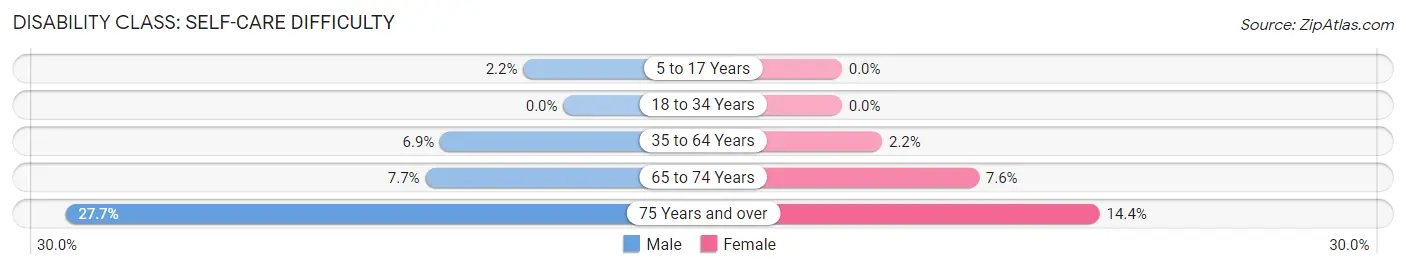
| Age Bracket | Male | Female |
| 5 to 17 Years | 36 (2.2%) | 0 (0.0%) |
| 18 to 34 Years | 0 (0.0%) | 0 (0.0%) |
| 35 to 64 Years | 167 (6.9%) | 69 (2.2%) |
| 65 to 74 Years | 52 (7.7%) | 59 (7.6%) |
| 75 Years and over | 117 (27.7%) | 59 (14.4%) |
Technology Access in Bay City
Computing Device Access in Bay City
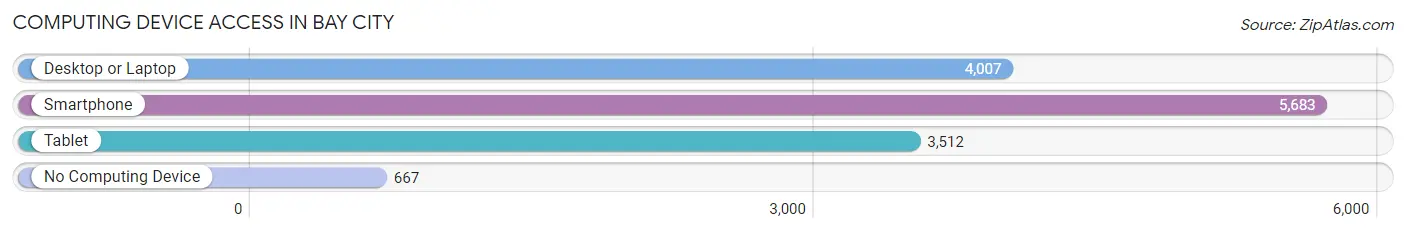
| Device Type | # Households | % Households |
| Desktop or Laptop | 4,007 | 60.0% |
| Smartphone | 5,683 | 85.2% |
| Tablet | 3,512 | 52.6% |
| No Computing Device | 667 | 10.0% |
| Total | 6,674 | 100.0% |
Internet Access in Bay City
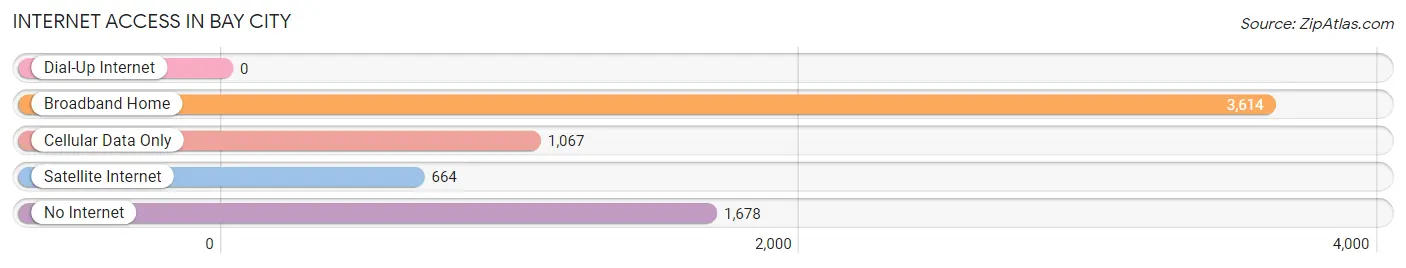
| Internet Type | # Households | % Households |
| Dial-Up Internet | 0 | 0.0% |
| Broadband Home | 3,614 | 54.1% |
| Cellular Data Only | 1,067 | 16.0% |
| Satellite Internet | 664 | 10.0% |
| No Internet | 1,678 | 25.1% |
| Total | 6,674 | 100.0% |
Bay City Summary
Bay City is a city located in Matagorda County, Texas, United States. It is the county seat of Matagorda County and is located on the Gulf Coast of Texas. The population was 17,614 at the 2010 census. It is the principal city of the Bay City Metropolitan Statistical Area, which is a component of the larger Houston-The Woodlands-Sugar Land Combined Statistical Area.
History
The area around Bay City was first settled in 1822 by Stephen F. Austin and the Old Three Hundred. The town was originally called Bay Prairie, and was later renamed Bay City in 1854. The city was incorporated in 1894.
Bay City was a major port for the cotton industry in the late 19th and early 20th centuries. The city was also a major center for the lumber industry, and was home to several large sawmills.
Geography
Bay City is located at the intersection of State Highway 35 and State Highway 60, about 90 miles southwest of Houston. The city is situated on the banks of the Colorado River, which flows into Matagorda Bay.
The city has a total area of 11.2 square miles, of which 10.9 square miles is land and 0.3 square miles is water.
Economy
The economy of Bay City is largely based on the oil and gas industry. The city is home to several oil and gas companies, including Chevron, Shell, and ExxonMobil. The city is also home to several chemical plants, including Dow Chemical and BASF.
The city is also home to several manufacturing companies, including Bay City Industries, which produces plastic products, and Bay City Manufacturing, which produces metal products.
The city is also home to several retail stores including Walmart Target and Home Depot
Demographics
As of the 2010 census, the population of Bay City was 17,614. The racial makeup of the city was 68.3% White, 17.2% African American, 0.7% Native American, 0.7% Asian, 0.1% Pacific Islander, 11.2% from other races, and 2.0% from two or more races. Hispanic or Latino of any race were 28.2% of the population.
The median income for a household in the city was $37,945, and the median income for a family was $45,945. The per capita income for the city was $19,945. About 17.2% of families and 21.2% of the population were below the poverty line, including 28.2% of those under age 18 and 11.2% of those age 65 or over.
Common Questions
What is Per Capita Income in Bay City?
Per Capita income in Bay City is $26,436.
What is the Median Family Income in Bay City?
Median Family Income in Bay City is $58,000.
What is the Median Household income in Bay City?
Median Household Income in Bay City is $50,212.
What is Income or Wage Gap in Bay City?
Income or Wage Gap in Bay City is 52.3%.
Women in Bay City earn 47.7 cents for every dollar earned by a man.
What is Inequality or Gini Index in Bay City?
Inequality or Gini Index in Bay City is 0.52.
What is the Total Population of Bay City?
Total Population of Bay City is 17,869.
What is the Total Male Population of Bay City?
Total Male Population of Bay City is 8,351.
What is the Total Female Population of Bay City?
Total Female Population of Bay City is 9,518.
What is the Ratio of Males per 100 Females in Bay City?
There are 87.74 Males per 100 Females in Bay City.
What is the Ratio of Females per 100 Males in Bay City?
There are 113.97 Females per 100 Males in Bay City.
What is the Median Population Age in Bay City?
Median Population Age in Bay City is 31.8 Years.
What is the Average Family Size in Bay City
Average Family Size in Bay City is 3.4 People.
What is the Average Household Size in Bay City
Average Household Size in Bay City is 2.6 People.
How Large is the Labor Force in Bay City?
There are 7,753 People in the Labor Forcein in Bay City.
What is the Percentage of People in the Labor Force in Bay City?
59.4% of People are in the Labor Force in Bay City.
What is the Unemployment Rate in Bay City?
Unemployment Rate in Bay City is 11.1%.