Whitehouse, TX Map & Demographics
Whitehouse Map
Whitehouse Overview
$32,837
PER CAPITA INCOME
$100,448
AVG FAMILY INCOME
$72,900
AVG HOUSEHOLD INCOME
9.2%
WAGE / INCOME GAP [ % ]
90.8¢/ $1
WAGE / INCOME GAP [ $ ]
0.41
INEQUALITY / GINI INDEX
8,512
TOTAL POPULATION
4,557
MALE POPULATION
3,955
FEMALE POPULATION
115.22
MALES / 100 FEMALES
86.79
FEMALES / 100 MALES
35.1
MEDIAN AGE
3.4
AVG FAMILY SIZE
2.9
AVG HOUSEHOLD SIZE
4,737
LABOR FORCE [ PEOPLE ]
70.8%
PERCENT IN LABOR FORCE
6.1%
UNEMPLOYMENT RATE
Whitehouse Zip Codes
Whitehouse Area Codes
Income in Whitehouse
Income Overview in Whitehouse
Per Capita Income in Whitehouse is $32,837, while median incomes of families and households are $100,448 and $72,900 respectively.
| Characteristic | Number | Measure |
| Per Capita Income | 8,512 | $32,837 |
| Median Family Income | 2,221 | $100,448 |
| Mean Family Income | 2,221 | $97,479 |
| Median Household Income | 2,980 | $72,900 |
| Mean Household Income | 2,980 | $88,971 |
| Income Deficit | 2,221 | $0 |
| Wage / Income Gap (%) | 8,512 | 9.15% |
| Wage / Income Gap ($) | 8,512 | 90.85¢ per $1 |
| Gini / Inequality Index | 8,512 | 0.41 |
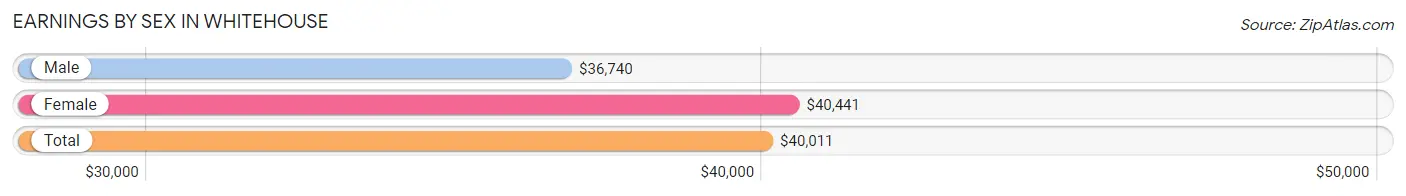
Earnings by Sex in Whitehouse
Average Earnings in Whitehouse are $40,011, $36,740 for men and $40,441 for women, a difference of 9.1%.
| Sex | Number | Average Earnings |
| Male | 2,630 (55.0%) | $36,740 |
| Female | 2,148 (45.0%) | $40,441 |
| Total | 4,778 (100.0%) | $40,011 |
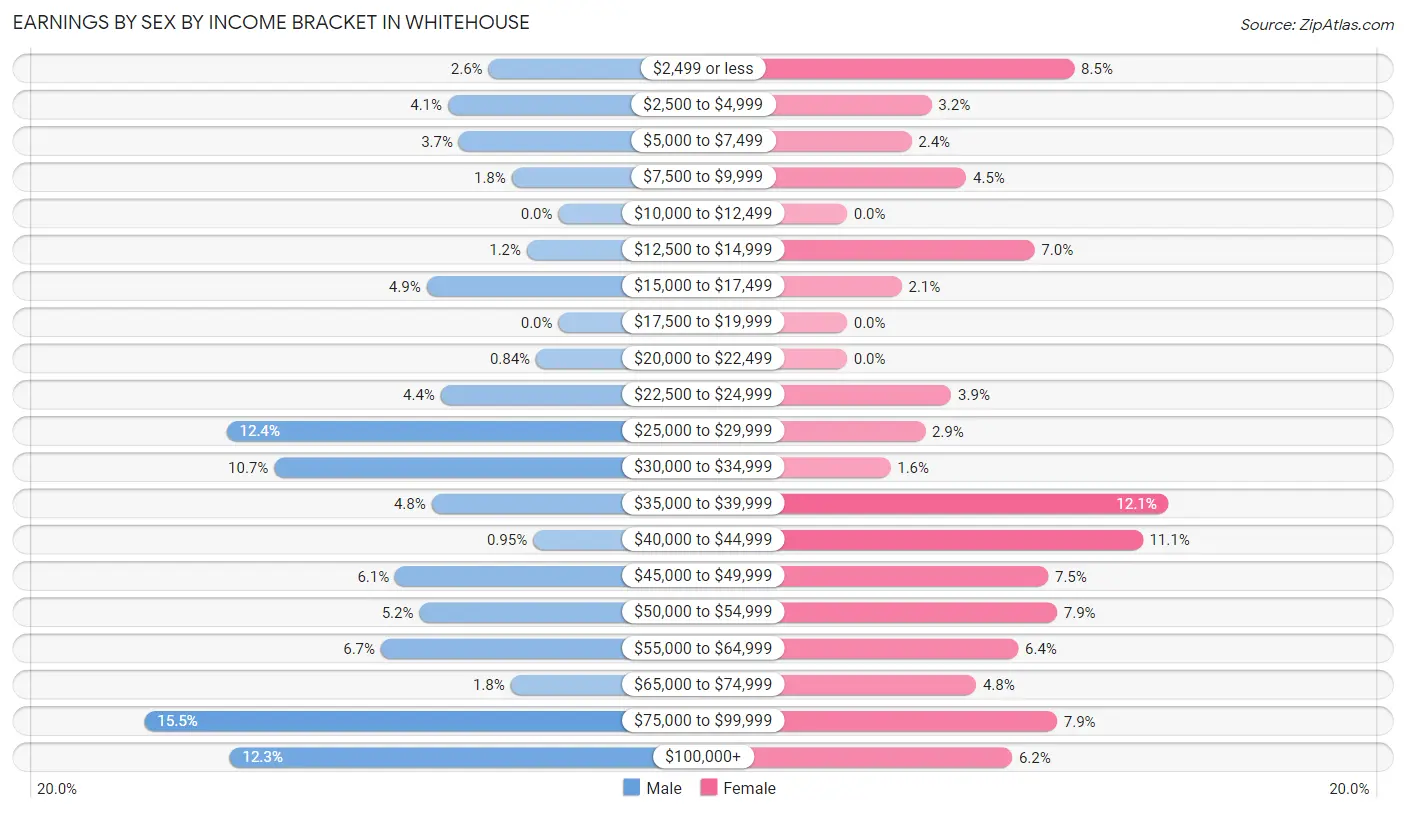
Earnings by Sex by Income Bracket in Whitehouse
The most common earnings brackets in Whitehouse are $75,000 to $99,999 for men (408 | 15.5%) and $35,000 to $39,999 for women (259 | 12.1%).
| Income | Male | Female |
| $2,499 or less | 69 (2.6%) | 183 (8.5%) |
| $2,500 to $4,999 | 109 (4.1%) | 68 (3.2%) |
| $5,000 to $7,499 | 98 (3.7%) | 52 (2.4%) |
| $7,500 to $9,999 | 46 (1.8%) | 96 (4.5%) |
| $10,000 to $12,499 | 0 (0.0%) | 0 (0.0%) |
| $12,500 to $14,999 | 31 (1.2%) | 151 (7.0%) |
| $15,000 to $17,499 | 130 (4.9%) | 44 (2.1%) |
| $17,500 to $19,999 | 0 (0.0%) | 0 (0.0%) |
| $20,000 to $22,499 | 22 (0.8%) | 0 (0.0%) |
| $22,500 to $24,999 | 116 (4.4%) | 84 (3.9%) |
| $25,000 to $29,999 | 327 (12.4%) | 63 (2.9%) |
| $30,000 to $34,999 | 280 (10.6%) | 35 (1.6%) |
| $35,000 to $39,999 | 125 (4.8%) | 259 (12.1%) |
| $40,000 to $44,999 | 25 (0.9%) | 238 (11.1%) |
| $45,000 to $49,999 | 161 (6.1%) | 162 (7.5%) |
| $50,000 to $54,999 | 137 (5.2%) | 169 (7.9%) |
| $55,000 to $64,999 | 175 (6.7%) | 138 (6.4%) |
| $65,000 to $74,999 | 47 (1.8%) | 104 (4.8%) |
| $75,000 to $99,999 | 408 (15.5%) | 169 (7.9%) |
| $100,000+ | 324 (12.3%) | 133 (6.2%) |
| Total | 2,630 (100.0%) | 2,148 (100.0%) |
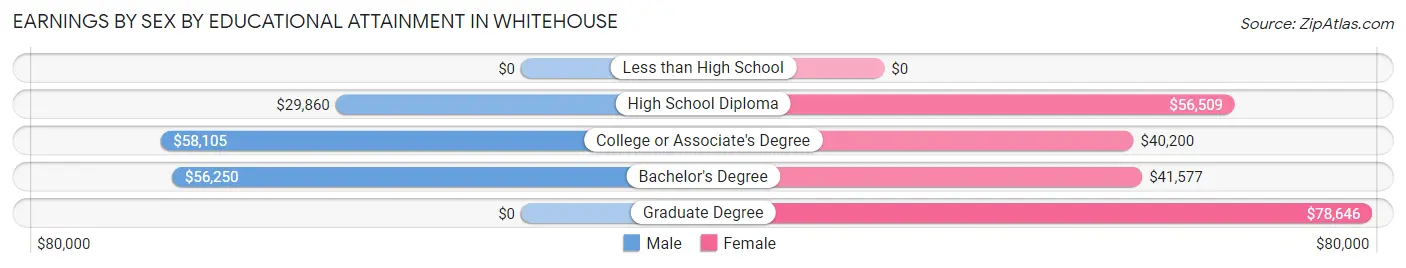
Earnings by Sex by Educational Attainment in Whitehouse
Average earnings in Whitehouse are $49,259 for men and $42,138 for women, a difference of 14.5%. Men with an educational attainment of college or associate's degree enjoy the highest average annual earnings of $58,105, while those with high school diploma education earn the least with $29,860. Women with an educational attainment of graduate degree earn the most with the average annual earnings of $78,646, while those with college or associate's degree education have the smallest earnings of $40,200.
| Educational Attainment | Male Income | Female Income |
| Less than High School | - | - |
| High School Diploma | $29,860 | $56,509 |
| College or Associate's Degree | $58,105 | $40,200 |
| Bachelor's Degree | $56,250 | $41,577 |
| Graduate Degree | - | - |
| Total | $49,259 | $42,138 |
Family Income in Whitehouse
Family Income Brackets in Whitehouse
According to the Whitehouse family income data, there are 817 families falling into the $100,000 to $149,999 income range, which is the most common income bracket and makes up 36.8% of all families.
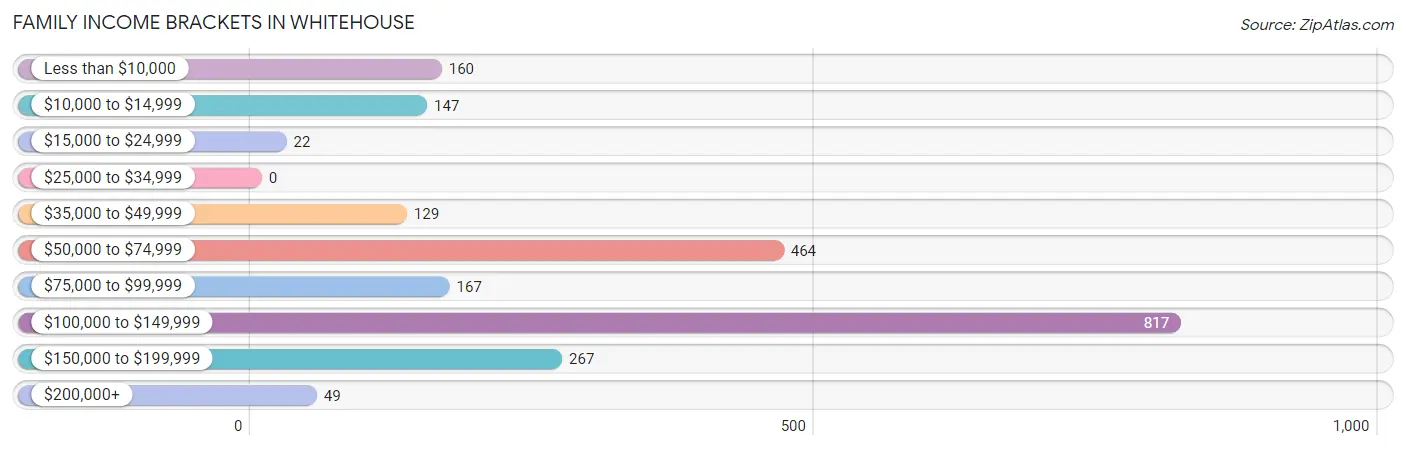
| Income Bracket | # Families | % Families |
| Less than $10,000 | 160 | 7.2% |
| $10,000 to $14,999 | 147 | 6.6% |
| $15,000 to $24,999 | 22 | 1.0% |
| $25,000 to $34,999 | 0 | 0.0% |
| $35,000 to $49,999 | 129 | 5.8% |
| $50,000 to $74,999 | 464 | 20.9% |
| $75,000 to $99,999 | 167 | 7.5% |
| $100,000 to $149,999 | 817 | 36.8% |
| $150,000 to $199,999 | 267 | 12.0% |
| $200,000+ | 49 | 2.2% |
Family Income by Famaliy Size in Whitehouse
5-person families (188 | 8.5%) account for the highest median family income in Whitehouse with $138,771 per family, while 2-person families (657 | 29.6%) have the highest median income of $41,438 per family member.
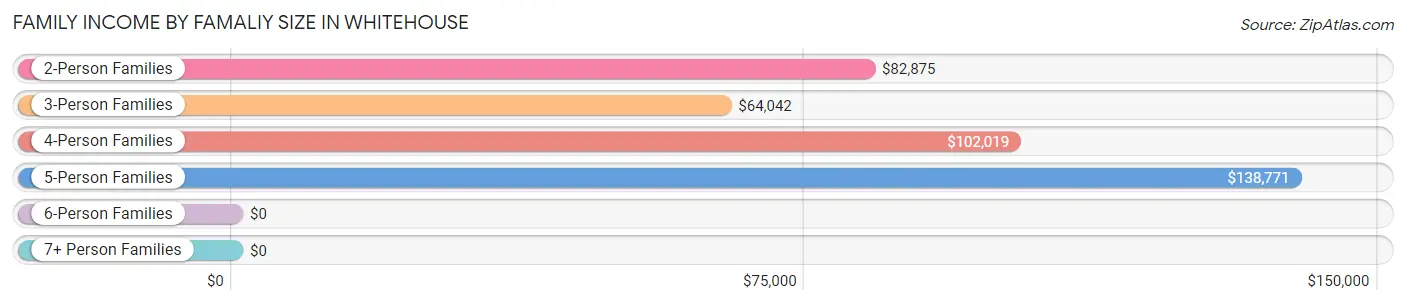
| Income Bracket | # Families | Median Income |
| 2-Person Families | 657 (29.6%) | $82,875 |
| 3-Person Families | 551 (24.8%) | $64,042 |
| 4-Person Families | 802 (36.1%) | $102,019 |
| 5-Person Families | 188 (8.5%) | $138,771 |
| 6-Person Families | 23 (1.0%) | $0 |
| 7+ Person Families | 0 (0.0%) | $0 |
| Total | 2,221 (100.0%) | $100,448 |
Family Income by Number of Earners in Whitehouse
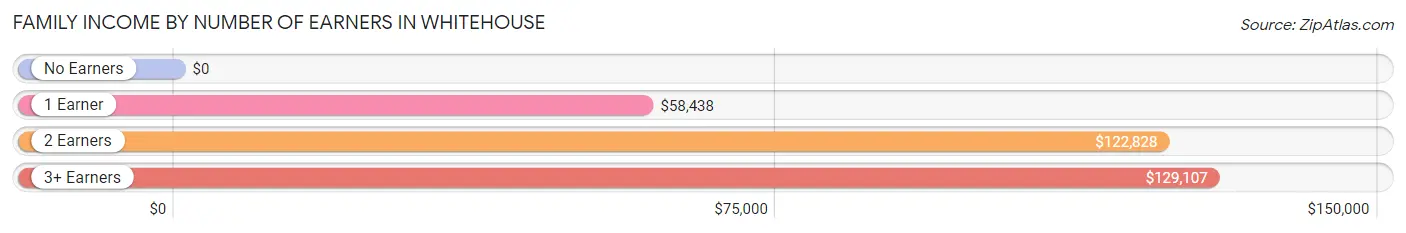
| Number of Earners | # Families | Median Income |
| No Earners | 368 (16.6%) | $0 |
| 1 Earner | 412 (18.5%) | $58,438 |
| 2 Earners | 886 (39.9%) | $122,828 |
| 3+ Earners | 555 (25.0%) | $129,107 |
| Total | 2,221 (100.0%) | $100,448 |
Household Income in Whitehouse
Household Income Brackets in Whitehouse
With 873 households falling in the category, the $100,000 to $149,999 income range is the most frequent in Whitehouse, accounting for 29.3% of all households. In contrast, only 72 households (2.4%) fall into the $200,000+ income bracket, making it the least populous group.
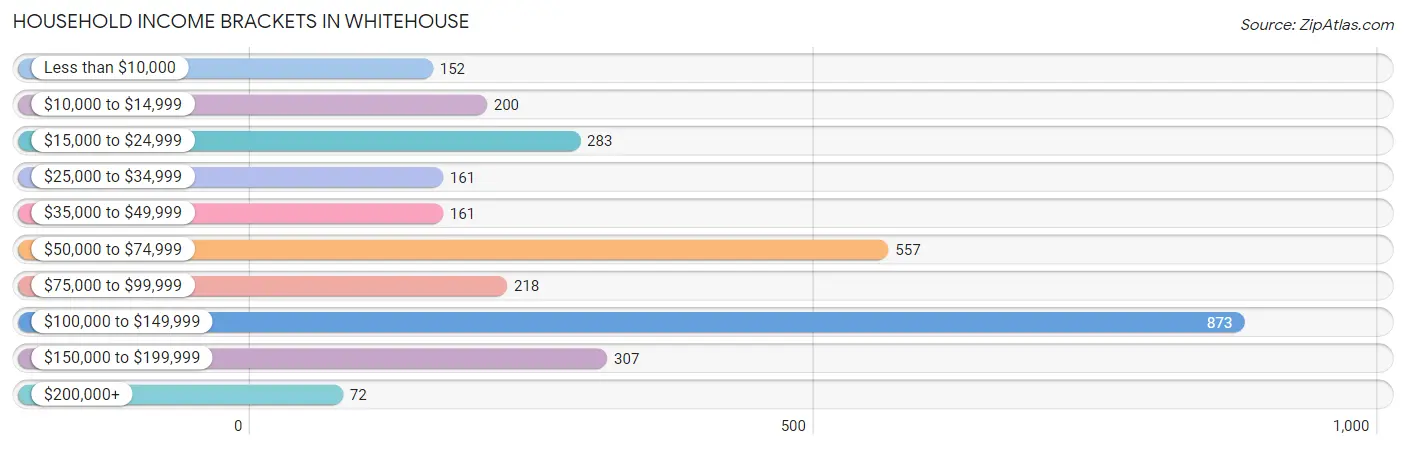
| Income Bracket | # Households | % Households |
| Less than $10,000 | 152 | 5.1% |
| $10,000 to $14,999 | 200 | 6.7% |
| $15,000 to $24,999 | 283 | 9.5% |
| $25,000 to $34,999 | 161 | 5.4% |
| $35,000 to $49,999 | 161 | 5.4% |
| $50,000 to $74,999 | 557 | 18.7% |
| $75,000 to $99,999 | 218 | 7.3% |
| $100,000 to $149,999 | 873 | 29.3% |
| $150,000 to $199,999 | 307 | 10.3% |
| $200,000+ | 72 | 2.4% |
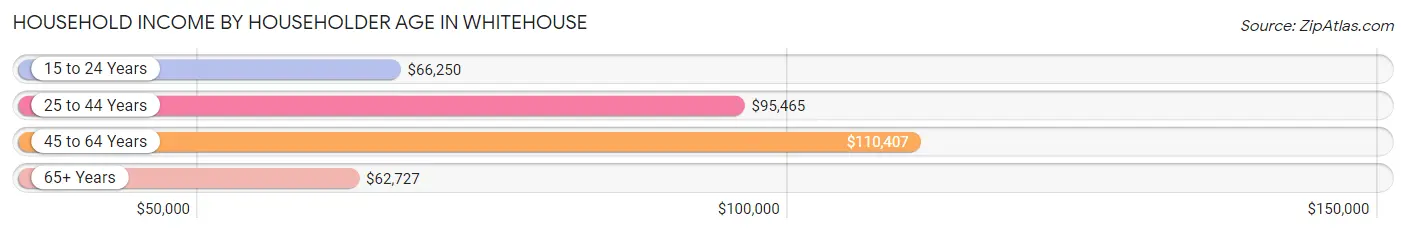
Household Income by Householder Age in Whitehouse
The median household income in Whitehouse is $72,900, with the highest median household income of $110,407 found in the 45 to 64 years age bracket for the primary householder. A total of 960 households (32.2%) fall into this category. Meanwhile, the 65+ years age bracket for the primary householder has the lowest median household income of $62,727, with 740 households (24.8%) in this group.
| Income Bracket | # Households | Median Income |
| 15 to 24 Years | 60 (2.0%) | $66,250 |
| 25 to 44 Years | 1,220 (40.9%) | $95,465 |
| 45 to 64 Years | 960 (32.2%) | $110,407 |
| 65+ Years | 740 (24.8%) | $62,727 |
| Total | 2,980 (100.0%) | $72,900 |
Poverty in Whitehouse
Income Below Poverty by Sex and Age in Whitehouse
With 8.3% poverty level for males and 15.6% for females among the residents of Whitehouse, 6 to 11 year old males and 5 year old females are the most vulnerable to poverty, with 70 males (21.7%) and 27 females (57.5%) in their respective age groups living below the poverty level.
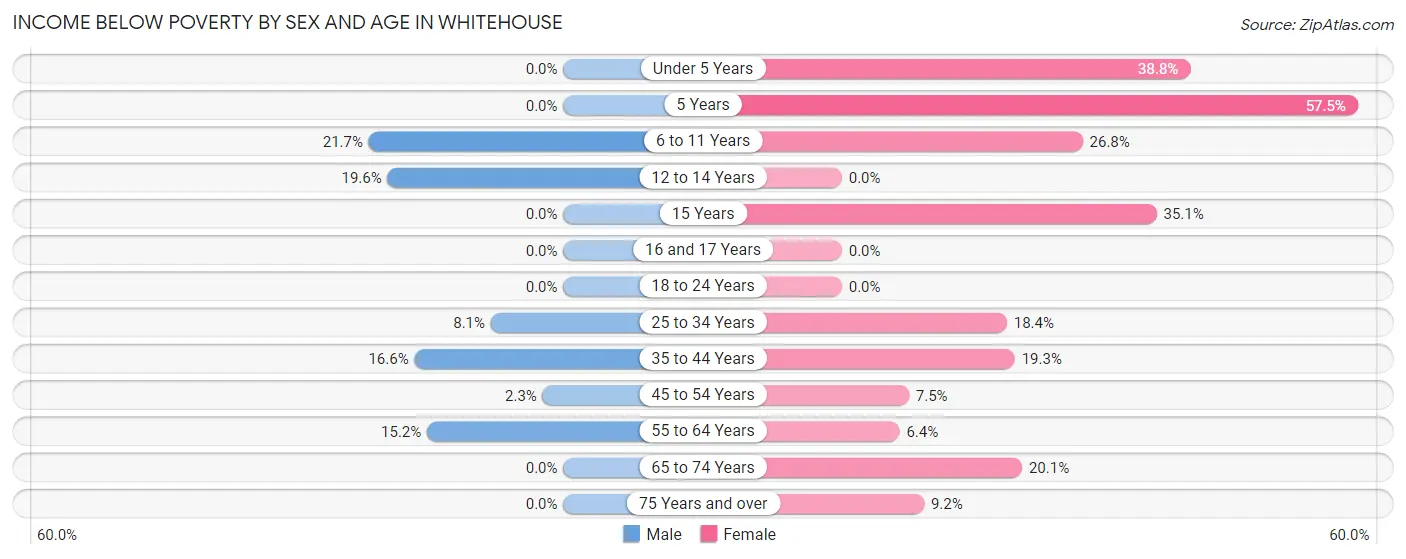
| Age Bracket | Male | Female |
| Under 5 Years | 0 (0.0%) | 64 (38.8%) |
| 5 Years | 0 (0.0%) | 27 (57.5%) |
| 6 to 11 Years | 70 (21.7%) | 114 (26.8%) |
| 12 to 14 Years | 47 (19.6%) | 0 (0.0%) |
| 15 Years | 0 (0.0%) | 34 (35.0%) |
| 16 and 17 Years | 0 (0.0%) | 0 (0.0%) |
| 18 to 24 Years | 0 (0.0%) | 0 (0.0%) |
| 25 to 34 Years | 65 (8.1%) | 102 (18.4%) |
| 35 to 44 Years | 97 (16.6%) | 119 (19.3%) |
| 45 to 54 Years | 11 (2.3%) | 38 (7.5%) |
| 55 to 64 Years | 88 (15.2%) | 26 (6.4%) |
| 65 to 74 Years | 0 (0.0%) | 61 (20.1%) |
| 75 Years and over | 0 (0.0%) | 29 (9.1%) |
| Total | 378 (8.3%) | 614 (15.6%) |
Income Above Poverty by Sex and Age in Whitehouse
According to the poverty statistics in Whitehouse, males aged under 5 years and females aged 12 to 14 years are the age groups that are most secure financially, with 100.0% of males and 100.0% of females in these age groups living above the poverty line.
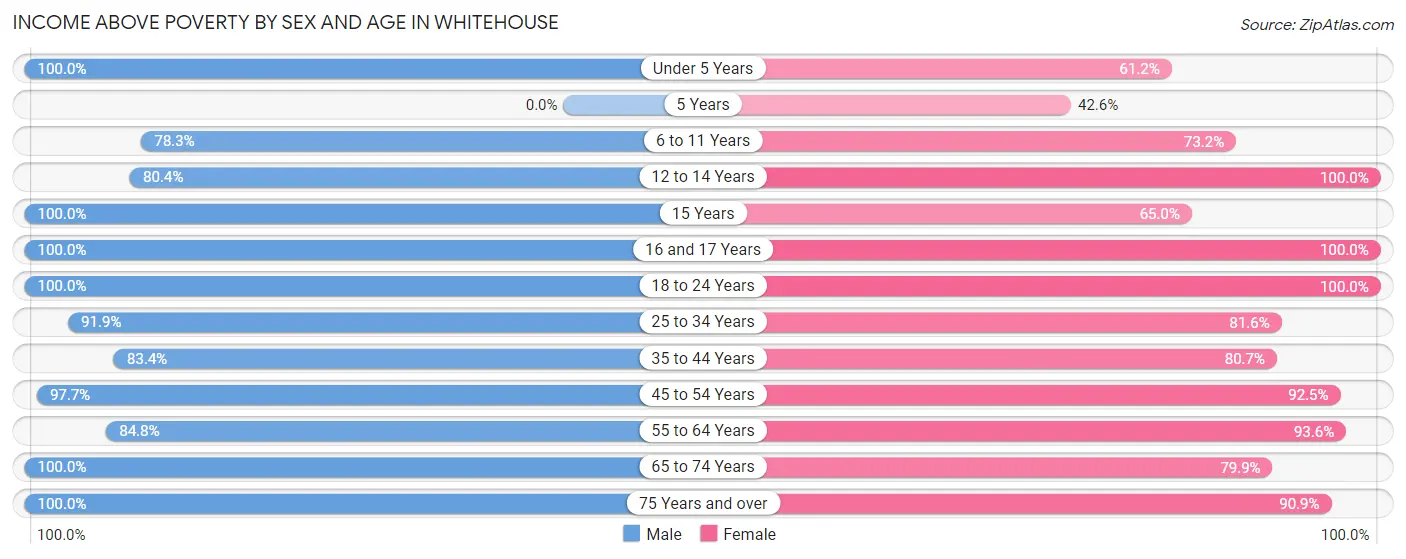
| Age Bracket | Male | Female |
| Under 5 Years | 337 (100.0%) | 101 (61.2%) |
| 5 Years | 0 (0.0%) | 20 (42.5%) |
| 6 to 11 Years | 253 (78.3%) | 311 (73.2%) |
| 12 to 14 Years | 193 (80.4%) | 59 (100.0%) |
| 15 Years | 129 (100.0%) | 63 (64.9%) |
| 16 and 17 Years | 247 (100.0%) | 127 (100.0%) |
| 18 to 24 Years | 374 (100.0%) | 317 (100.0%) |
| 25 to 34 Years | 740 (91.9%) | 453 (81.6%) |
| 35 to 44 Years | 488 (83.4%) | 499 (80.7%) |
| 45 to 54 Years | 467 (97.7%) | 471 (92.5%) |
| 55 to 64 Years | 492 (84.8%) | 379 (93.6%) |
| 65 to 74 Years | 218 (100.0%) | 243 (79.9%) |
| 75 Years and over | 230 (100.0%) | 288 (90.8%) |
| Total | 4,168 (91.7%) | 3,331 (84.4%) |
Income Below Poverty Among Married-Couple Families in Whitehouse
The poverty statistics for married-couple families in Whitehouse show that 3.8% or 60 of the total 1,565 families live below the poverty line. Families with no children have the highest poverty rate of 7.8%, comprising of 60 families. On the other hand, families with 1 or 2 children have the lowest poverty rate of 0.0%, which includes 0 families.
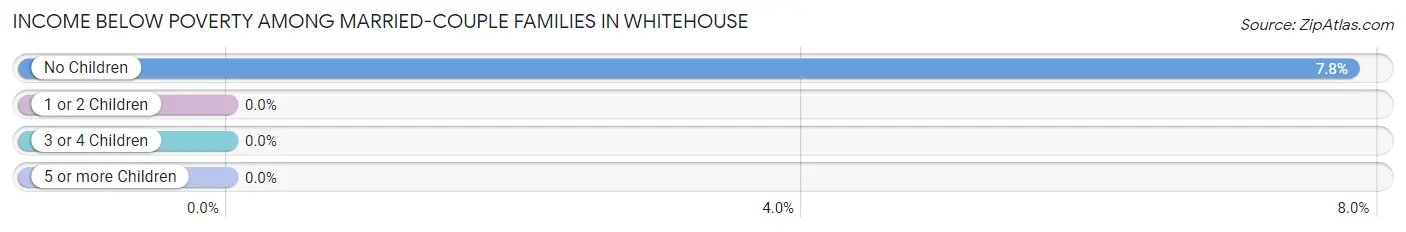
| Children | Above Poverty | Below Poverty |
| No Children | 708 (92.2%) | 60 (7.8%) |
| 1 or 2 Children | 715 (100.0%) | 0 (0.0%) |
| 3 or 4 Children | 82 (100.0%) | 0 (0.0%) |
| 5 or more Children | 0 (0.0%) | 0 (0.0%) |
| Total | 1,505 (96.2%) | 60 (3.8%) |
Income Below Poverty Among Single-Parent Households in Whitehouse
According to the poverty data in Whitehouse, 76.4% or 97 single-father households and 28.2% or 149 single-mother households are living below the poverty line. Among single-father households, those with 3 or 4 children have the highest poverty rate, with 97 households (100.0%) experiencing poverty. Likewise, among single-mother households, those with no children have the highest poverty rate, with 30 households (35.3%) falling below the poverty line.
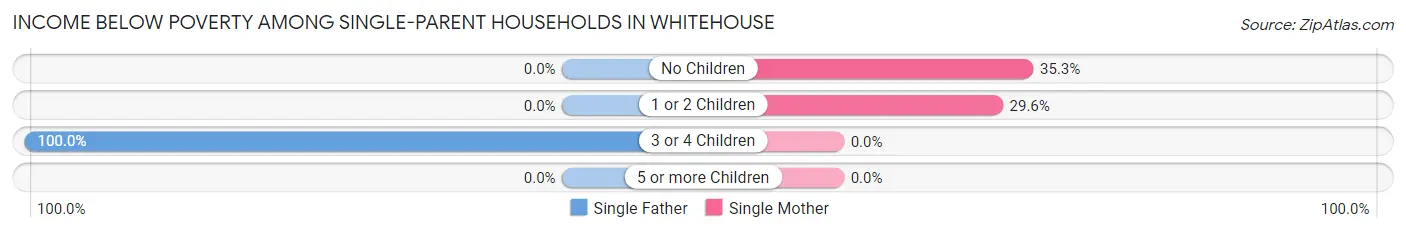
| Children | Single Father | Single Mother |
| No Children | 0 (0.0%) | 30 (35.3%) |
| 1 or 2 Children | 0 (0.0%) | 119 (29.6%) |
| 3 or 4 Children | 97 (100.0%) | 0 (0.0%) |
| 5 or more Children | 0 (0.0%) | 0 (0.0%) |
| Total | 97 (76.4%) | 149 (28.2%) |
Income Below Poverty Among Married-Couple vs Single-Parent Households in Whitehouse
The poverty data for Whitehouse shows that 60 of the married-couple family households (3.8%) and 246 of the single-parent households (37.5%) are living below the poverty level. Within the married-couple family households, those with no children have the highest poverty rate, with 60 households (7.8%) falling below the poverty line. Among the single-parent households, those with 3 or 4 children have the highest poverty rate, with 97 household (69.8%) living below poverty.
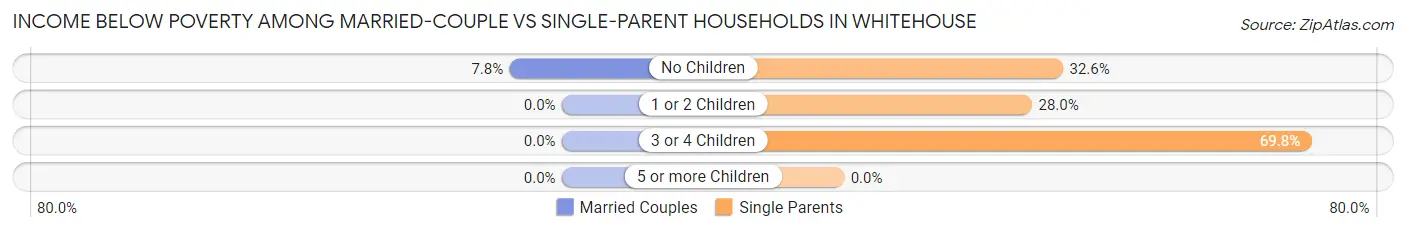
| Children | Married-Couple Families | Single-Parent Households |
| No Children | 60 (7.8%) | 30 (32.6%) |
| 1 or 2 Children | 0 (0.0%) | 119 (28.0%) |
| 3 or 4 Children | 0 (0.0%) | 97 (69.8%) |
| 5 or more Children | 0 (0.0%) | 0 (0.0%) |
| Total | 60 (3.8%) | 246 (37.5%) |
Race in Whitehouse
The most populous races in Whitehouse are White / Caucasian (7,513 | 88.3%), Hispanic or Latino (1,011 | 11.9%), and Two or more Races (723 | 8.5%).
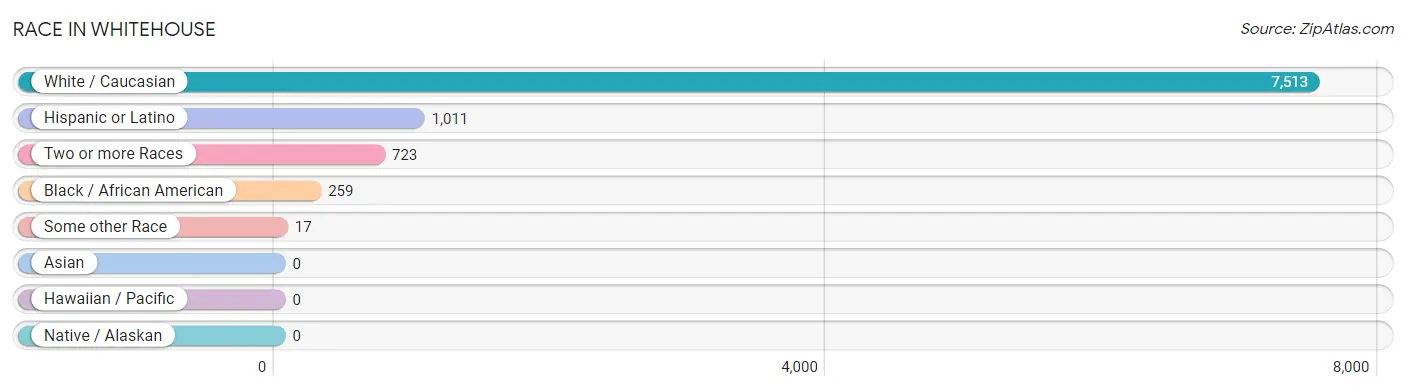
| Race | # Population | % Population |
| Asian | 0 | 0.0% |
| Black / African American | 259 | 3.0% |
| Hawaiian / Pacific | 0 | 0.0% |
| Hispanic or Latino | 1,011 | 11.9% |
| Native / Alaskan | 0 | 0.0% |
| White / Caucasian | 7,513 | 88.3% |
| Two or more Races | 723 | 8.5% |
| Some other Race | 17 | 0.2% |
| Total | 8,512 | 100.0% |
Ancestry in Whitehouse
The most populous ancestries reported in Whitehouse are American (1,477 | 17.3%), English (1,280 | 15.0%), German (1,180 | 13.9%), Mexican (956 | 11.2%), and Irish (539 | 6.3%), together accounting for 63.8% of all Whitehouse residents.
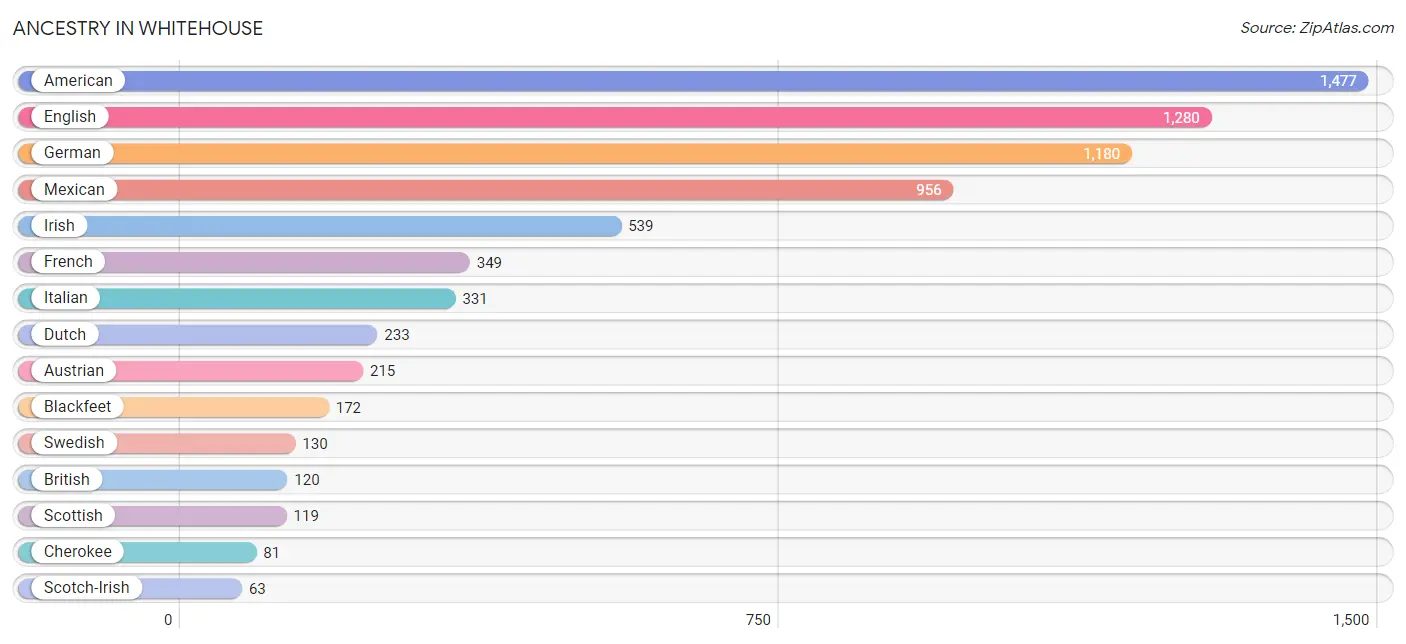
| Ancestry | # Population | % Population |
| American | 1,477 | 17.3% |
| Austrian | 215 | 2.5% |
| Basque | 51 | 0.6% |
| Blackfeet | 172 | 2.0% |
| British | 120 | 1.4% |
| Cherokee | 81 | 0.9% |
| Danish | 23 | 0.3% |
| Dutch | 233 | 2.7% |
| English | 1,280 | 15.0% |
| European | 22 | 0.3% |
| French | 349 | 4.1% |
| French Canadian | 11 | 0.1% |
| German | 1,180 | 13.9% |
| Greek | 22 | 0.3% |
| Irish | 539 | 6.3% |
| Italian | 331 | 3.9% |
| Mexican | 956 | 11.2% |
| Norwegian | 37 | 0.4% |
| Scandinavian | 36 | 0.4% |
| Scotch-Irish | 63 | 0.7% |
| Scottish | 119 | 1.4% |
| Spaniard | 38 | 0.4% |
| Spanish | 17 | 0.2% |
| Swedish | 130 | 1.5% |
| Welsh | 38 | 0.4% | View All 25 Rows |
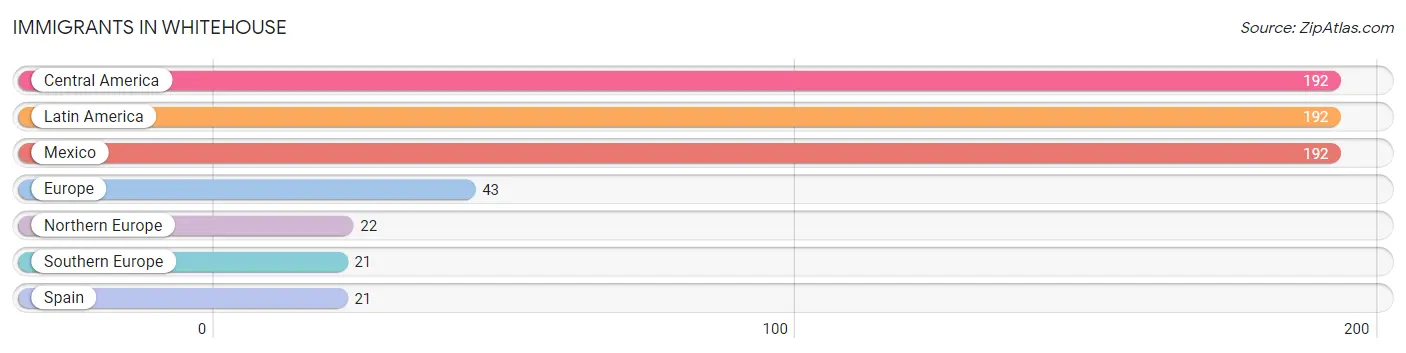
Immigrants in Whitehouse
The most numerous immigrant groups reported in Whitehouse came from Central America (192 | 2.3%), Latin America (192 | 2.3%), Mexico (192 | 2.3%), Europe (43 | 0.5%), and Northern Europe (22 | 0.3%), together accounting for 7.5% of all Whitehouse residents.
| Immigration Origin | # Population | % Population |
| Central America | 192 | 2.3% |
| Europe | 43 | 0.5% |
| Latin America | 192 | 2.3% |
| Mexico | 192 | 2.3% |
| Northern Europe | 22 | 0.3% |
| Southern Europe | 21 | 0.3% |
| Spain | 21 | 0.3% | View All 7 Rows |
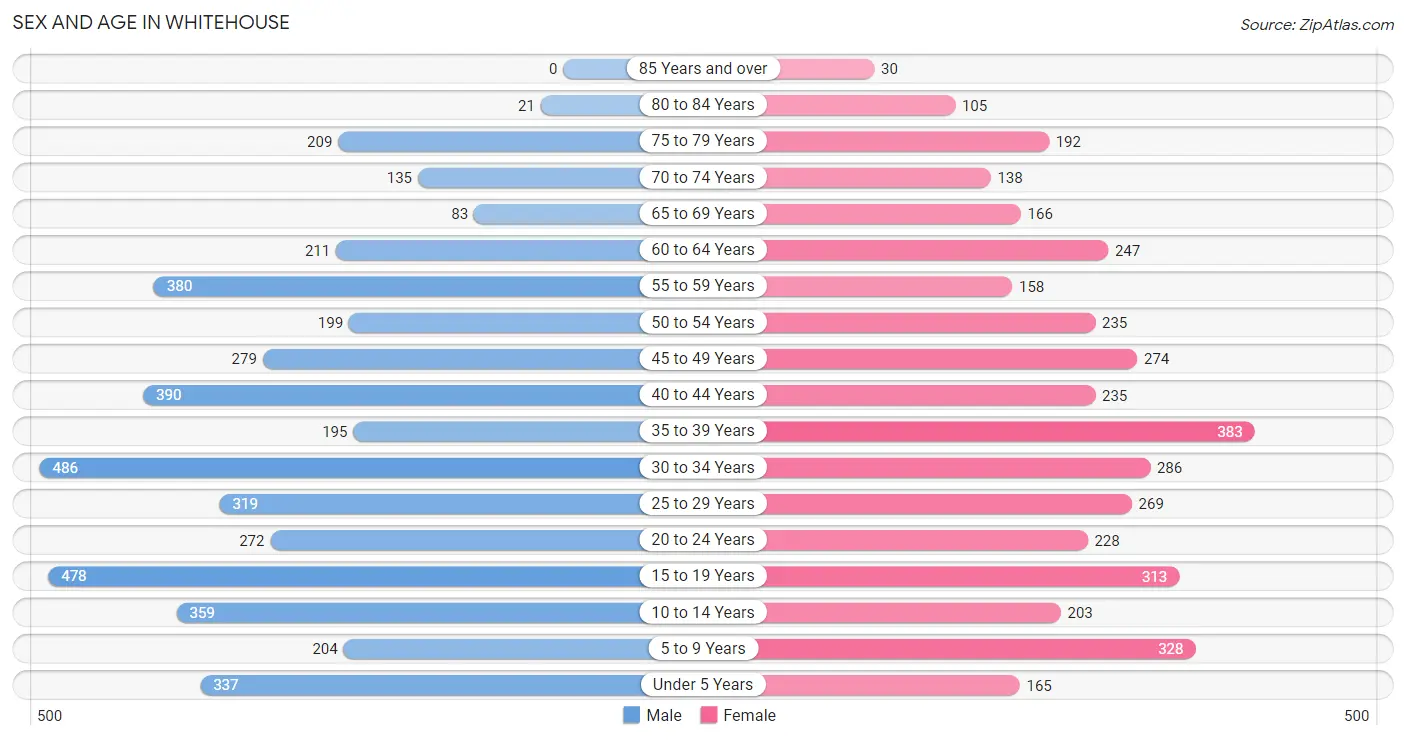
Sex and Age in Whitehouse
Sex and Age in Whitehouse
The most populous age groups in Whitehouse are 30 to 34 Years (486 | 10.7%) for men and 35 to 39 Years (383 | 9.7%) for women.
| Age Bracket | Male | Female |
| Under 5 Years | 337 (7.4%) | 165 (4.2%) |
| 5 to 9 Years | 204 (4.5%) | 328 (8.3%) |
| 10 to 14 Years | 359 (7.9%) | 203 (5.1%) |
| 15 to 19 Years | 478 (10.5%) | 313 (7.9%) |
| 20 to 24 Years | 272 (6.0%) | 228 (5.8%) |
| 25 to 29 Years | 319 (7.0%) | 269 (6.8%) |
| 30 to 34 Years | 486 (10.7%) | 286 (7.2%) |
| 35 to 39 Years | 195 (4.3%) | 383 (9.7%) |
| 40 to 44 Years | 390 (8.6%) | 235 (5.9%) |
| 45 to 49 Years | 279 (6.1%) | 274 (6.9%) |
| 50 to 54 Years | 199 (4.4%) | 235 (5.9%) |
| 55 to 59 Years | 380 (8.3%) | 158 (4.0%) |
| 60 to 64 Years | 211 (4.6%) | 247 (6.2%) |
| 65 to 69 Years | 83 (1.8%) | 166 (4.2%) |
| 70 to 74 Years | 135 (3.0%) | 138 (3.5%) |
| 75 to 79 Years | 209 (4.6%) | 192 (4.9%) |
| 80 to 84 Years | 21 (0.5%) | 105 (2.6%) |
| 85 Years and over | 0 (0.0%) | 30 (0.8%) |
| Total | 4,557 (100.0%) | 3,955 (100.0%) |
Families and Households in Whitehouse
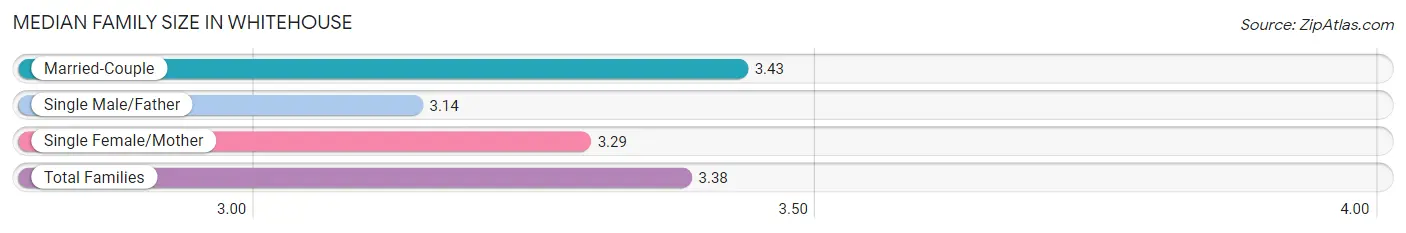
Median Family Size in Whitehouse
The median family size in Whitehouse is 3.38 persons per family, with married-couple families (1,565 | 70.5%) accounting for the largest median family size of 3.43 persons per family. On the other hand, single male/father families (127 | 5.7%) represent the smallest median family size with 3.14 persons per family.
| Family Type | # Families | Family Size |
| Married-Couple | 1,565 (70.5%) | 3.43 |
| Single Male/Father | 127 (5.7%) | 3.14 |
| Single Female/Mother | 529 (23.8%) | 3.29 |
| Total Families | 2,221 (100.0%) | 3.38 |
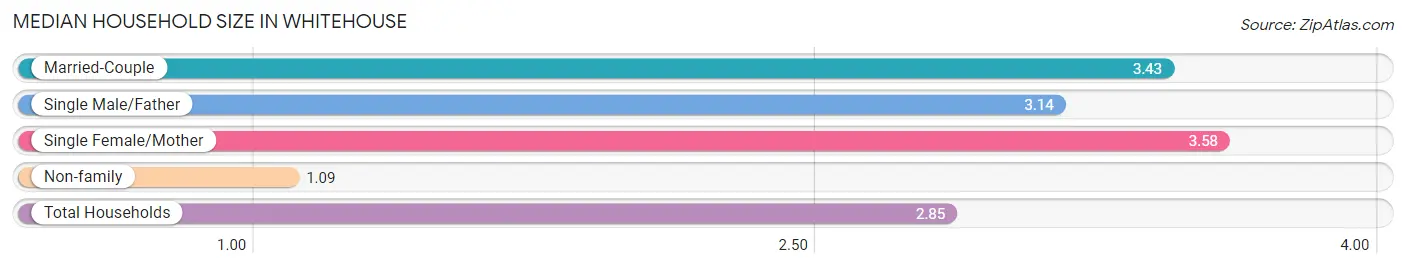
Median Household Size in Whitehouse
The median household size in Whitehouse is 2.85 persons per household, with single female/mother households (529 | 17.7%) accounting for the largest median household size of 3.58 persons per household. non-family households (759 | 25.5%) represent the smallest median household size with 1.09 persons per household.
| Household Type | # Households | Household Size |
| Married-Couple | 1,565 (52.5%) | 3.43 |
| Single Male/Father | 127 (4.3%) | 3.14 |
| Single Female/Mother | 529 (17.7%) | 3.58 |
| Non-family | 759 (25.5%) | 1.09 |
| Total Households | 2,980 (100.0%) | 2.85 |
Household Size by Marriage Status in Whitehouse
Out of a total of 2,980 households in Whitehouse, 2,221 (74.5%) are family households, while 759 (25.5%) are nonfamily households. The most numerous type of family households are 4-person households, comprising 921, and the most common type of nonfamily households are 1-person households, comprising 708.
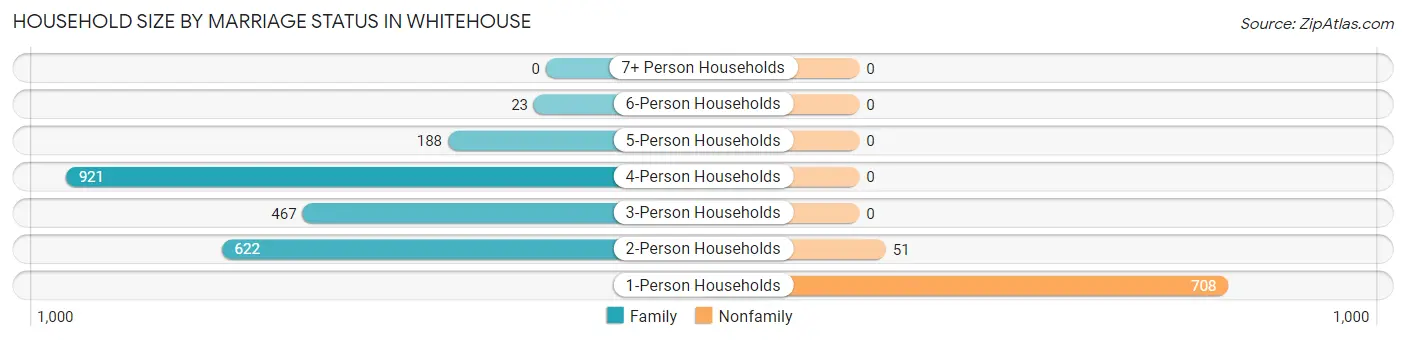
| Household Size | Family Households | Nonfamily Households |
| 1-Person Households | - | 708 (23.8%) |
| 2-Person Households | 622 (20.9%) | 51 (1.7%) |
| 3-Person Households | 467 (15.7%) | 0 (0.0%) |
| 4-Person Households | 921 (30.9%) | 0 (0.0%) |
| 5-Person Households | 188 (6.3%) | 0 (0.0%) |
| 6-Person Households | 23 (0.8%) | 0 (0.0%) |
| 7+ Person Households | 0 (0.0%) | 0 (0.0%) |
| Total | 2,221 (74.5%) | 759 (25.5%) |
Female Fertility in Whitehouse
Fertility by Age in Whitehouse
Average fertility rate in Whitehouse is 38.0 births per 1,000 women. Women in the age bracket of 20 to 34 years have the highest fertility rate with 100.0 births per 1,000 women. Women in the age bracket of 20 to 34 years acount for 100.0% of all women with births.
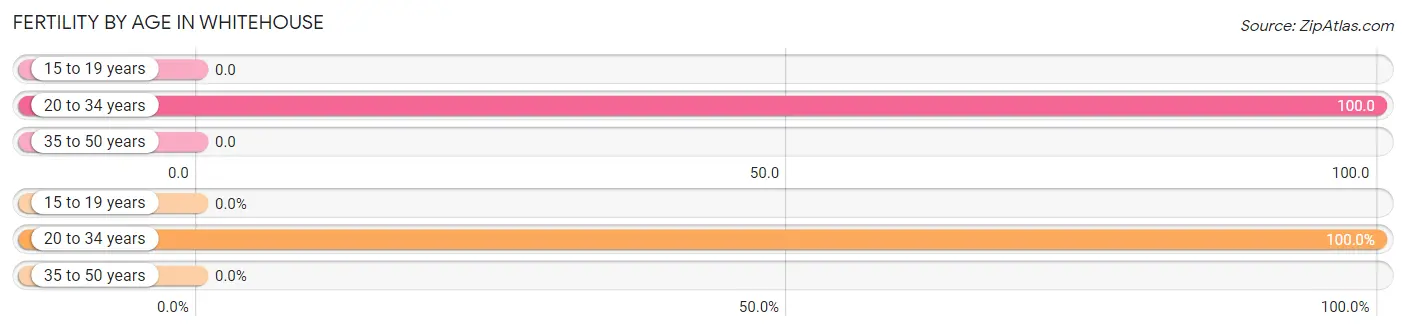
| Age Bracket | Women with Births | Births / 1,000 Women |
| 15 to 19 years | 0 (0.0%) | 0.0 |
| 20 to 34 years | 78 (100.0%) | 100.0 |
| 35 to 50 years | 0 (0.0%) | 0.0 |
| Total | 78 (100.0%) | 38.0 |
Fertility by Age by Marriage Status in Whitehouse
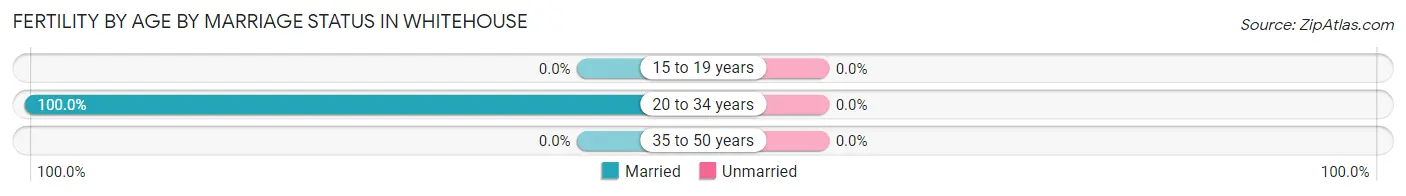
| Age Bracket | Married | Unmarried |
| 15 to 19 years | 0 (0.0%) | 0 (0.0%) |
| 20 to 34 years | 78 (100.0%) | 0 (0.0%) |
| 35 to 50 years | 0 (0.0%) | 0 (0.0%) |
| Total | 78 (100.0%) | 0 (0.0%) |
Fertility by Education in Whitehouse
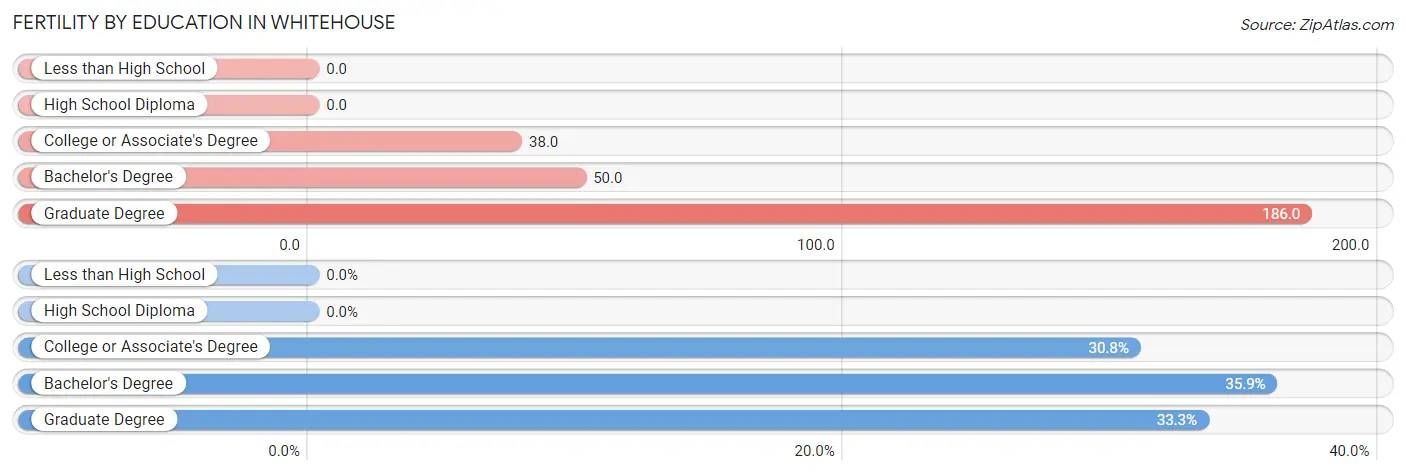
| Educational Attainment | Women with Births | Births / 1,000 Women |
| Less than High School | 0 (0.0%) | 0.0 |
| High School Diploma | 0 (0.0%) | 0.0 |
| College or Associate's Degree | 24 (30.8%) | 38.0 |
| Bachelor's Degree | 28 (35.9%) | 50.0 |
| Graduate Degree | 26 (33.3%) | 186.0 |
| Total | 78 (100.0%) | 38.0 |
Fertility by Education by Marriage Status in Whitehouse
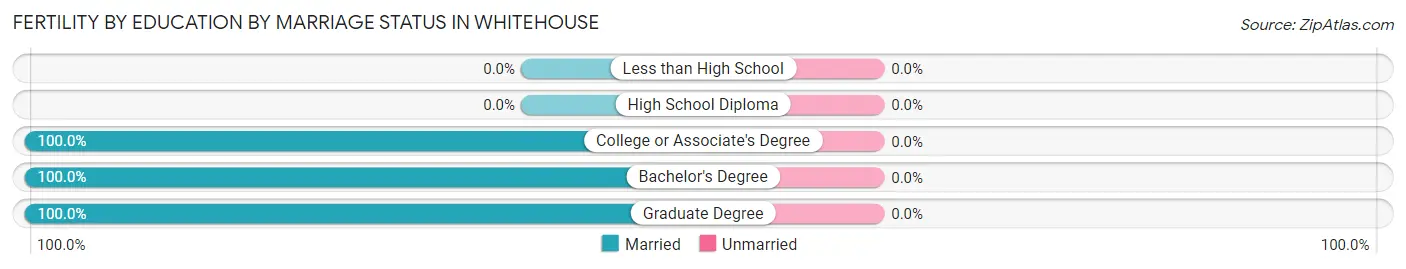
| Educational Attainment | Married | Unmarried |
| Less than High School | 0 (0.0%) | 0 (0.0%) |
| High School Diploma | 0 (0.0%) | 0 (0.0%) |
| College or Associate's Degree | 24 (100.0%) | 0 (0.0%) |
| Bachelor's Degree | 28 (100.0%) | 0 (0.0%) |
| Graduate Degree | 26 (100.0%) | 0 (0.0%) |
| Total | 78 (100.0%) | 0 (0.0%) |
Employment Characteristics in Whitehouse
Employment by Class of Employer in Whitehouse
Among the 4,442 employed individuals in Whitehouse, private company employees (2,982 | 67.1%), local government employees (548 | 12.3%), and state government employees (260 | 5.9%) make up the most common classes of employment.
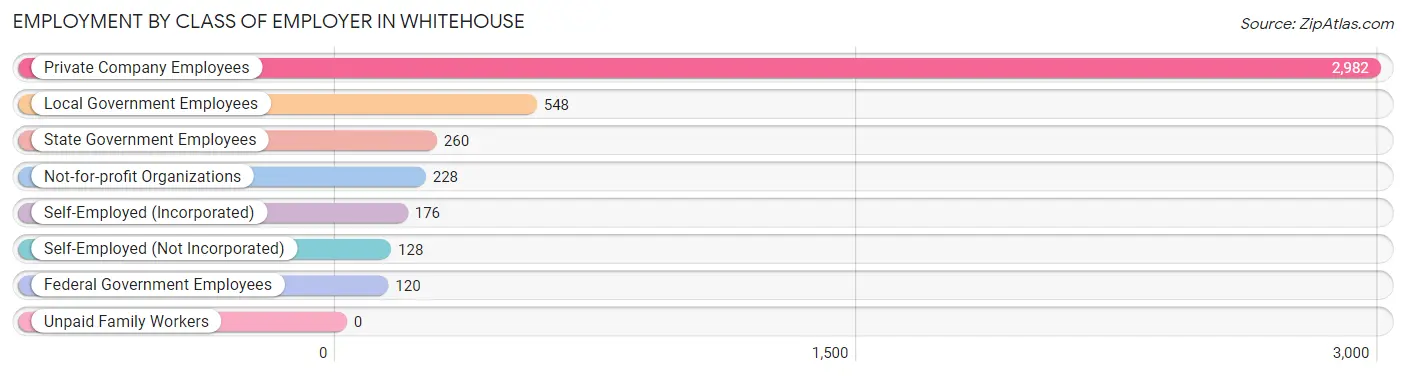
| Employer Class | # Employees | % Employees |
| Private Company Employees | 2,982 | 67.1% |
| Self-Employed (Incorporated) | 176 | 4.0% |
| Self-Employed (Not Incorporated) | 128 | 2.9% |
| Not-for-profit Organizations | 228 | 5.1% |
| Local Government Employees | 548 | 12.3% |
| State Government Employees | 260 | 5.9% |
| Federal Government Employees | 120 | 2.7% |
| Unpaid Family Workers | 0 | 0.0% |
| Total | 4,442 | 100.0% |
Employment Status by Age in Whitehouse
According to the labor force statistics for Whitehouse, out of the total population over 16 years of age (6,690), 70.8% or 4,737 individuals are in the labor force, with 6.1% or 289 of them unemployed. The age group with the highest labor force participation rate is 45 to 54 years, with 97.5% or 962 individuals in the labor force. Within the labor force, the 25 to 29 years age range has the highest percentage of unemployed individuals, with 26.5% or 144 of them being unemployed.
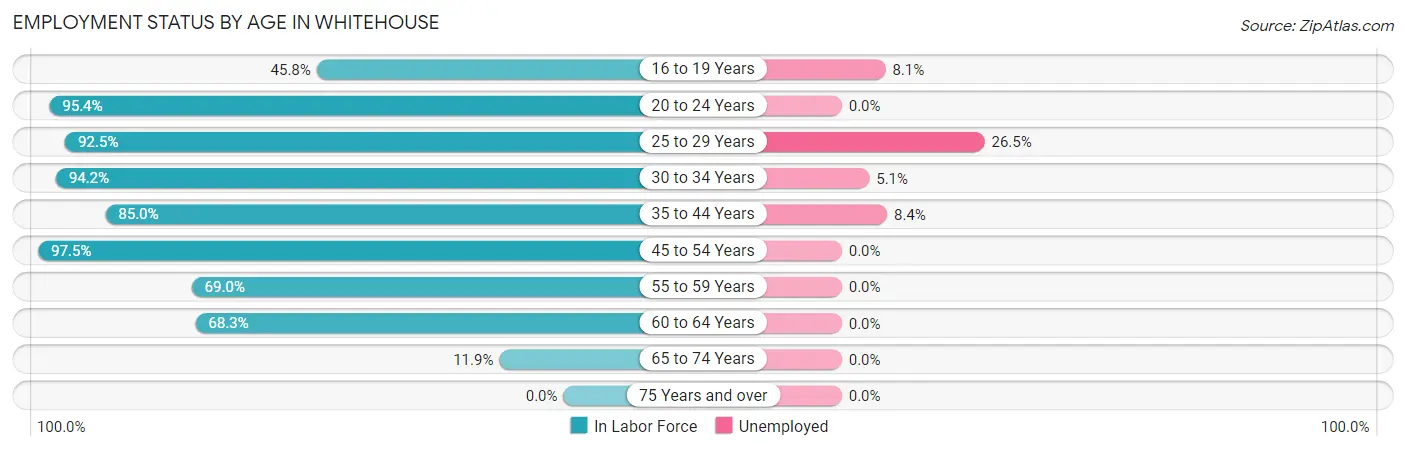
| Age Bracket | In Labor Force | Unemployed |
| 16 to 19 Years | 259 (45.8%) | 21 (8.1%) |
| 20 to 24 Years | 477 (95.4%) | 0 (0.0%) |
| 25 to 29 Years | 544 (92.5%) | 144 (26.5%) |
| 30 to 34 Years | 727 (94.2%) | 37 (5.1%) |
| 35 to 44 Years | 1,023 (85.0%) | 86 (8.4%) |
| 45 to 54 Years | 962 (97.5%) | 0 (0.0%) |
| 55 to 59 Years | 371 (69.0%) | 0 (0.0%) |
| 60 to 64 Years | 313 (68.3%) | 0 (0.0%) |
| 65 to 74 Years | 62 (11.9%) | 0 (0.0%) |
| 75 Years and over | 0 (0.0%) | 0 (0.0%) |
| Total | 4,737 (70.8%) | 289 (6.1%) |
Employment Status by Educational Attainment in Whitehouse
According to labor force statistics for Whitehouse, 86.7% of individuals (3,941) out of the total population between 25 and 64 years of age (4,546) are in the labor force, with 6.8% or 268 of them being unemployed. The group with the highest labor force participation rate are those with the educational attainment of bachelor's degree or higher, with 92.8% or 1,067 individuals in the labor force. Within the labor force, individuals with less than high school education have the highest percentage of unemployment, with 64.3% or 144 of them being unemployed.
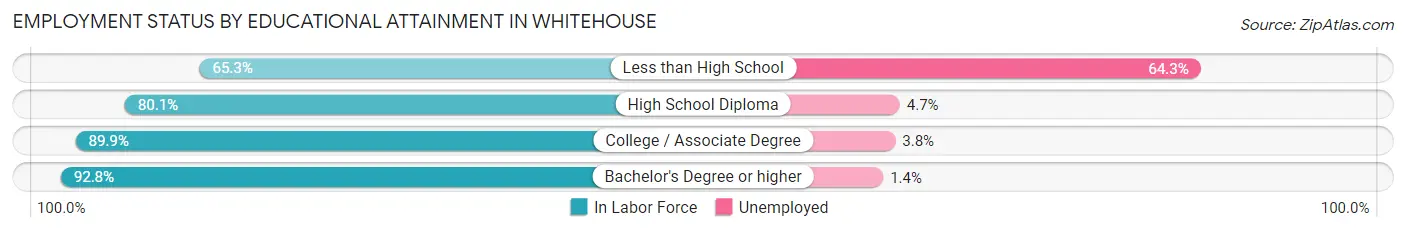
| Educational Attainment | In Labor Force | Unemployed |
| Less than High School | 224 (65.3%) | 221 (64.3%) |
| High School Diploma | 785 (80.1%) | 46 (4.7%) |
| College / Associate Degree | 1,864 (89.9%) | 79 (3.8%) |
| Bachelor's Degree or higher | 1,067 (92.8%) | 16 (1.4%) |
| Total | 3,941 (86.7%) | 309 (6.8%) |
Employment Occupations by Sex in Whitehouse
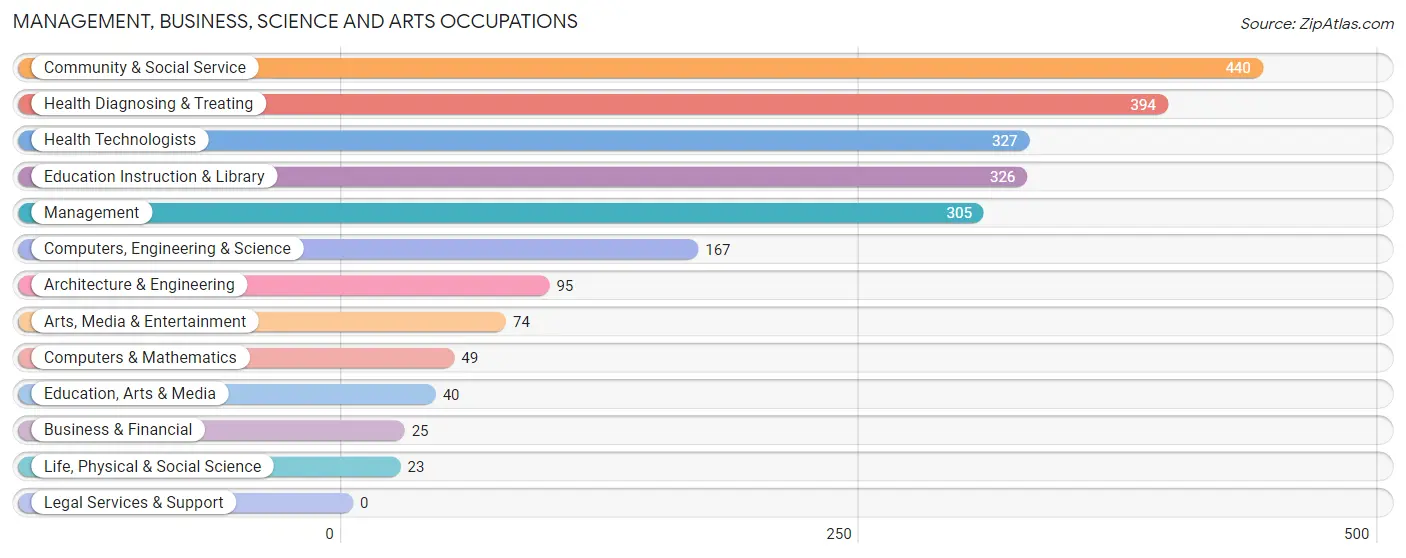
Management, Business, Science and Arts Occupations
The most common Management, Business, Science and Arts occupations in Whitehouse are Community & Social Service (440 | 10.0%), Health Diagnosing & Treating (394 | 8.9%), Health Technologists (327 | 7.4%), Education Instruction & Library (326 | 7.4%), and Management (305 | 6.9%).
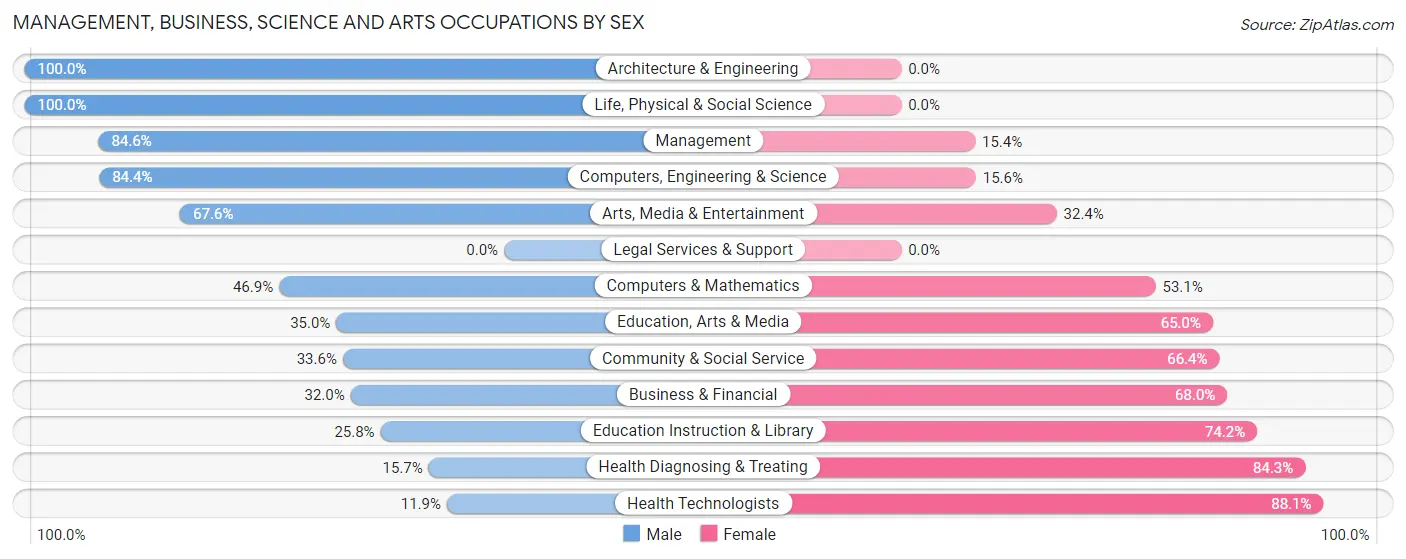
Management, Business, Science and Arts Occupations by Sex
Within the Management, Business, Science and Arts occupations in Whitehouse, the most male-oriented occupations are Architecture & Engineering (100.0%), Life, Physical & Social Science (100.0%), and Management (84.6%), while the most female-oriented occupations are Health Technologists (88.1%), Health Diagnosing & Treating (84.3%), and Education Instruction & Library (74.2%).
| Occupation | Male | Female |
| Management | 258 (84.6%) | 47 (15.4%) |
| Business & Financial | 8 (32.0%) | 17 (68.0%) |
| Computers, Engineering & Science | 141 (84.4%) | 26 (15.6%) |
| Computers & Mathematics | 23 (46.9%) | 26 (53.1%) |
| Architecture & Engineering | 95 (100.0%) | 0 (0.0%) |
| Life, Physical & Social Science | 23 (100.0%) | 0 (0.0%) |
| Community & Social Service | 148 (33.6%) | 292 (66.4%) |
| Education, Arts & Media | 14 (35.0%) | 26 (65.0%) |
| Legal Services & Support | 0 (0.0%) | 0 (0.0%) |
| Education Instruction & Library | 84 (25.8%) | 242 (74.2%) |
| Arts, Media & Entertainment | 50 (67.6%) | 24 (32.4%) |
| Health Diagnosing & Treating | 62 (15.7%) | 332 (84.3%) |
| Health Technologists | 39 (11.9%) | 288 (88.1%) |
| Total (Category) | 617 (46.4%) | 714 (53.6%) |
| Total (Overall) | 2,417 (54.6%) | 2,007 (45.4%) |
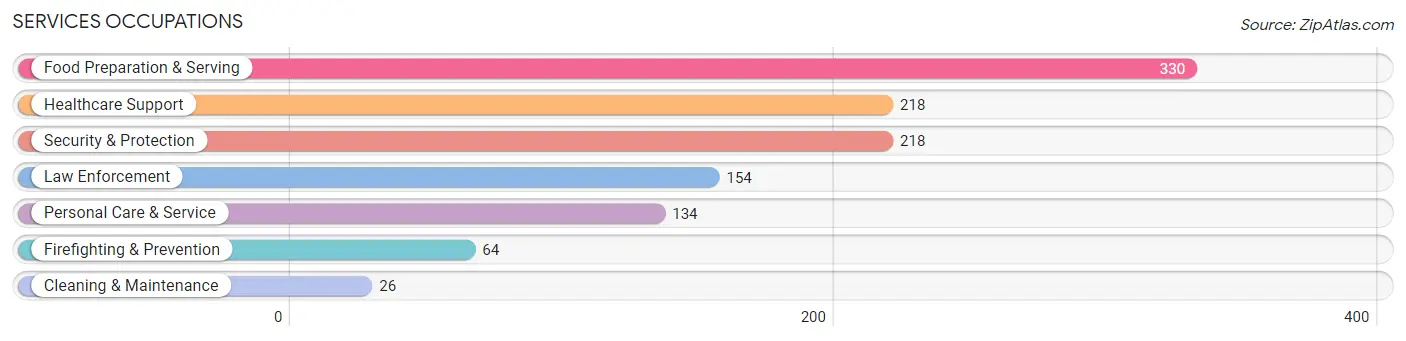
Services Occupations
The most common Services occupations in Whitehouse are Food Preparation & Serving (330 | 7.5%), Healthcare Support (218 | 4.9%), Security & Protection (218 | 4.9%), Law Enforcement (154 | 3.5%), and Personal Care & Service (134 | 3.0%).
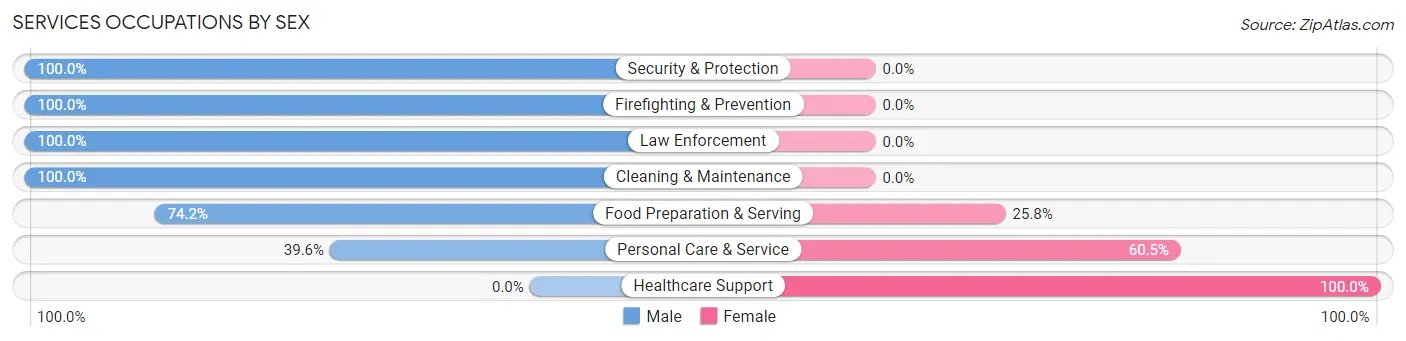
Services Occupations by Sex
Within the Services occupations in Whitehouse, the most male-oriented occupations are Security & Protection (100.0%), Firefighting & Prevention (100.0%), and Law Enforcement (100.0%), while the most female-oriented occupations are Healthcare Support (100.0%), Personal Care & Service (60.5%), and Food Preparation & Serving (25.8%).
| Occupation | Male | Female |
| Healthcare Support | 0 (0.0%) | 218 (100.0%) |
| Security & Protection | 218 (100.0%) | 0 (0.0%) |
| Firefighting & Prevention | 64 (100.0%) | 0 (0.0%) |
| Law Enforcement | 154 (100.0%) | 0 (0.0%) |
| Food Preparation & Serving | 245 (74.2%) | 85 (25.8%) |
| Cleaning & Maintenance | 26 (100.0%) | 0 (0.0%) |
| Personal Care & Service | 53 (39.6%) | 81 (60.5%) |
| Total (Category) | 542 (58.5%) | 384 (41.5%) |
| Total (Overall) | 2,417 (54.6%) | 2,007 (45.4%) |
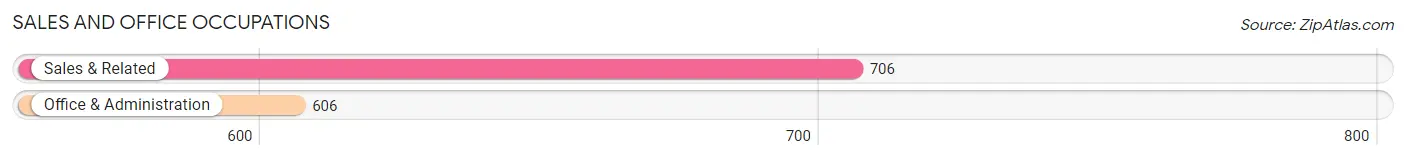
Sales and Office Occupations
The most common Sales and Office occupations in Whitehouse are Sales & Related (706 | 16.0%), and Office & Administration (606 | 13.7%).
Sales and Office Occupations by Sex
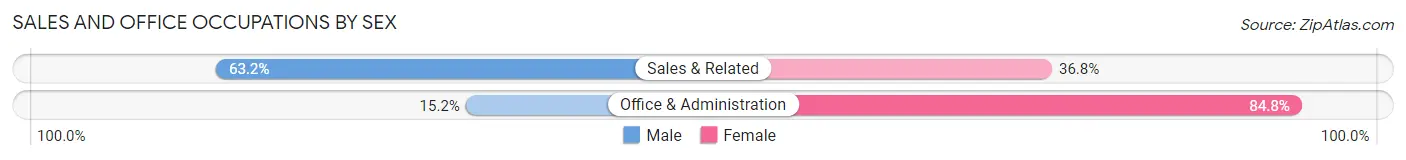
| Occupation | Male | Female |
| Sales & Related | 446 (63.2%) | 260 (36.8%) |
| Office & Administration | 92 (15.2%) | 514 (84.8%) |
| Total (Category) | 538 (41.0%) | 774 (59.0%) |
| Total (Overall) | 2,417 (54.6%) | 2,007 (45.4%) |
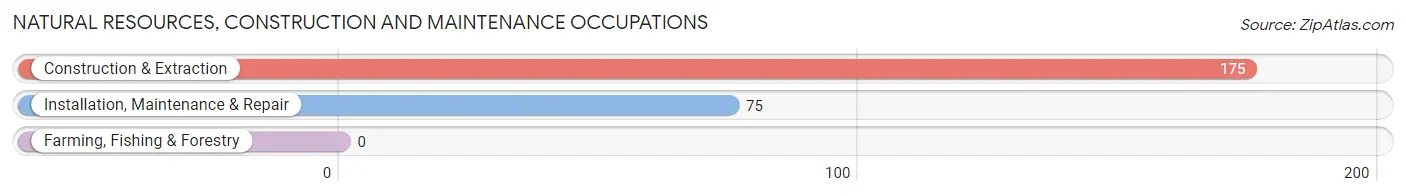
Natural Resources, Construction and Maintenance Occupations
The most common Natural Resources, Construction and Maintenance occupations in Whitehouse are Construction & Extraction (175 | 4.0%), and Installation, Maintenance & Repair (75 | 1.7%).
Natural Resources, Construction and Maintenance Occupations by Sex
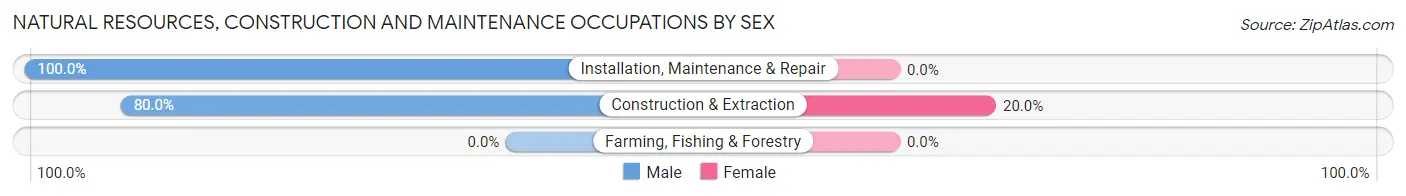
| Occupation | Male | Female |
| Farming, Fishing & Forestry | 0 (0.0%) | 0 (0.0%) |
| Construction & Extraction | 140 (80.0%) | 35 (20.0%) |
| Installation, Maintenance & Repair | 75 (100.0%) | 0 (0.0%) |
| Total (Category) | 215 (86.0%) | 35 (14.0%) |
| Total (Overall) | 2,417 (54.6%) | 2,007 (45.4%) |
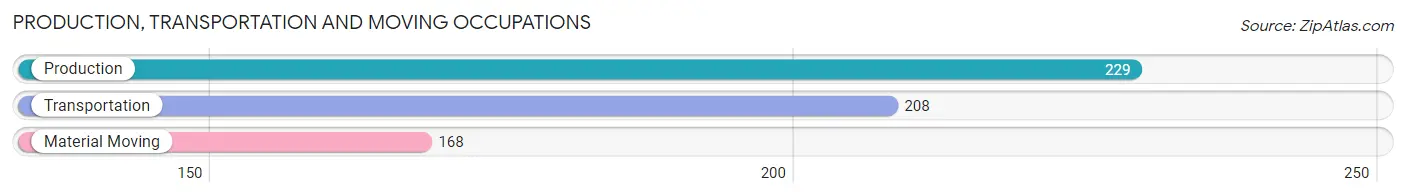
Production, Transportation and Moving Occupations
The most common Production, Transportation and Moving occupations in Whitehouse are Production (229 | 5.2%), Transportation (208 | 4.7%), and Material Moving (168 | 3.8%).
Production, Transportation and Moving Occupations by Sex
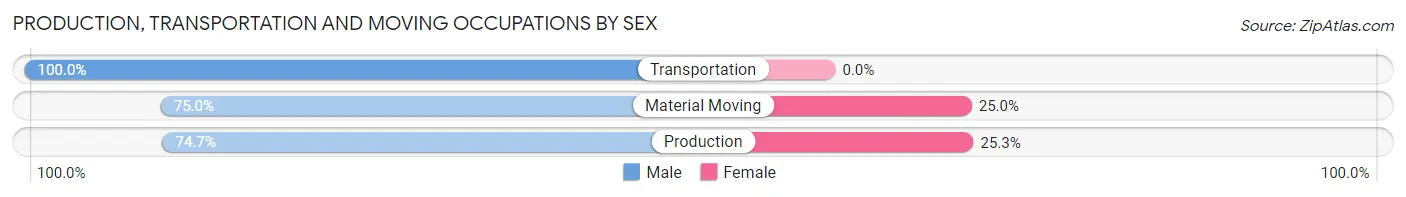
| Occupation | Male | Female |
| Production | 171 (74.7%) | 58 (25.3%) |
| Transportation | 208 (100.0%) | 0 (0.0%) |
| Material Moving | 126 (75.0%) | 42 (25.0%) |
| Total (Category) | 505 (83.5%) | 100 (16.5%) |
| Total (Overall) | 2,417 (54.6%) | 2,007 (45.4%) |
Employment Industries by Sex in Whitehouse
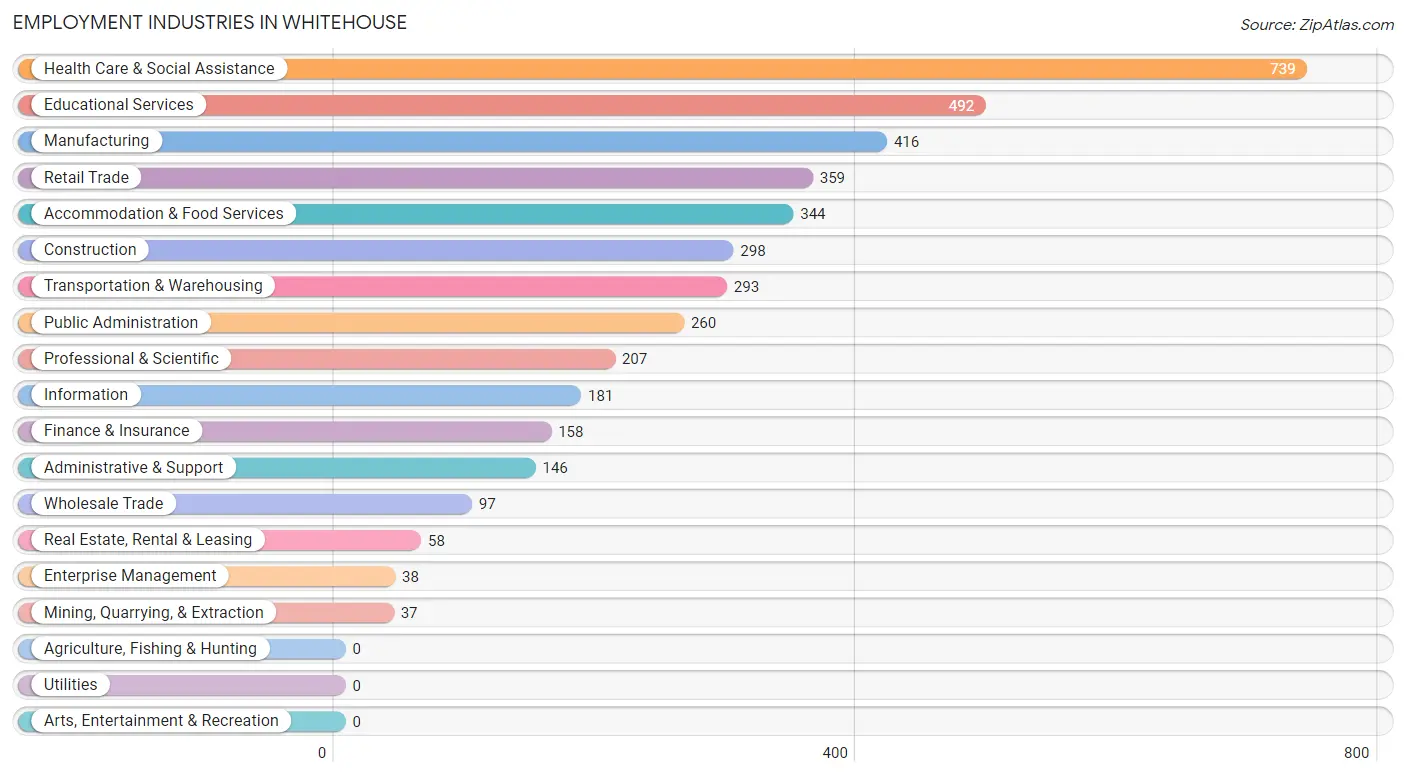
Employment Industries in Whitehouse
The major employment industries in Whitehouse include Health Care & Social Assistance (739 | 16.7%), Educational Services (492 | 11.1%), Manufacturing (416 | 9.4%), Retail Trade (359 | 8.1%), and Accommodation & Food Services (344 | 7.8%).
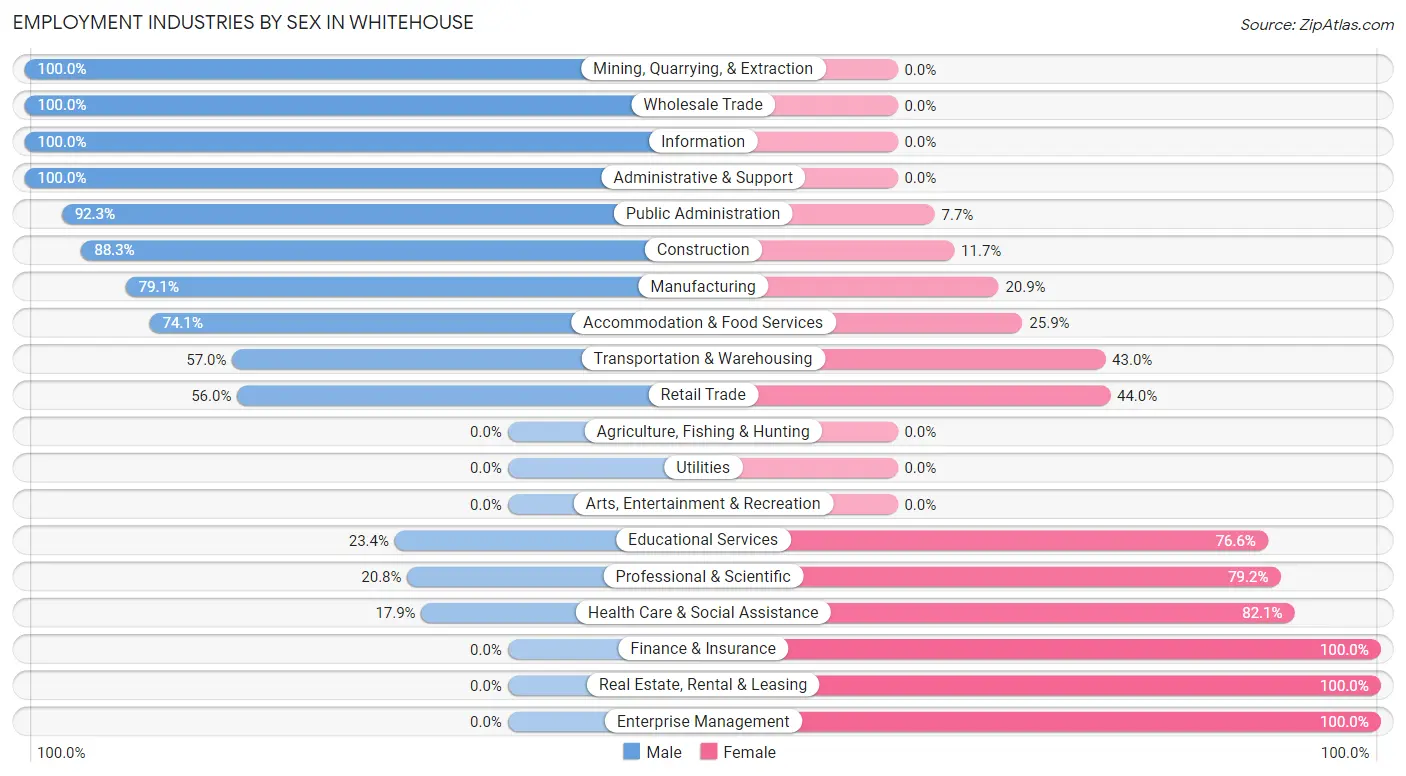
Employment Industries by Sex in Whitehouse
The Whitehouse industries that see more men than women are Mining, Quarrying, & Extraction (100.0%), Wholesale Trade (100.0%), and Information (100.0%), whereas the industries that tend to have a higher number of women are Finance & Insurance (100.0%), Real Estate, Rental & Leasing (100.0%), and Enterprise Management (100.0%).
| Industry | Male | Female |
| Agriculture, Fishing & Hunting | 0 (0.0%) | 0 (0.0%) |
| Mining, Quarrying, & Extraction | 37 (100.0%) | 0 (0.0%) |
| Construction | 263 (88.3%) | 35 (11.7%) |
| Manufacturing | 329 (79.1%) | 87 (20.9%) |
| Wholesale Trade | 97 (100.0%) | 0 (0.0%) |
| Retail Trade | 201 (56.0%) | 158 (44.0%) |
| Transportation & Warehousing | 167 (57.0%) | 126 (43.0%) |
| Utilities | 0 (0.0%) | 0 (0.0%) |
| Information | 181 (100.0%) | 0 (0.0%) |
| Finance & Insurance | 0 (0.0%) | 158 (100.0%) |
| Real Estate, Rental & Leasing | 0 (0.0%) | 58 (100.0%) |
| Professional & Scientific | 43 (20.8%) | 164 (79.2%) |
| Enterprise Management | 0 (0.0%) | 38 (100.0%) |
| Administrative & Support | 146 (100.0%) | 0 (0.0%) |
| Educational Services | 115 (23.4%) | 377 (76.6%) |
| Health Care & Social Assistance | 132 (17.9%) | 607 (82.1%) |
| Arts, Entertainment & Recreation | 0 (0.0%) | 0 (0.0%) |
| Accommodation & Food Services | 255 (74.1%) | 89 (25.9%) |
| Public Administration | 240 (92.3%) | 20 (7.7%) |
| Total | 2,417 (54.6%) | 2,007 (45.4%) |
Education in Whitehouse
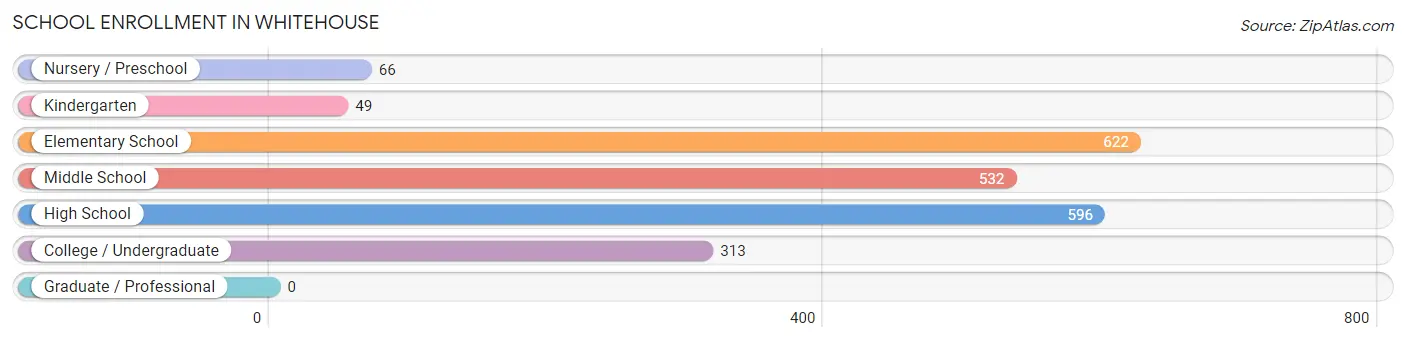
School Enrollment in Whitehouse
The most common levels of schooling among the 2,178 students in Whitehouse are elementary school (622 | 28.6%), high school (596 | 27.4%), and middle school (532 | 24.4%).
| School Level | # Students | % Students |
| Nursery / Preschool | 66 | 3.0% |
| Kindergarten | 49 | 2.2% |
| Elementary School | 622 | 28.6% |
| Middle School | 532 | 24.4% |
| High School | 596 | 27.4% |
| College / Undergraduate | 313 | 14.4% |
| Graduate / Professional | 0 | 0.0% |
| Total | 2,178 | 100.0% |
School Enrollment by Age by Funding Source in Whitehouse
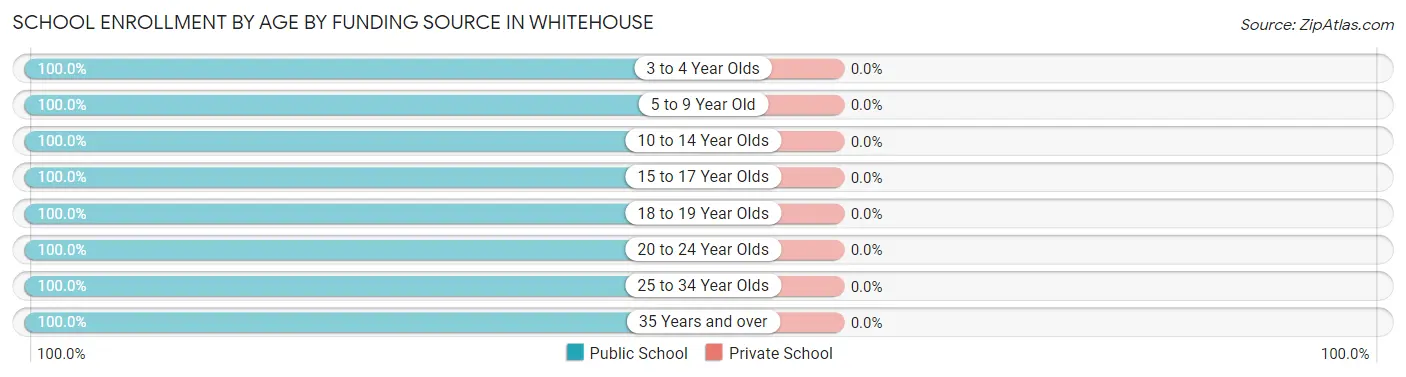
| Age Bracket | Public School | Private School |
| 3 to 4 Year Olds | 46 (100.0%) | 0 (0.0%) |
| 5 to 9 Year Old | 532 (100.0%) | 0 (0.0%) |
| 10 to 14 Year Olds | 562 (100.0%) | 0 (0.0%) |
| 15 to 17 Year Olds | 600 (100.0%) | 0 (0.0%) |
| 18 to 19 Year Olds | 111 (100.0%) | 0 (0.0%) |
| 20 to 24 Year Olds | 88 (100.0%) | 0 (0.0%) |
| 25 to 34 Year Olds | 119 (100.0%) | 0 (0.0%) |
| 35 Years and over | 120 (100.0%) | 0 (0.0%) |
| Total | 2,178 (100.0%) | 0 (0.0%) |
Educational Attainment by Field of Study in Whitehouse
Science & technology (384 | 24.8%), education (327 | 21.1%), business (316 | 20.4%), liberal arts & history (93 | 6.0%), and arts & humanities (84 | 5.4%) are the most common fields of study among 1,548 individuals in Whitehouse who have obtained a bachelor's degree or higher.
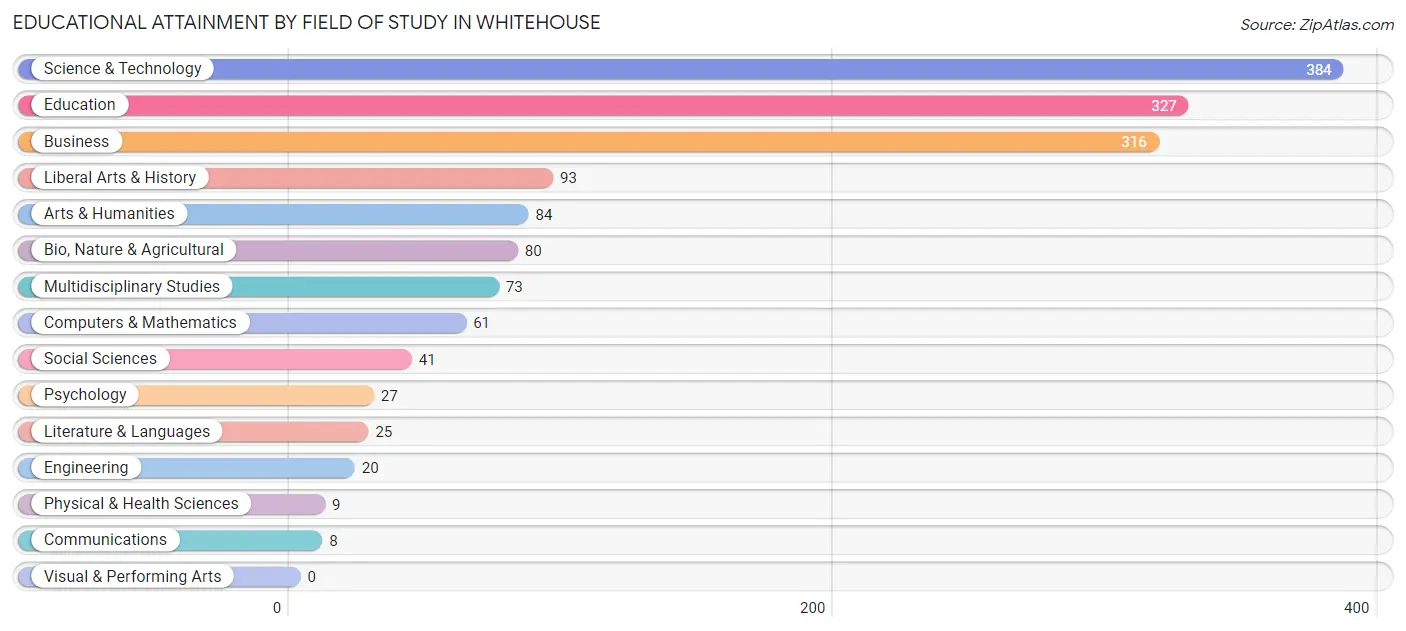
| Field of Study | # Graduates | % Graduates |
| Computers & Mathematics | 61 | 3.9% |
| Bio, Nature & Agricultural | 80 | 5.2% |
| Physical & Health Sciences | 9 | 0.6% |
| Psychology | 27 | 1.7% |
| Social Sciences | 41 | 2.6% |
| Engineering | 20 | 1.3% |
| Multidisciplinary Studies | 73 | 4.7% |
| Science & Technology | 384 | 24.8% |
| Business | 316 | 20.4% |
| Education | 327 | 21.1% |
| Literature & Languages | 25 | 1.6% |
| Liberal Arts & History | 93 | 6.0% |
| Visual & Performing Arts | 0 | 0.0% |
| Communications | 8 | 0.5% |
| Arts & Humanities | 84 | 5.4% |
| Total | 1,548 | 100.0% |
Transportation & Commute in Whitehouse
Vehicle Availability by Sex in Whitehouse
The most prevalent vehicle ownership categories in Whitehouse are males with 2 vehicles (939, accounting for 38.4%) and females with 2 vehicles (664, making up 47.0%).
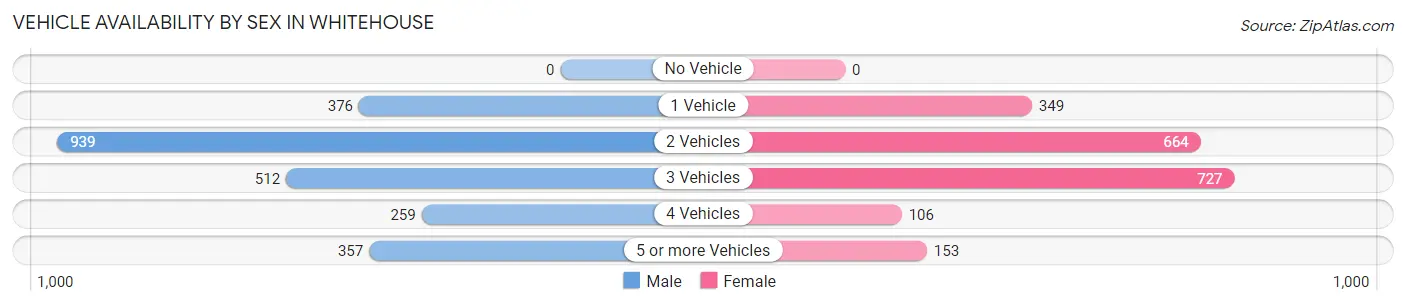
| Vehicles Available | Male | Female |
| No Vehicle | 0 (0.0%) | 0 (0.0%) |
| 1 Vehicle | 376 (15.4%) | 349 (17.5%) |
| 2 Vehicles | 939 (38.4%) | 664 (33.2%) |
| 3 Vehicles | 512 (21.0%) | 727 (36.4%) |
| 4 Vehicles | 259 (10.6%) | 106 (5.3%) |
| 5 or more Vehicles | 357 (14.6%) | 153 (7.6%) |
| Total | 2,443 (100.0%) | 1,999 (100.0%) |
Commute Time in Whitehouse
The most frequently occuring commute durations in Whitehouse are 20 to 24 minutes (1,021 commuters, 24.3%), 30 to 34 minutes (873 commuters, 20.8%), and 15 to 19 minutes (527 commuters, 12.6%).
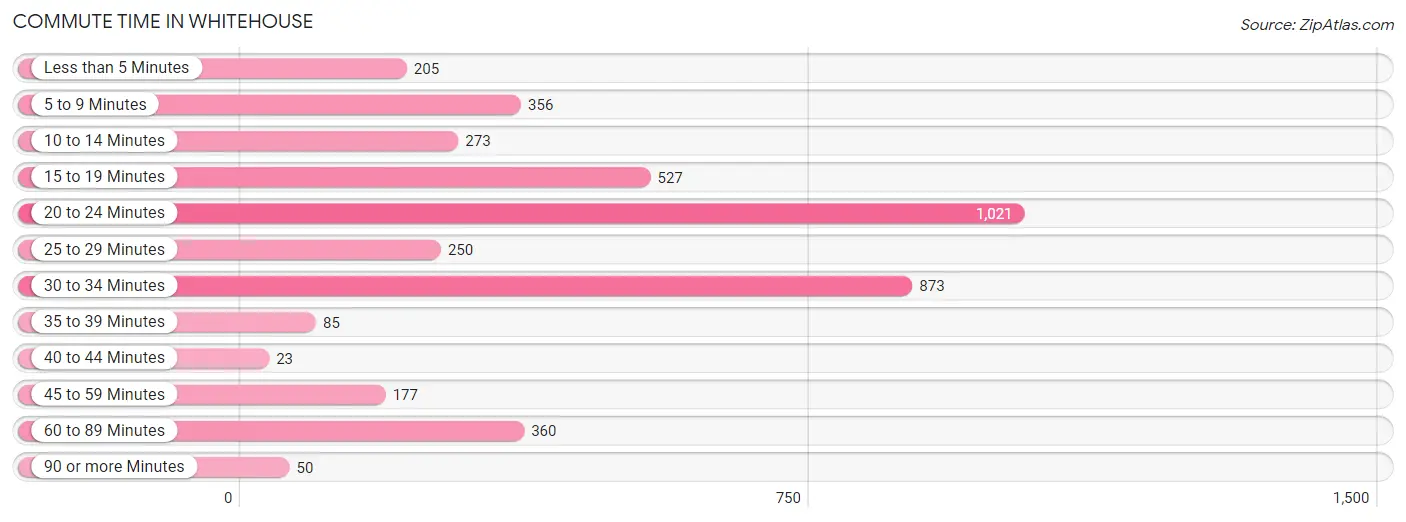
| Commute Time | # Commuters | % Commuters |
| Less than 5 Minutes | 205 | 4.9% |
| 5 to 9 Minutes | 356 | 8.5% |
| 10 to 14 Minutes | 273 | 6.5% |
| 15 to 19 Minutes | 527 | 12.6% |
| 20 to 24 Minutes | 1,021 | 24.3% |
| 25 to 29 Minutes | 250 | 5.9% |
| 30 to 34 Minutes | 873 | 20.8% |
| 35 to 39 Minutes | 85 | 2.0% |
| 40 to 44 Minutes | 23 | 0.5% |
| 45 to 59 Minutes | 177 | 4.2% |
| 60 to 89 Minutes | 360 | 8.6% |
| 90 or more Minutes | 50 | 1.2% |
Commute Time by Sex in Whitehouse
The most common commute times in Whitehouse are 30 to 34 minutes (576 commuters, 25.3%) for males and 20 to 24 minutes (460 commuters, 23.9%) for females.
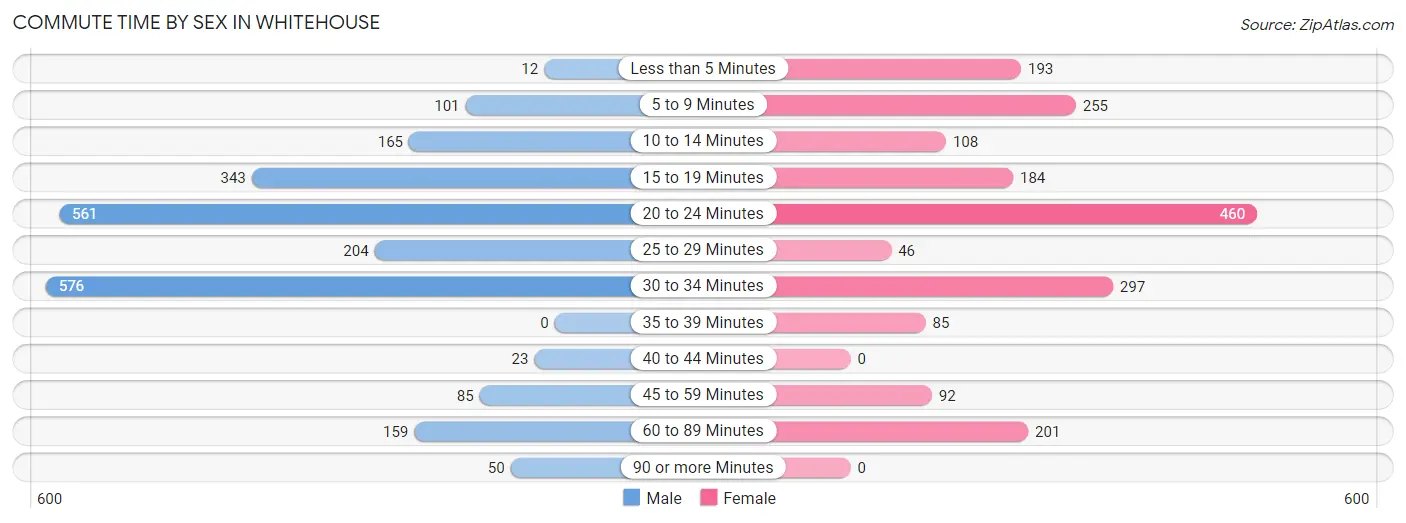
| Commute Time | Male | Female |
| Less than 5 Minutes | 12 (0.5%) | 193 (10.1%) |
| 5 to 9 Minutes | 101 (4.4%) | 255 (13.3%) |
| 10 to 14 Minutes | 165 (7.2%) | 108 (5.6%) |
| 15 to 19 Minutes | 343 (15.0%) | 184 (9.6%) |
| 20 to 24 Minutes | 561 (24.6%) | 460 (23.9%) |
| 25 to 29 Minutes | 204 (8.9%) | 46 (2.4%) |
| 30 to 34 Minutes | 576 (25.3%) | 297 (15.5%) |
| 35 to 39 Minutes | 0 (0.0%) | 85 (4.4%) |
| 40 to 44 Minutes | 23 (1.0%) | 0 (0.0%) |
| 45 to 59 Minutes | 85 (3.7%) | 92 (4.8%) |
| 60 to 89 Minutes | 159 (7.0%) | 201 (10.5%) |
| 90 or more Minutes | 50 (2.2%) | 0 (0.0%) |
Time of Departure to Work by Sex in Whitehouse
The most frequent times of departure to work in Whitehouse are 7:30 AM to 7:59 AM (316, 13.9%) for males and 6:00 AM to 6:29 AM (516, 26.9%) for females.
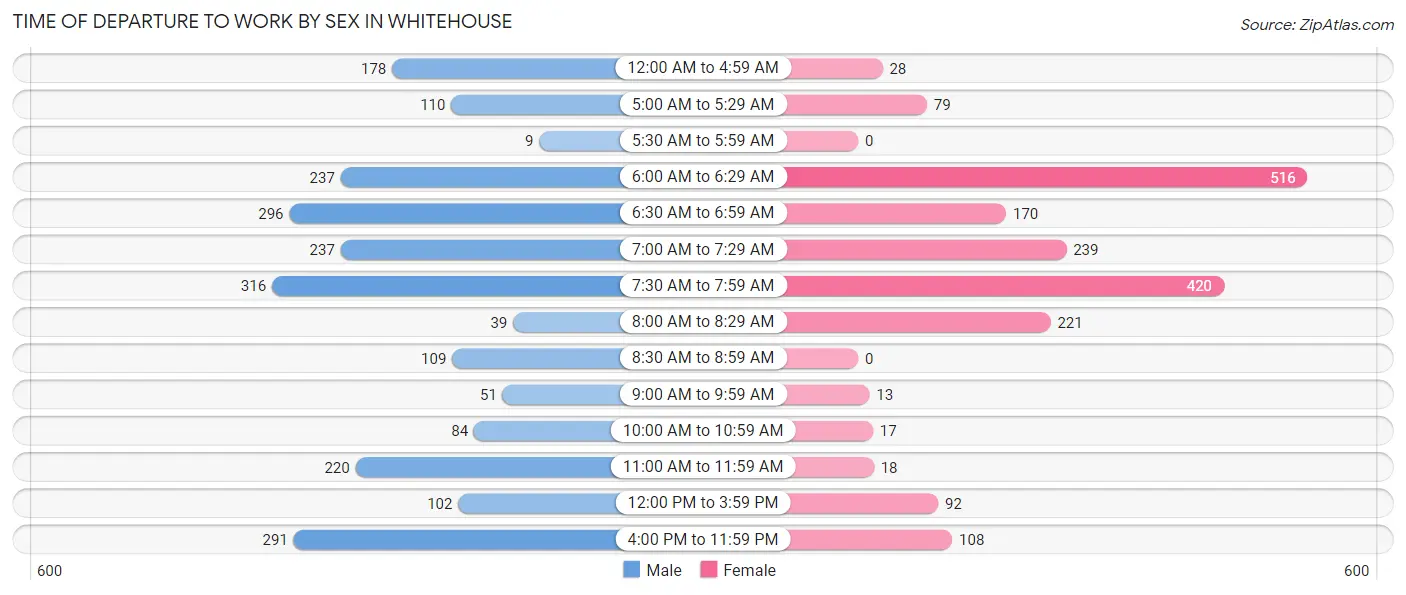
| Time of Departure | Male | Female |
| 12:00 AM to 4:59 AM | 178 (7.8%) | 28 (1.5%) |
| 5:00 AM to 5:29 AM | 110 (4.8%) | 79 (4.1%) |
| 5:30 AM to 5:59 AM | 9 (0.4%) | 0 (0.0%) |
| 6:00 AM to 6:29 AM | 237 (10.4%) | 516 (26.9%) |
| 6:30 AM to 6:59 AM | 296 (13.0%) | 170 (8.8%) |
| 7:00 AM to 7:29 AM | 237 (10.4%) | 239 (12.4%) |
| 7:30 AM to 7:59 AM | 316 (13.9%) | 420 (21.9%) |
| 8:00 AM to 8:29 AM | 39 (1.7%) | 221 (11.5%) |
| 8:30 AM to 8:59 AM | 109 (4.8%) | 0 (0.0%) |
| 9:00 AM to 9:59 AM | 51 (2.2%) | 13 (0.7%) |
| 10:00 AM to 10:59 AM | 84 (3.7%) | 17 (0.9%) |
| 11:00 AM to 11:59 AM | 220 (9.7%) | 18 (0.9%) |
| 12:00 PM to 3:59 PM | 102 (4.5%) | 92 (4.8%) |
| 4:00 PM to 11:59 PM | 291 (12.8%) | 108 (5.6%) |
| Total | 2,279 (100.0%) | 1,921 (100.0%) |
Housing Occupancy in Whitehouse
Occupancy by Ownership in Whitehouse
Of the total 2,980 dwellings in Whitehouse, owner-occupied units account for 2,115 (71.0%), while renter-occupied units make up 865 (29.0%).
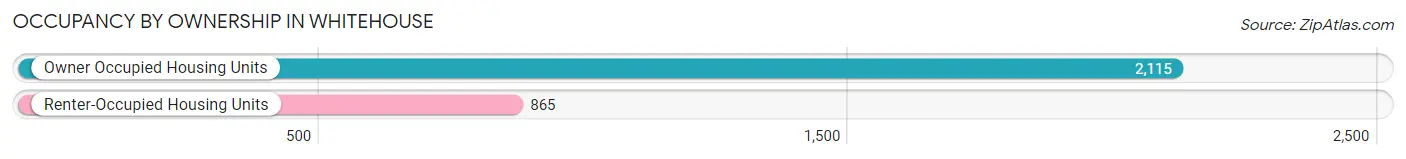
| Occupancy | # Housing Units | % Housing Units |
| Owner Occupied Housing Units | 2,115 | 71.0% |
| Renter-Occupied Housing Units | 865 | 29.0% |
| Total Occupied Housing Units | 2,980 | 100.0% |
Occupancy by Household Size in Whitehouse
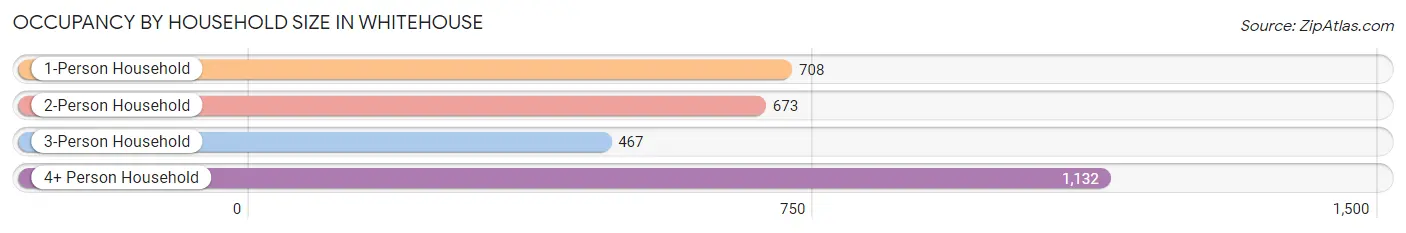
| Household Size | # Housing Units | % Housing Units |
| 1-Person Household | 708 | 23.8% |
| 2-Person Household | 673 | 22.6% |
| 3-Person Household | 467 | 15.7% |
| 4+ Person Household | 1,132 | 38.0% |
| Total Housing Units | 2,980 | 100.0% |
Occupancy by Ownership by Household Size in Whitehouse
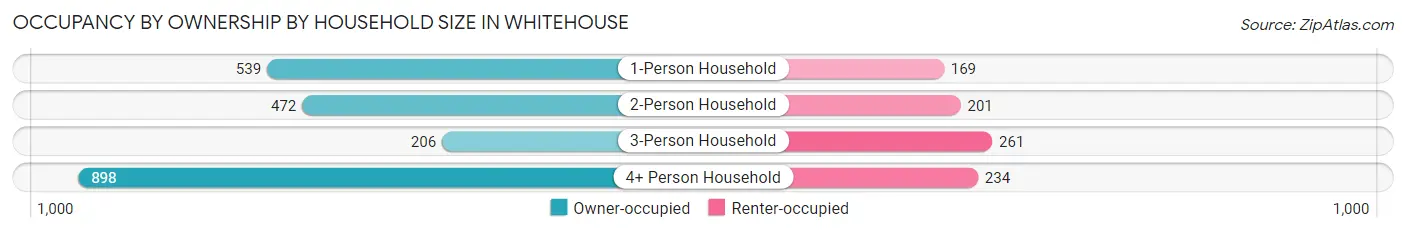
| Household Size | Owner-occupied | Renter-occupied |
| 1-Person Household | 539 (76.1%) | 169 (23.9%) |
| 2-Person Household | 472 (70.1%) | 201 (29.9%) |
| 3-Person Household | 206 (44.1%) | 261 (55.9%) |
| 4+ Person Household | 898 (79.3%) | 234 (20.7%) |
| Total Housing Units | 2,115 (71.0%) | 865 (29.0%) |
Occupancy by Educational Attainment in Whitehouse
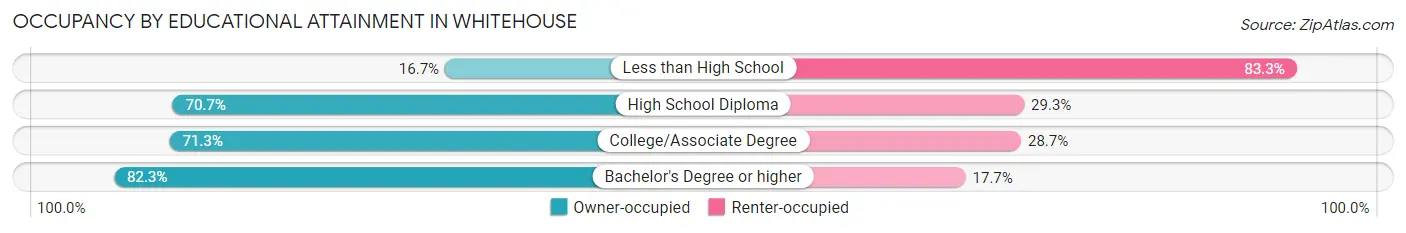
| Household Size | Owner-occupied | Renter-occupied |
| Less than High School | 32 (16.7%) | 160 (83.3%) |
| High School Diploma | 448 (70.7%) | 186 (29.3%) |
| College/Associate Degree | 888 (71.3%) | 358 (28.7%) |
| Bachelor's Degree or higher | 747 (82.3%) | 161 (17.7%) |
Occupancy by Age of Householder in Whitehouse
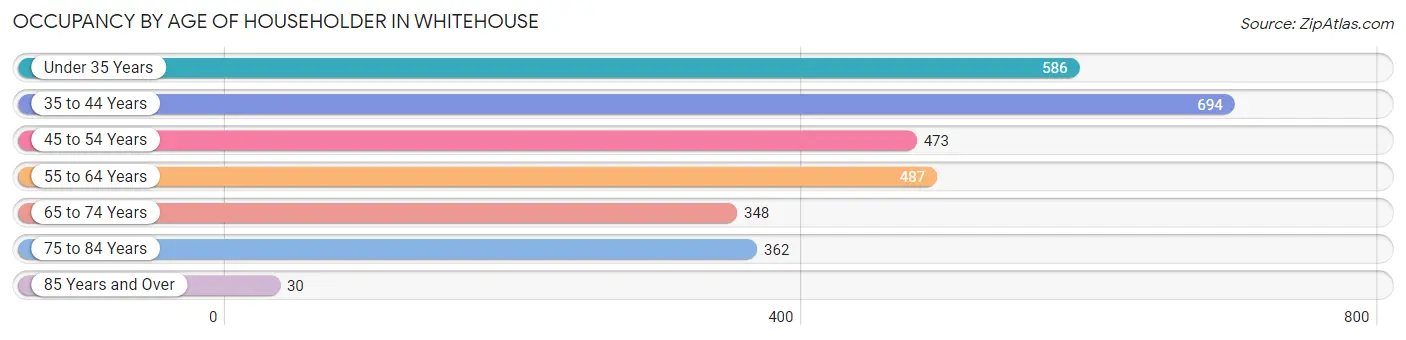
| Age Bracket | # Households | % Households |
| Under 35 Years | 586 | 19.7% |
| 35 to 44 Years | 694 | 23.3% |
| 45 to 54 Years | 473 | 15.9% |
| 55 to 64 Years | 487 | 16.3% |
| 65 to 74 Years | 348 | 11.7% |
| 75 to 84 Years | 362 | 12.1% |
| 85 Years and Over | 30 | 1.0% |
| Total | 2,980 | 100.0% |
Housing Finances in Whitehouse
Median Income by Occupancy in Whitehouse
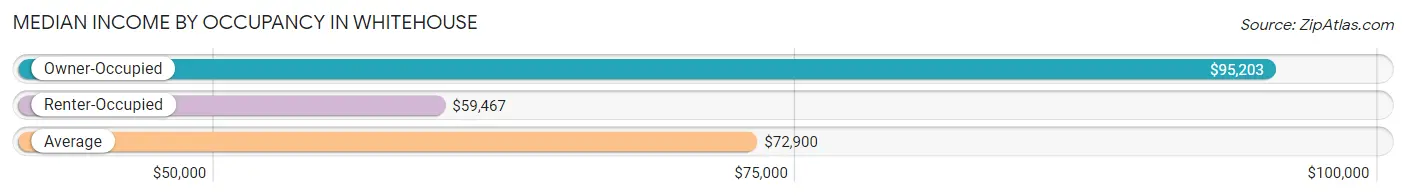
| Occupancy Type | # Households | Median Income |
| Owner-Occupied | 2,115 (71.0%) | $95,203 |
| Renter-Occupied | 865 (29.0%) | $59,467 |
| Average | 2,980 (100.0%) | $72,900 |
Occupancy by Householder Income Bracket in Whitehouse
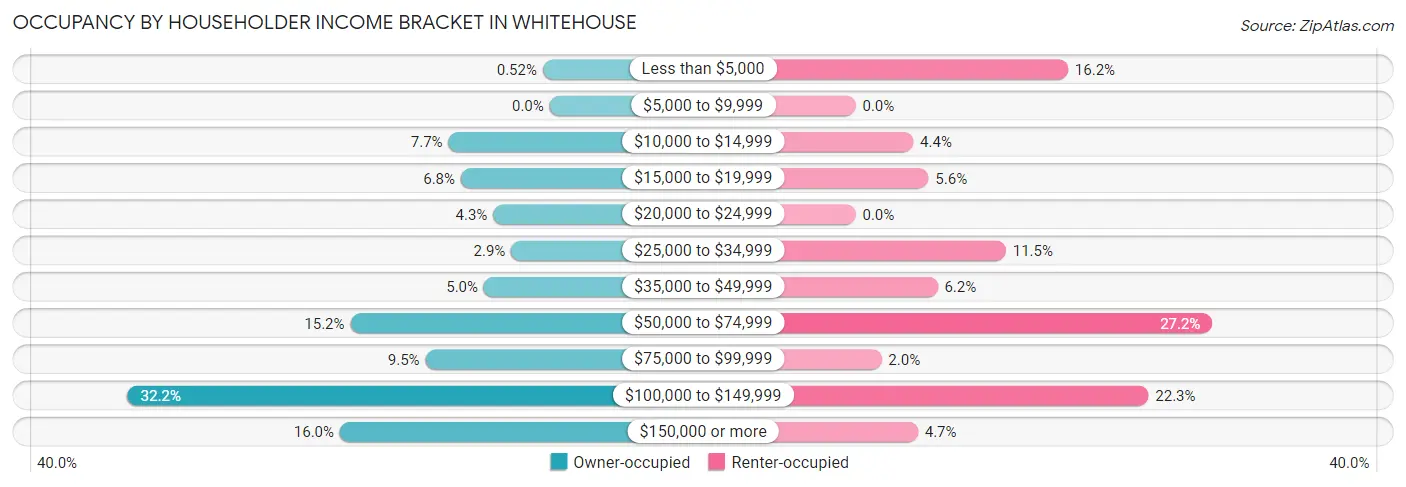
| Income Bracket | Owner-occupied | Renter-occupied |
| Less than $5,000 | 11 (0.5%) | 140 (16.2%) |
| $5,000 to $9,999 | 0 (0.0%) | 0 (0.0%) |
| $10,000 to $14,999 | 163 (7.7%) | 38 (4.4%) |
| $15,000 to $19,999 | 143 (6.8%) | 48 (5.6%) |
| $20,000 to $24,999 | 91 (4.3%) | 0 (0.0%) |
| $25,000 to $34,999 | 62 (2.9%) | 99 (11.5%) |
| $35,000 to $49,999 | 106 (5.0%) | 54 (6.2%) |
| $50,000 to $74,999 | 321 (15.2%) | 235 (27.2%) |
| $75,000 to $99,999 | 200 (9.5%) | 17 (2.0%) |
| $100,000 to $149,999 | 680 (32.2%) | 193 (22.3%) |
| $150,000 or more | 338 (16.0%) | 41 (4.7%) |
| Total | 2,115 (100.0%) | 865 (100.0%) |
Monthly Housing Cost Tiers in Whitehouse
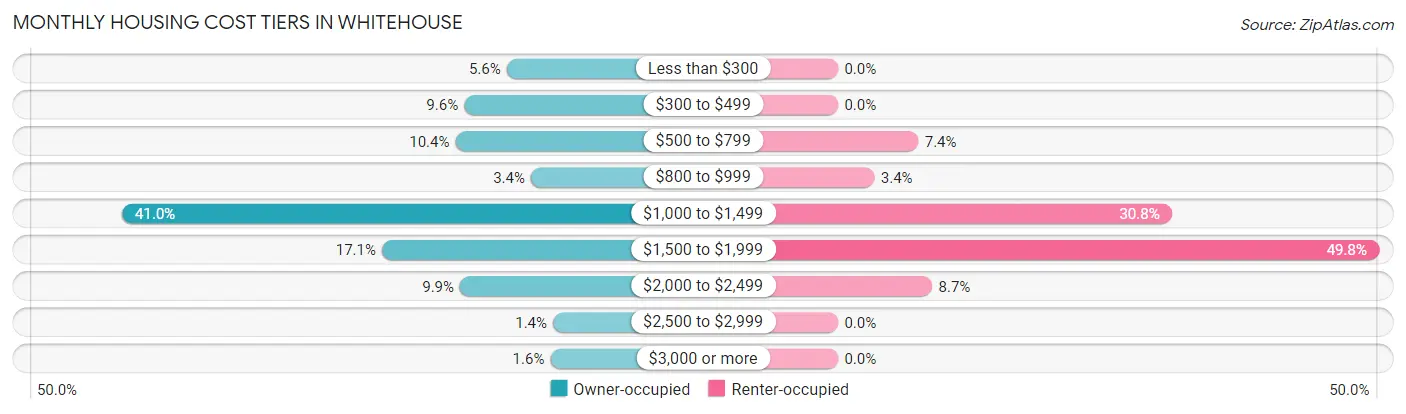
| Monthly Cost | Owner-occupied | Renter-occupied |
| Less than $300 | 119 (5.6%) | 0 (0.0%) |
| $300 to $499 | 202 (9.6%) | 0 (0.0%) |
| $500 to $799 | 219 (10.3%) | 64 (7.4%) |
| $800 to $999 | 72 (3.4%) | 29 (3.4%) |
| $1,000 to $1,499 | 868 (41.0%) | 266 (30.7%) |
| $1,500 to $1,999 | 362 (17.1%) | 431 (49.8%) |
| $2,000 to $2,499 | 210 (9.9%) | 75 (8.7%) |
| $2,500 to $2,999 | 29 (1.4%) | 0 (0.0%) |
| $3,000 or more | 34 (1.6%) | 0 (0.0%) |
| Total | 2,115 (100.0%) | 865 (100.0%) |
Physical Housing Characteristics in Whitehouse
Housing Structures in Whitehouse
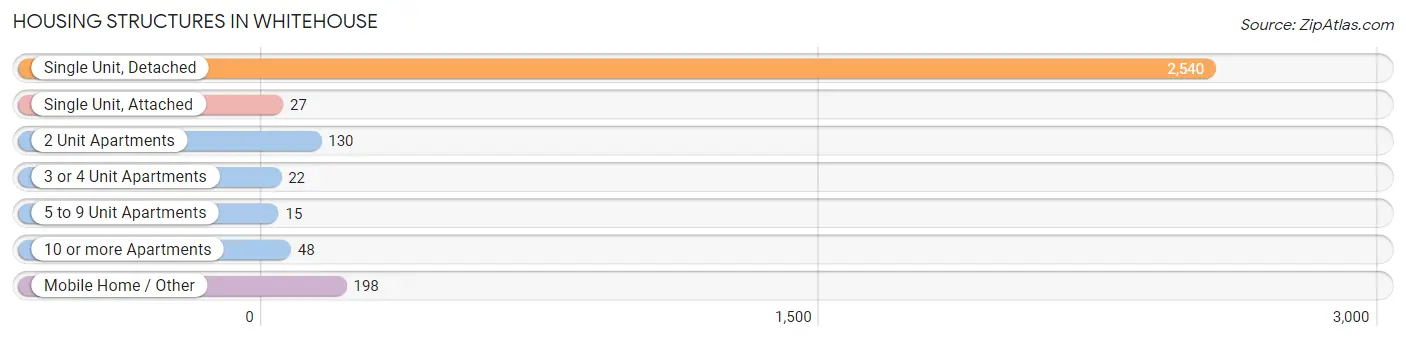
| Structure Type | # Housing Units | % Housing Units |
| Single Unit, Detached | 2,540 | 85.2% |
| Single Unit, Attached | 27 | 0.9% |
| 2 Unit Apartments | 130 | 4.4% |
| 3 or 4 Unit Apartments | 22 | 0.7% |
| 5 to 9 Unit Apartments | 15 | 0.5% |
| 10 or more Apartments | 48 | 1.6% |
| Mobile Home / Other | 198 | 6.6% |
| Total | 2,980 | 100.0% |
Housing Structures by Occupancy in Whitehouse
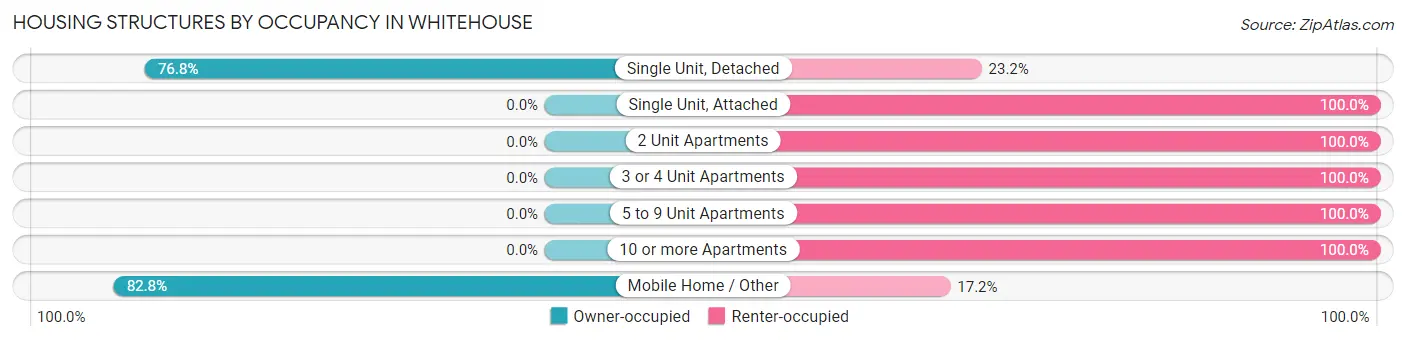
| Structure Type | Owner-occupied | Renter-occupied |
| Single Unit, Detached | 1,951 (76.8%) | 589 (23.2%) |
| Single Unit, Attached | 0 (0.0%) | 27 (100.0%) |
| 2 Unit Apartments | 0 (0.0%) | 130 (100.0%) |
| 3 or 4 Unit Apartments | 0 (0.0%) | 22 (100.0%) |
| 5 to 9 Unit Apartments | 0 (0.0%) | 15 (100.0%) |
| 10 or more Apartments | 0 (0.0%) | 48 (100.0%) |
| Mobile Home / Other | 164 (82.8%) | 34 (17.2%) |
| Total | 2,115 (71.0%) | 865 (29.0%) |
Housing Structures by Number of Rooms in Whitehouse
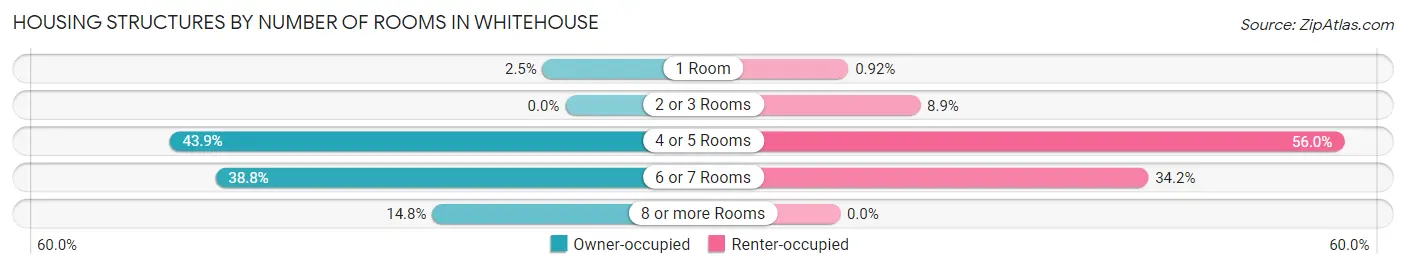
| Number of Rooms | Owner-occupied | Renter-occupied |
| 1 Room | 53 (2.5%) | 8 (0.9%) |
| 2 or 3 Rooms | 0 (0.0%) | 77 (8.9%) |
| 4 or 5 Rooms | 929 (43.9%) | 484 (55.9%) |
| 6 or 7 Rooms | 821 (38.8%) | 296 (34.2%) |
| 8 or more Rooms | 312 (14.7%) | 0 (0.0%) |
| Total | 2,115 (100.0%) | 865 (100.0%) |
Housing Structure by Heating Type in Whitehouse
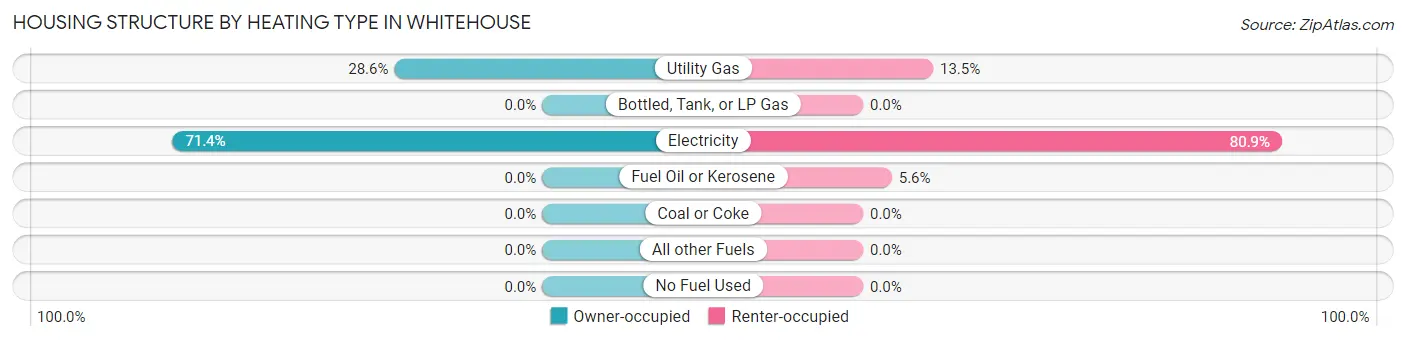
| Heating Type | Owner-occupied | Renter-occupied |
| Utility Gas | 604 (28.6%) | 117 (13.5%) |
| Bottled, Tank, or LP Gas | 0 (0.0%) | 0 (0.0%) |
| Electricity | 1,511 (71.4%) | 700 (80.9%) |
| Fuel Oil or Kerosene | 0 (0.0%) | 48 (5.6%) |
| Coal or Coke | 0 (0.0%) | 0 (0.0%) |
| All other Fuels | 0 (0.0%) | 0 (0.0%) |
| No Fuel Used | 0 (0.0%) | 0 (0.0%) |
| Total | 2,115 (100.0%) | 865 (100.0%) |
Household Vehicle Usage in Whitehouse
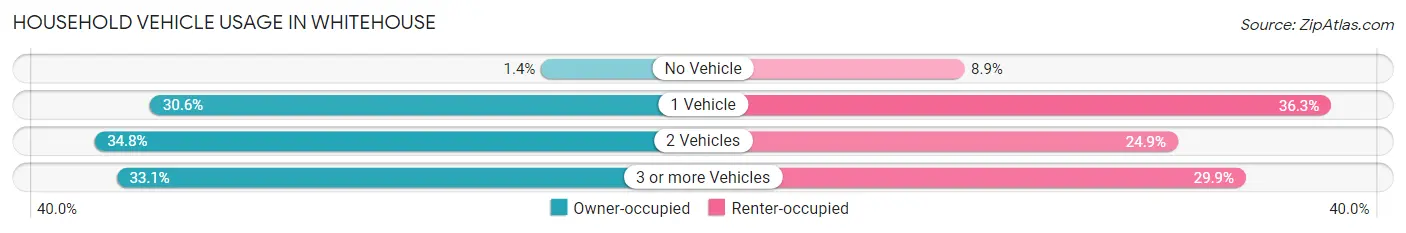
| Vehicles per Household | Owner-occupied | Renter-occupied |
| No Vehicle | 30 (1.4%) | 77 (8.9%) |
| 1 Vehicle | 648 (30.6%) | 314 (36.3%) |
| 2 Vehicles | 736 (34.8%) | 215 (24.9%) |
| 3 or more Vehicles | 701 (33.1%) | 259 (29.9%) |
| Total | 2,115 (100.0%) | 865 (100.0%) |
Real Estate & Mortgages in Whitehouse
Real Estate and Mortgage Overview in Whitehouse
| Characteristic | Without Mortgage | With Mortgage |
| Housing Units | 733 | 1,382 |
| Median Property Value | $178,100 | $196,600 |
| Median Household Income | $46,118 | $338 |
| Monthly Housing Costs | $616 | $34 |
| Real Estate Taxes | $2,687 | $80 |
Property Value by Mortgage Status in Whitehouse
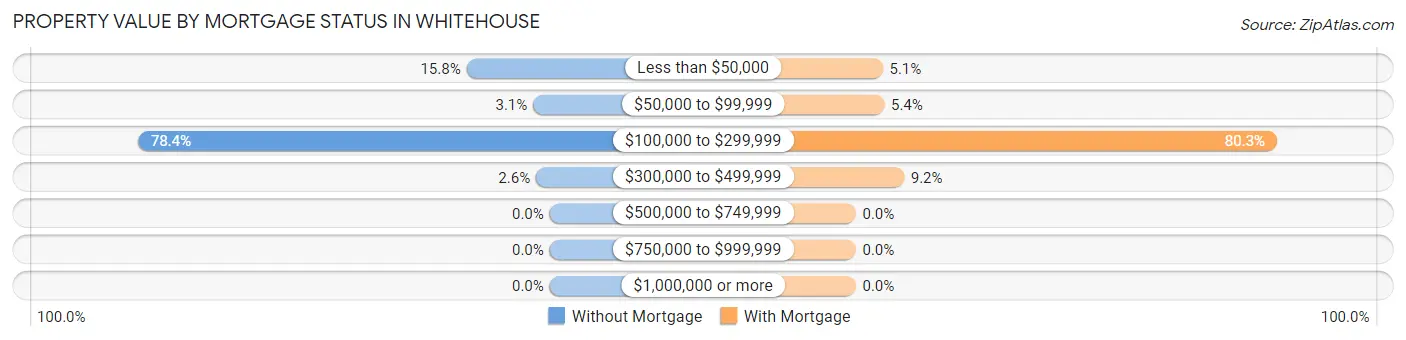
| Property Value | Without Mortgage | With Mortgage |
| Less than $50,000 | 116 (15.8%) | 71 (5.1%) |
| $50,000 to $99,999 | 23 (3.1%) | 75 (5.4%) |
| $100,000 to $299,999 | 575 (78.4%) | 1,109 (80.2%) |
| $300,000 to $499,999 | 19 (2.6%) | 127 (9.2%) |
| $500,000 to $749,999 | 0 (0.0%) | 0 (0.0%) |
| $750,000 to $999,999 | 0 (0.0%) | 0 (0.0%) |
| $1,000,000 or more | 0 (0.0%) | 0 (0.0%) |
| Total | 733 (100.0%) | 1,382 (100.0%) |
Household Income by Mortgage Status in Whitehouse
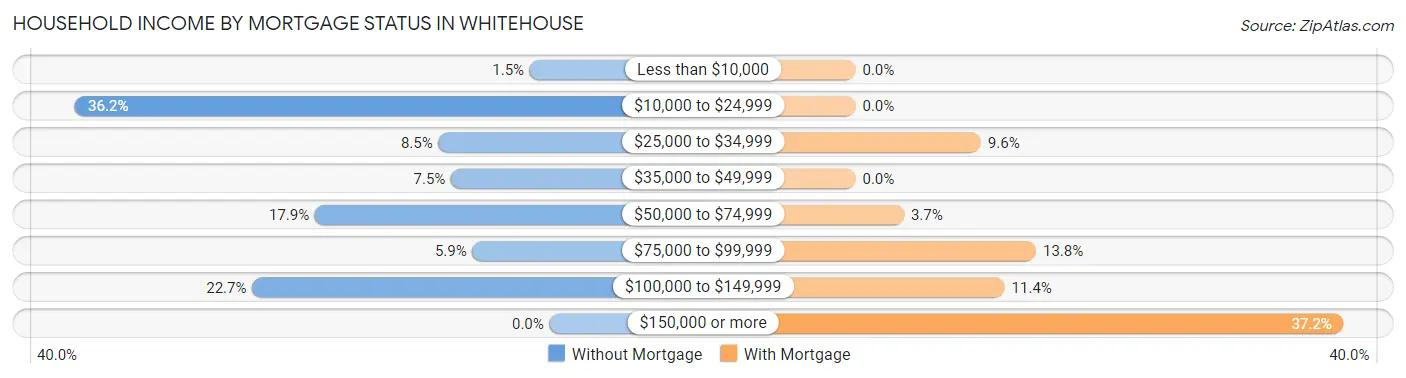
| Household Income | Without Mortgage | With Mortgage |
| Less than $10,000 | 11 (1.5%) | 0 (0.0%) |
| $10,000 to $24,999 | 265 (36.1%) | 0 (0.0%) |
| $25,000 to $34,999 | 62 (8.5%) | 132 (9.6%) |
| $35,000 to $49,999 | 55 (7.5%) | 0 (0.0%) |
| $50,000 to $74,999 | 131 (17.9%) | 51 (3.7%) |
| $75,000 to $99,999 | 43 (5.9%) | 190 (13.8%) |
| $100,000 to $149,999 | 166 (22.7%) | 157 (11.4%) |
| $150,000 or more | 0 (0.0%) | 514 (37.2%) |
| Total | 733 (100.0%) | 1,382 (100.0%) |
Property Value to Household Income Ratio in Whitehouse
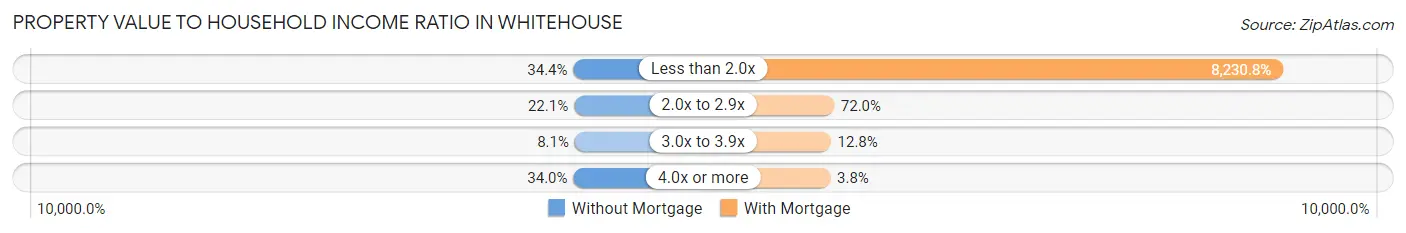
| Value-to-Income Ratio | Without Mortgage | With Mortgage |
| Less than 2.0x | 252 (34.4%) | 113,750 (8,230.8%) |
| 2.0x to 2.9x | 162 (22.1%) | 995 (72.0%) |
| 3.0x to 3.9x | 59 (8.1%) | 177 (12.8%) |
| 4.0x or more | 249 (34.0%) | 52 (3.8%) |
| Total | 733 (100.0%) | 1,382 (100.0%) |
Real Estate Taxes by Mortgage Status in Whitehouse
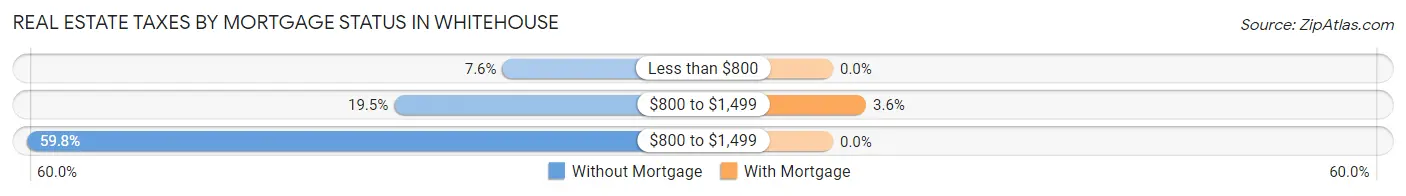
| Property Taxes | Without Mortgage | With Mortgage |
| Less than $800 | 56 (7.6%) | 0 (0.0%) |
| $800 to $1,499 | 143 (19.5%) | 50 (3.6%) |
| $800 to $1,499 | 438 (59.8%) | 0 (0.0%) |
| Total | 733 (100.0%) | 1,382 (100.0%) |
Health & Disability in Whitehouse
Health Insurance Coverage by Age in Whitehouse
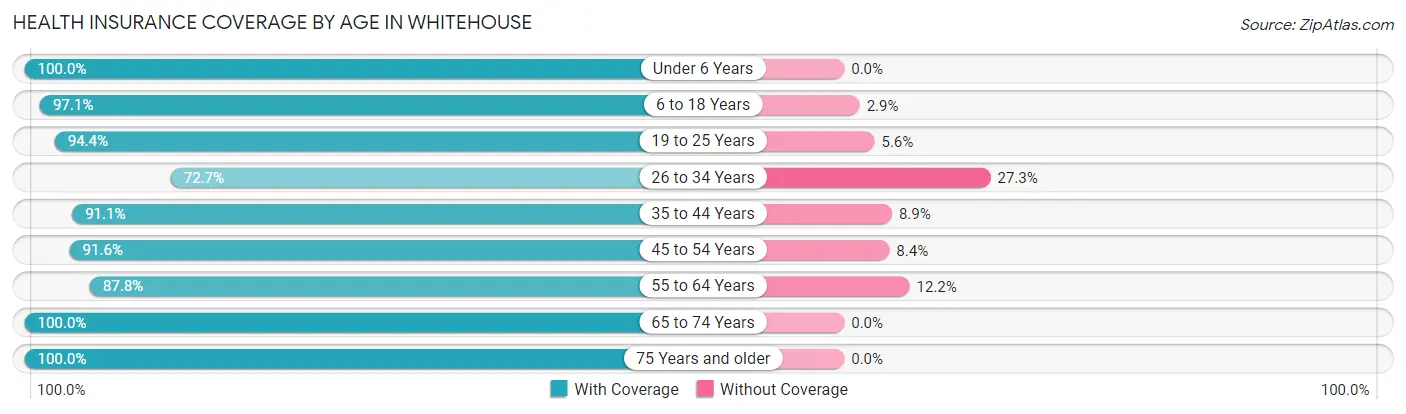
| Age Bracket | With Coverage | Without Coverage |
| Under 6 Years | 549 (100.0%) | 0 (0.0%) |
| 6 to 18 Years | 1,687 (97.1%) | 50 (2.9%) |
| 19 to 25 Years | 636 (94.4%) | 38 (5.6%) |
| 26 to 34 Years | 917 (72.7%) | 344 (27.3%) |
| 35 to 44 Years | 1,096 (91.1%) | 107 (8.9%) |
| 45 to 54 Years | 904 (91.6%) | 83 (8.4%) |
| 55 to 64 Years | 865 (87.8%) | 120 (12.2%) |
| 65 to 74 Years | 522 (100.0%) | 0 (0.0%) |
| 75 Years and older | 547 (100.0%) | 0 (0.0%) |
| Total | 7,723 (91.2%) | 742 (8.8%) |
Health Insurance Coverage by Citizenship Status in Whitehouse
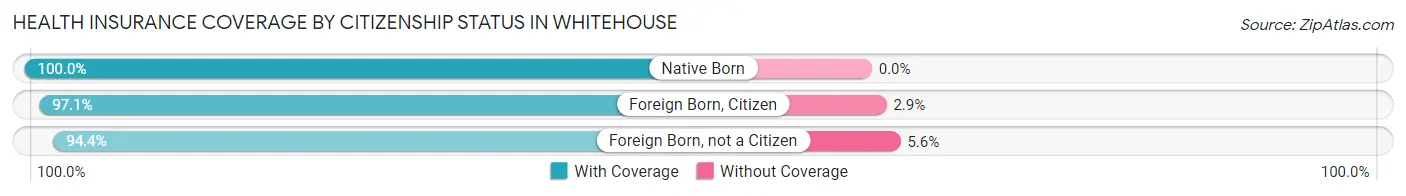
| Citizenship Status | With Coverage | Without Coverage |
| Native Born | 549 (100.0%) | 0 (0.0%) |
| Foreign Born, Citizen | 1,687 (97.1%) | 50 (2.9%) |
| Foreign Born, not a Citizen | 636 (94.4%) | 38 (5.6%) |
Health Insurance Coverage by Household Income in Whitehouse
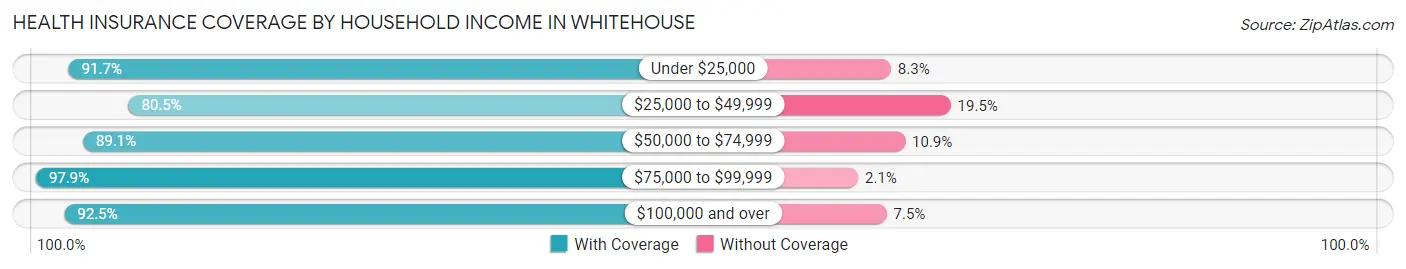
| Household Income | With Coverage | Without Coverage |
| Under $25,000 | 988 (91.7%) | 89 (8.3%) |
| $25,000 to $49,999 | 563 (80.5%) | 136 (19.5%) |
| $50,000 to $74,999 | 1,444 (89.1%) | 177 (10.9%) |
| $75,000 to $99,999 | 694 (97.9%) | 15 (2.1%) |
| $100,000 and over | 4,033 (92.5%) | 325 (7.5%) |
Public vs Private Health Insurance Coverage by Age in Whitehouse
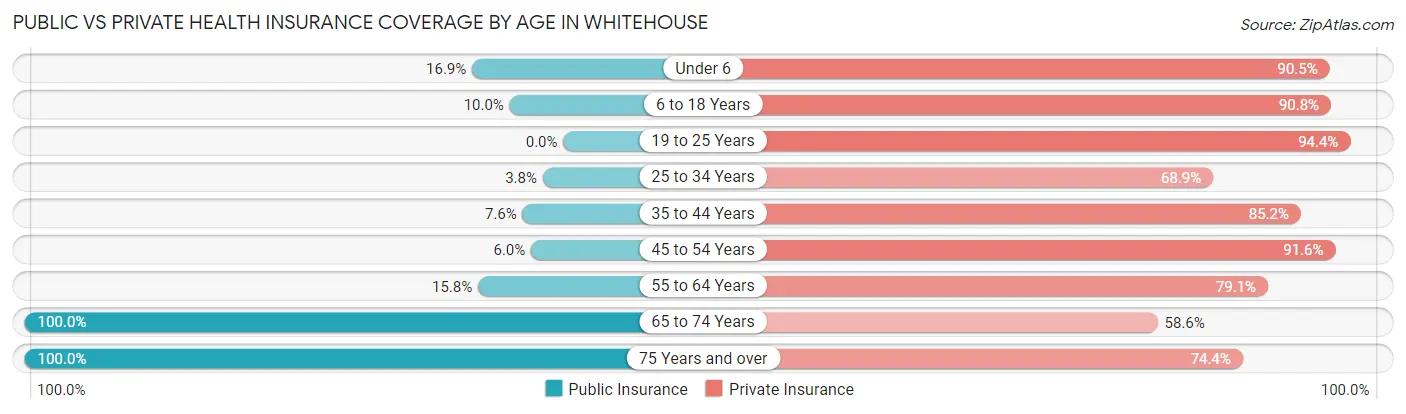
| Age Bracket | Public Insurance | Private Insurance |
| Under 6 | 93 (16.9%) | 497 (90.5%) |
| 6 to 18 Years | 173 (10.0%) | 1,577 (90.8%) |
| 19 to 25 Years | 0 (0.0%) | 636 (94.4%) |
| 25 to 34 Years | 48 (3.8%) | 869 (68.9%) |
| 35 to 44 Years | 91 (7.6%) | 1,025 (85.2%) |
| 45 to 54 Years | 59 (6.0%) | 904 (91.6%) |
| 55 to 64 Years | 156 (15.8%) | 779 (79.1%) |
| 65 to 74 Years | 522 (100.0%) | 306 (58.6%) |
| 75 Years and over | 547 (100.0%) | 407 (74.4%) |
| Total | 1,689 (20.0%) | 7,000 (82.7%) |
Disability Status by Sex by Age in Whitehouse
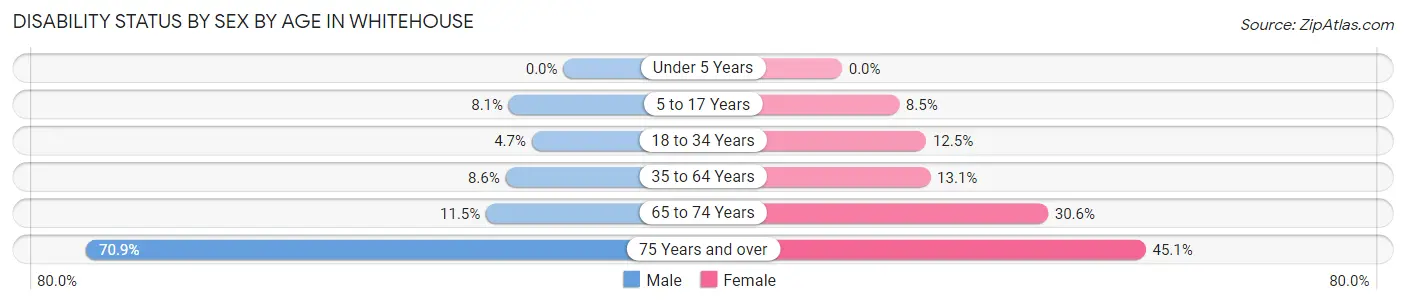
| Age Bracket | Male | Female |
| Under 5 Years | 0 (0.0%) | 0 (0.0%) |
| 5 to 17 Years | 76 (8.1%) | 64 (8.5%) |
| 18 to 34 Years | 54 (4.7%) | 109 (12.5%) |
| 35 to 64 Years | 141 (8.6%) | 201 (13.1%) |
| 65 to 74 Years | 25 (11.5%) | 93 (30.6%) |
| 75 Years and over | 163 (70.9%) | 143 (45.1%) |
Disability Class by Sex by Age in Whitehouse
Disability Class: Hearing Difficulty
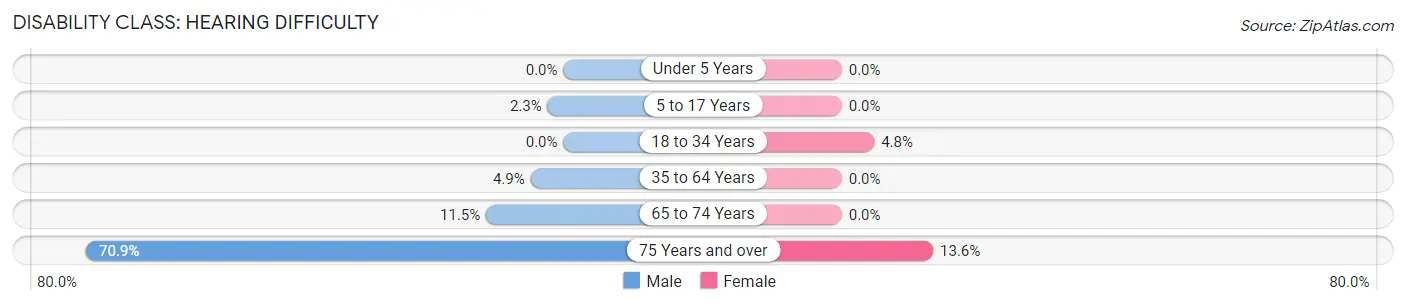
| Age Bracket | Male | Female |
| Under 5 Years | 0 (0.0%) | 0 (0.0%) |
| 5 to 17 Years | 22 (2.3%) | 0 (0.0%) |
| 18 to 34 Years | 0 (0.0%) | 42 (4.8%) |
| 35 to 64 Years | 80 (4.9%) | 0 (0.0%) |
| 65 to 74 Years | 25 (11.5%) | 0 (0.0%) |
| 75 Years and over | 163 (70.9%) | 43 (13.6%) |
Disability Class: Vision Difficulty
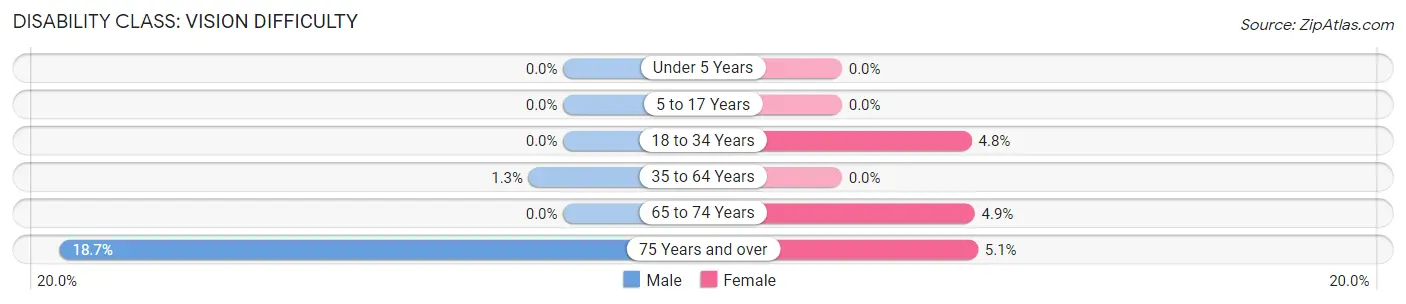
| Age Bracket | Male | Female |
| Under 5 Years | 0 (0.0%) | 0 (0.0%) |
| 5 to 17 Years | 0 (0.0%) | 0 (0.0%) |
| 18 to 34 Years | 0 (0.0%) | 42 (4.8%) |
| 35 to 64 Years | 21 (1.3%) | 0 (0.0%) |
| 65 to 74 Years | 0 (0.0%) | 15 (4.9%) |
| 75 Years and over | 43 (18.7%) | 16 (5.1%) |
Disability Class: Cognitive Difficulty
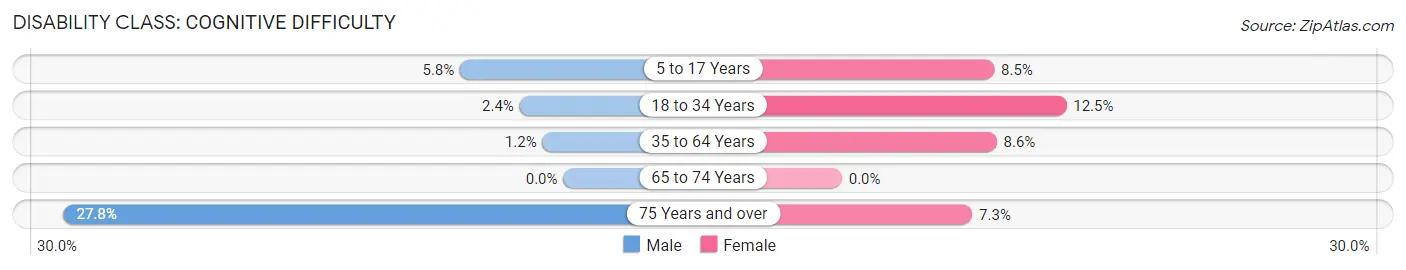
| Age Bracket | Male | Female |
| 5 to 17 Years | 54 (5.8%) | 64 (8.5%) |
| 18 to 34 Years | 28 (2.4%) | 109 (12.5%) |
| 35 to 64 Years | 19 (1.2%) | 132 (8.6%) |
| 65 to 74 Years | 0 (0.0%) | 0 (0.0%) |
| 75 Years and over | 64 (27.8%) | 23 (7.3%) |
Disability Class: Ambulatory Difficulty
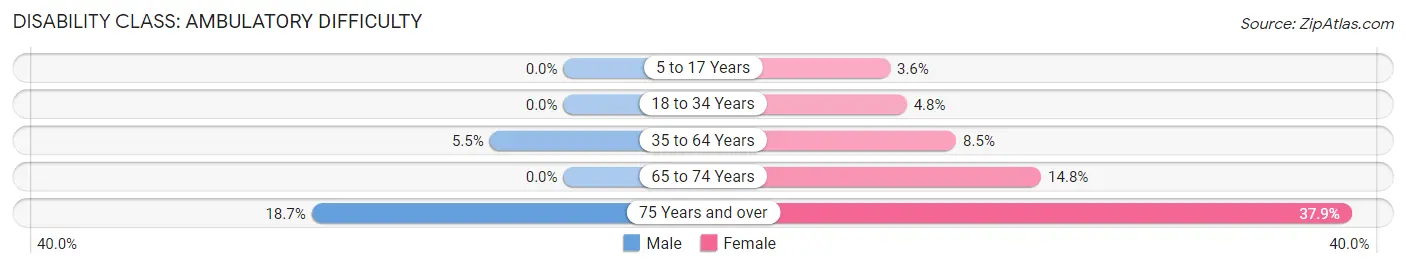
| Age Bracket | Male | Female |
| 5 to 17 Years | 0 (0.0%) | 27 (3.6%) |
| 18 to 34 Years | 0 (0.0%) | 42 (4.8%) |
| 35 to 64 Years | 90 (5.5%) | 130 (8.5%) |
| 65 to 74 Years | 0 (0.0%) | 45 (14.8%) |
| 75 Years and over | 43 (18.7%) | 120 (37.9%) |
Disability Class: Self-Care Difficulty
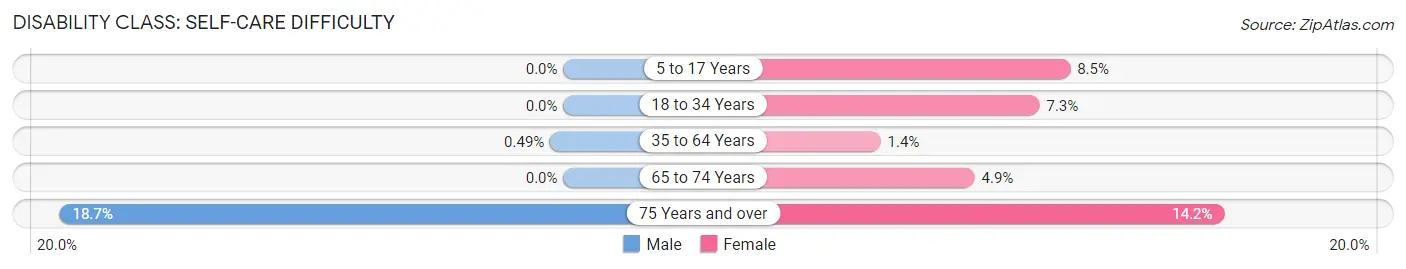
| Age Bracket | Male | Female |
| 5 to 17 Years | 0 (0.0%) | 64 (8.5%) |
| 18 to 34 Years | 0 (0.0%) | 64 (7.3%) |
| 35 to 64 Years | 8 (0.5%) | 22 (1.4%) |
| 65 to 74 Years | 0 (0.0%) | 15 (4.9%) |
| 75 Years and over | 43 (18.7%) | 45 (14.2%) |
Technology Access in Whitehouse
Computing Device Access in Whitehouse
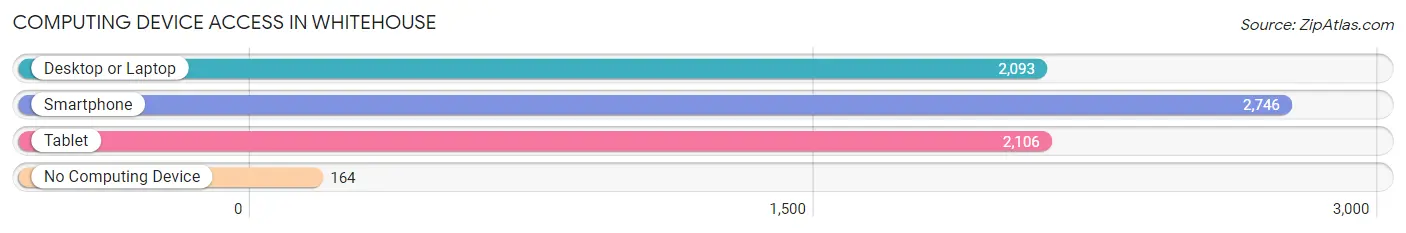
| Device Type | # Households | % Households |
| Desktop or Laptop | 2,093 | 70.2% |
| Smartphone | 2,746 | 92.1% |
| Tablet | 2,106 | 70.7% |
| No Computing Device | 164 | 5.5% |
| Total | 2,980 | 100.0% |
Internet Access in Whitehouse
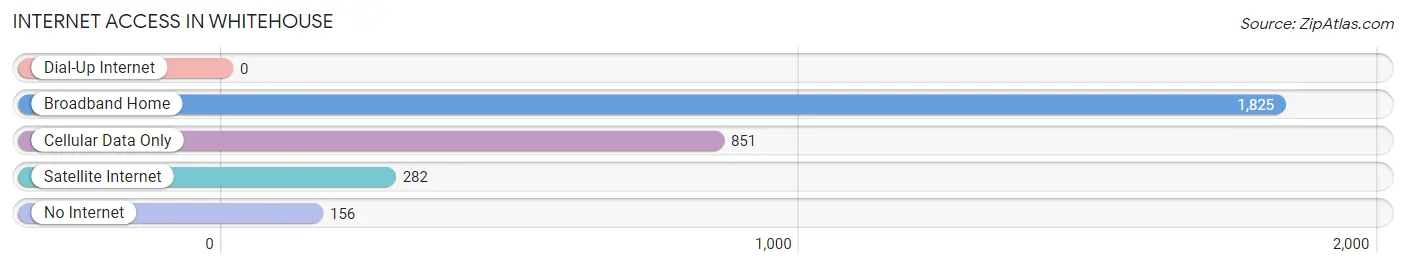
| Internet Type | # Households | % Households |
| Dial-Up Internet | 0 | 0.0% |
| Broadband Home | 1,825 | 61.2% |
| Cellular Data Only | 851 | 28.6% |
| Satellite Internet | 282 | 9.5% |
| No Internet | 156 | 5.2% |
| Total | 2,980 | 100.0% |
Whitehouse Summary
Whitehouse is a city located in Smith County, Texas, United States. The population was 7,660 at the 2010 census. It is part of the Tyler metropolitan statistical area.
History
Whitehouse was founded in 1872 by a group of settlers from Whitehouse, Tennessee. The town was named after the white house that was built by the settlers. The first post office was established in 1873. The town was incorporated in 1875 and the first mayor was elected in 1876.
The town grew slowly until the early 1900s when the railroad came through. This brought new businesses and people to the area and the population began to grow. The town was also home to several cotton gins and sawmills.
In the 1950s, Whitehouse began to experience a population boom as people moved to the area from other parts of the country. This growth continued into the 1960s and 1970s.
Geography
Whitehouse is located at 32 14 25 North 95 20 45 West 32 240278 95 345833
According to the United States Census Bureau, the city has a total area of 5.2 square miles (13.4 km2), all of it land.
Economy
Whitehouse is home to several businesses, including a Walmart Supercenter, a Lowe's Home Improvement store, and several restaurants. The city is also home to several manufacturing companies, including a plastics manufacturer and a metal fabrication company.
The city is also home to several educational institutions, including Whitehouse High School, Whitehouse Junior High School, and Whitehouse Elementary School.
Demographics
As of the census of 2000, there were 6,845 people, 2,541 households, and 1,919 families residing in the city. The population density was 1,323.3 people per square mile (510.7/km2). There were 2,717 housing units at an average density of 522.3 per square mile (201.6/km2). The racial makeup of the city was 81.45% White, 14.45% African American, 0.37% Native American, 0.45% Asian, 0.02% Pacific Islander, 2.17% from other races, and 1.10% from two or more races. Hispanic or Latino of any race were 4.45% of the population.
There were 2,541 households, out of which 39.2% had children under the age of 18 living with them, 57.2% were married couples living together, 12.7% had a female householder with no husband present, and 25.7% were non-families. 22.2% of all households were made up of individuals, and 8.2% had someone living alone who was 65 years of age or older. The average household size was 2.68 and the average family size was 3.14.
In the city, the population was spread out, with 29.7% under the age of 18, 8.7% from 18 to 24, 30.2% from 25 to 44, 21.2% from 45 to 64, and 10.2% who were 65 years of age or older. The median age was 34 years. For every 100 females, there were 93.2 males. For every 100 females age 18 and over, there were 89.2 males.
The median income for a household in the city was $41,945, and the median income for a family was $48,945. Males had a median income of $35,945 versus $25,945 for females. The per capita income for the city was $19,945. About 8.2% of families and 10.2% of the population were below the poverty line, including 13.2% of those under age 18 and 8.2% of those age 65 or over.
Common Questions
What is Per Capita Income in Whitehouse?
Per Capita income in Whitehouse is $32,837.
What is the Median Family Income in Whitehouse?
Median Family Income in Whitehouse is $100,448.
What is the Median Household income in Whitehouse?
Median Household Income in Whitehouse is $72,900.
What is Income or Wage Gap in Whitehouse?
Income or Wage Gap in Whitehouse is 9.2%.
Women in Whitehouse earn 90.8 cents for every dollar earned by a man.
What is Inequality or Gini Index in Whitehouse?
Inequality or Gini Index in Whitehouse is 0.41.
What is the Total Population of Whitehouse?
Total Population of Whitehouse is 8,512.
What is the Total Male Population of Whitehouse?
Total Male Population of Whitehouse is 4,557.
What is the Total Female Population of Whitehouse?
Total Female Population of Whitehouse is 3,955.
What is the Ratio of Males per 100 Females in Whitehouse?
There are 115.22 Males per 100 Females in Whitehouse.
What is the Ratio of Females per 100 Males in Whitehouse?
There are 86.79 Females per 100 Males in Whitehouse.
What is the Median Population Age in Whitehouse?
Median Population Age in Whitehouse is 35.1 Years.
What is the Average Family Size in Whitehouse
Average Family Size in Whitehouse is 3.4 People.
What is the Average Household Size in Whitehouse
Average Household Size in Whitehouse is 2.9 People.
How Large is the Labor Force in Whitehouse?
There are 4,737 People in the Labor Forcein in Whitehouse.
What is the Percentage of People in the Labor Force in Whitehouse?
70.8% of People are in the Labor Force in Whitehouse.
What is the Unemployment Rate in Whitehouse?
Unemployment Rate in Whitehouse is 6.1%.