Zip Codes with the Highest Percentage of Households with Income Below $10,000 in Memphis, TN
RELATED REPORTS & OPTIONS
Household Income | $0-10k
Memphis
Compare Zip Codes
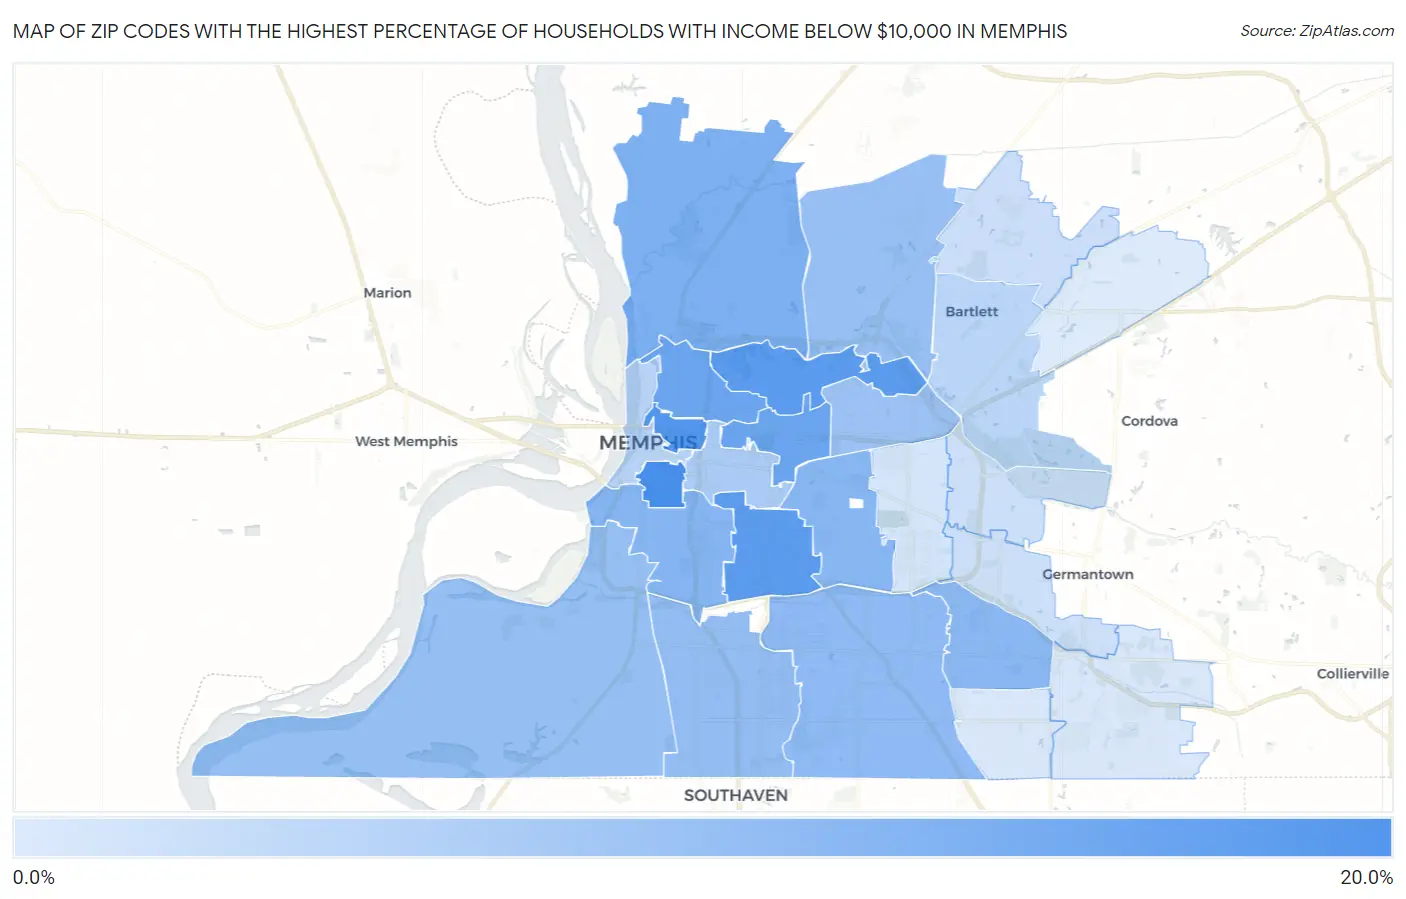
Map of Zip Codes with the Highest Percentage of Households with Income Below $10,000 in Memphis
1.5%
19.2%
Zip Codes with the Highest Percentage of Households with Income Below $10,000 in Memphis, TN
| Zip Code | Households with Income < $10k | vs State | vs National | |
| 1. | 38126 | 19.2% | 5.3%(+13.9)#13 | 4.9%(+14.3)#881 |
| 2. | 38105 | 17.8% | 5.3%(+12.5)#19 | 4.9%(+12.9)#1,046 |
| 3. | 38114 | 17.0% | 5.3%(+11.7)#21 | 4.9%(+12.1)#1,161 |
| 4. | 38108 | 16.6% | 5.3%(+11.3)#23 | 4.9%(+11.7)#1,230 |
| 5. | 38112 | 14.6% | 5.3%(+9.30)#31 | 4.9%(+9.70)#1,615 |
| 6. | 38107 | 14.5% | 5.3%(+9.20)#32 | 4.9%(+9.60)#1,644 |
| 7. | 38127 | 12.5% | 5.3%(+7.20)#44 | 4.9%(+7.60)#2,250 |
| 8. | 38106 | 11.4% | 5.3%(+6.10)#55 | 4.9%(+6.50)#2,725 |
| 9. | 38111 | 11.1% | 5.3%(+5.80)#59 | 4.9%(+6.20)#2,880 |
| 10. | 38115 | 11.0% | 5.3%(+5.70)#60 | 4.9%(+6.10)#2,945 |
| 11. | 38118 | 10.4% | 5.3%(+5.10)#70 | 4.9%(+5.50)#3,287 |
| 12. | 38116 | 9.9% | 5.3%(+4.60)#86 | 4.9%(+5.00)#3,640 |
| 13. | 38109 | 9.6% | 5.3%(+4.30)#93 | 4.9%(+4.70)#3,866 |
| 14. | 38128 | 9.2% | 5.3%(+3.90)#101 | 4.9%(+4.30)#4,197 |
| 15. | 38122 | 8.7% | 5.3%(+3.40)#115 | 4.9%(+3.80)#4,726 |
| 16. | 38104 | 7.3% | 5.3%(+2.00)#168 | 4.9%(+2.40)#6,494 |
| 17. | 38103 | 5.5% | 5.3%(+0.200)#244 | 4.9%(+0.600)#10,262 |
| 18. | 38134 | 5.3% | 5.3%(=0.000)#257 | 4.9%(+0.400)#10,725 |
| 19. | 38135 | 3.4% | 5.3%(-1.90)#389 | 4.9%(-1.50)#17,661 |
| 20. | 38119 | 3.2% | 5.3%(-2.10)#409 | 4.9%(-1.70)#18,546 |
| 21. | 38120 | 3.2% | 5.3%(-2.10)#411 | 4.9%(-1.70)#18,593 |
| 22. | 38117 | 2.5% | 5.3%(-2.80)#475 | 4.9%(-2.40)#21,591 |
| 23. | 38141 | 2.0% | 5.3%(-3.30)#509 | 4.9%(-2.90)#23,637 |
| 24. | 38125 | 1.9% | 5.3%(-3.40)#511 | 4.9%(-3.00)#23,971 |
| 25. | 38133 | 1.5% | 5.3%(-3.80)#525 | 4.9%(-3.40)#25,435 |
1
Common Questions
What are the Top 10 Zip Codes with the Highest Percentage of Households with Income Below $10,000 in Memphis, TN?
Top 10 Zip Codes with the Highest Percentage of Households with Income Below $10,000 in Memphis, TN are:
What zip code has the Highest Percentage of Households with Income Below $10,000 in Memphis, TN?
38126 has the Highest Percentage of Households with Income Below $10,000 in Memphis, TN with 19.2%.
What is the Percentage of Households with Income Below $10,000 in Memphis, TN?
Percentage of Households with Income Below $10,000 in Memphis is 9.0%.
What is the Percentage of Households with Income Below $10,000 in Tennessee?
Percentage of Households with Income Below $10,000 in Tennessee is 5.3%.
What is the Percentage of Households with Income Below $10,000 in the United States?
Percentage of Households with Income Below $10,000 in the United States is 4.9%.