Zip Codes with the Highest Percentage of Self-Employed / Not Incorporated in Memphis, TN
RELATED REPORTS & OPTIONS
Self-Employed / Not Incorporated
Memphis
Compare Zip Codes
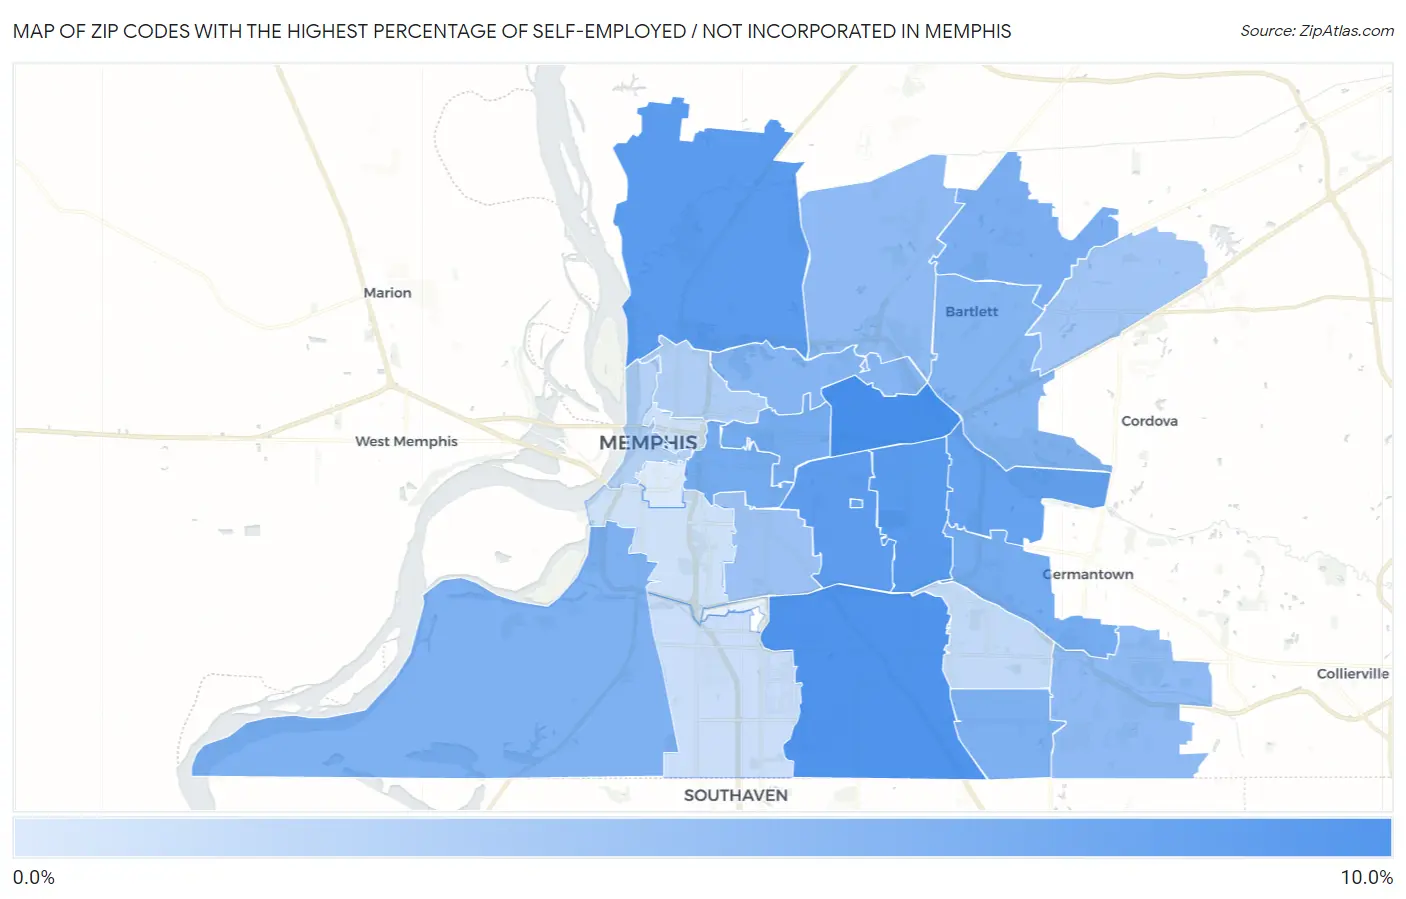
Map of Zip Codes with the Highest Percentage of Self-Employed / Not Incorporated in Memphis
0.0%
10.0%
Zip Codes with the Highest Percentage of Self-Employed / Not Incorporated in Memphis, TN
| Zip Code | % Self-Employed / Not Incorporated | vs State | vs National | |
| 1. | 38122 | 8.1% | 6.7%(+1.35)#219 | 5.8%(+2.24)#10,518 |
| 2. | 38118 | 7.8% | 6.7%(+1.05)#241 | 5.8%(+1.94)#11,163 |
| 3. | 38117 | 7.3% | 6.7%(+0.541)#284 | 5.8%(+1.44)#12,386 |
| 4. | 38127 | 7.1% | 6.7%(+0.345)#296 | 5.8%(+1.24)#12,895 |
| 5. | 38111 | 6.9% | 6.7%(+0.201)#308 | 5.8%(+1.10)#13,288 |
| 6. | 38120 | 6.6% | 6.7%(-0.122)#332 | 5.8%(+0.773)#14,170 |
| 7. | 38152 | 6.3% | 6.7%(-0.436)#354 | 5.8%(+0.459)#15,174 |
| 8. | 38119 | 5.8% | 6.7%(-0.902)#391 | 5.8%(-0.007)#16,679 |
| 9. | 38112 | 5.7% | 6.7%(-0.965)#396 | 5.8%(-0.070)#16,878 |
| 10. | 38104 | 5.7% | 6.7%(-0.968)#398 | 5.8%(-0.073)#16,887 |
| 11. | 38135 | 5.5% | 6.7%(-1.18)#420 | 5.8%(-0.289)#17,687 |
| 12. | 38141 | 5.4% | 6.7%(-1.31)#426 | 5.8%(-0.416)#18,124 |
| 13. | 38109 | 5.3% | 6.7%(-1.38)#430 | 5.8%(-0.489)#18,420 |
| 14. | 38134 | 5.1% | 6.7%(-1.58)#443 | 5.8%(-0.683)#19,175 |
| 15. | 38108 | 4.9% | 6.7%(-1.78)#454 | 5.8%(-0.883)#19,929 |
| 16. | 38125 | 4.6% | 6.7%(-2.14)#467 | 5.8%(-1.24)#21,254 |
| 17. | 38128 | 4.5% | 6.7%(-2.21)#476 | 5.8%(-1.31)#21,572 |
| 18. | 38114 | 3.9% | 6.7%(-2.86)#498 | 5.8%(-1.96)#23,875 |
| 19. | 38133 | 3.7% | 6.7%(-3.02)#503 | 5.8%(-2.12)#24,436 |
| 20. | 38107 | 2.9% | 6.7%(-3.78)#525 | 5.8%(-2.88)#26,531 |
| 21. | 38103 | 2.8% | 6.7%(-3.90)#530 | 5.8%(-3.00)#26,811 |
| 22. | 38115 | 2.1% | 6.7%(-4.63)#554 | 5.8%(-3.74)#28,120 |
| 23. | 38116 | 1.7% | 6.7%(-5.06)#563 | 5.8%(-4.16)#28,578 |
| 24. | 38106 | 1.5% | 6.7%(-5.20)#565 | 5.8%(-4.31)#28,741 |
| 25. | 38105 | 1.4% | 6.7%(-5.30)#570 | 5.8%(-4.41)#28,830 |
| 26. | 38126 | 0.81% | 6.7%(-5.91)#579 | 5.8%(-5.01)#29,241 |
1
Common Questions
What are the Top 10 Zip Codes with the Highest Percentage of Self-Employed / Not Incorporated in Memphis, TN?
Top 10 Zip Codes with the Highest Percentage of Self-Employed / Not Incorporated in Memphis, TN are:
What zip code has the Highest Percentage of Self-Employed / Not Incorporated in Memphis, TN?
38122 has the Highest Percentage of Self-Employed / Not Incorporated in Memphis, TN with 8.1%.
What is the Percentage of Self-Employed / Not Incorporated in Memphis, TN?
Percentage of Self-Employed / Not Incorporated in Memphis is 4.9%.
What is the Percentage of Self-Employed / Not Incorporated in Tennessee?
Percentage of Self-Employed / Not Incorporated in Tennessee is 6.7%.
What is the Percentage of Self-Employed / Not Incorporated in the United States?
Percentage of Self-Employed / Not Incorporated in the United States is 5.8%.