Zip Codes with the Highest Percentage of Households with Income Below $10,000 in Greeneville, TN
RELATED REPORTS & OPTIONS
Household Income | $0-10k
Greeneville
Compare Zip Codes
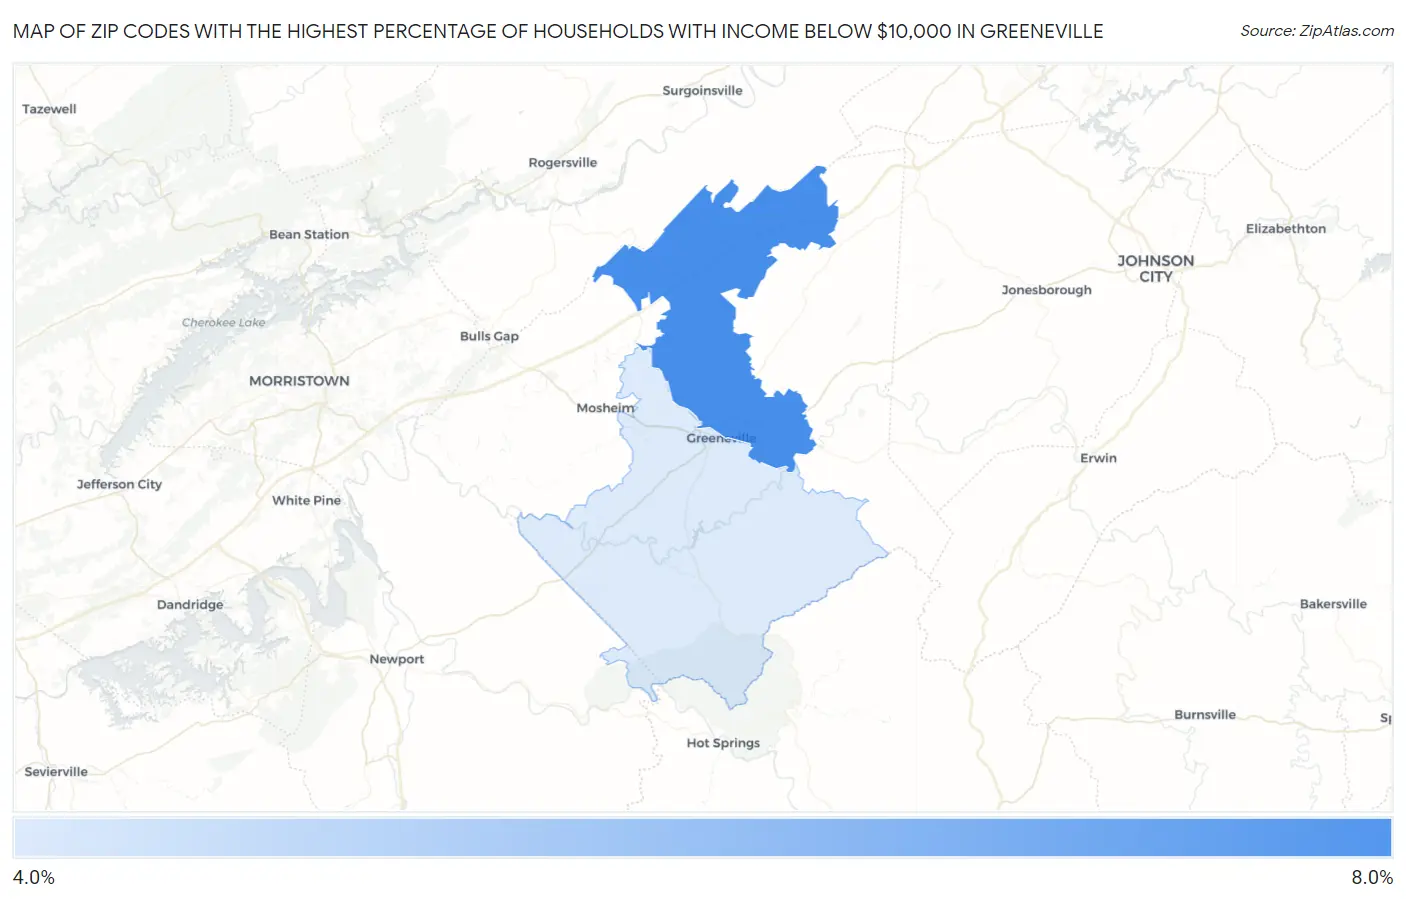
Map of Zip Codes with the Highest Percentage of Households with Income Below $10,000 in Greeneville
4.4%
6.2%
Zip Codes with the Highest Percentage of Households with Income Below $10,000 in Greeneville, TN
| Zip Code | Households with Income < $10k | vs State | vs National | |
| 1. | 37745 | 6.2% | 5.3%(+0.900)#211 | 4.9%(+1.30)#8,558 |
| 2. | 37743 | 4.4% | 5.3%(-0.900)#323 | 4.9%(-0.500)#13,733 |
1
Common Questions
What are the Top Zip Codes with the Highest Percentage of Households with Income Below $10,000 in Greeneville, TN?
Top Zip Codes with the Highest Percentage of Households with Income Below $10,000 in Greeneville, TN are:
What zip code has the Highest Percentage of Households with Income Below $10,000 in Greeneville, TN?
37745 has the Highest Percentage of Households with Income Below $10,000 in Greeneville, TN with 6.2%.
What is the Percentage of Households with Income Below $10,000 in Greeneville, TN?
Percentage of Households with Income Below $10,000 in Greeneville is 8.5%.
What is the Percentage of Households with Income Below $10,000 in Tennessee?
Percentage of Households with Income Below $10,000 in Tennessee is 5.3%.
What is the Percentage of Households with Income Below $10,000 in the United States?
Percentage of Households with Income Below $10,000 in the United States is 4.9%.