Zip Codes with the Lowest Poverty Level Among Children Under the Age of 5 in Memphis, TN
RELATED REPORTS & OPTIONS
Lowest Poverty | Child 0-5
Memphis
Compare Zip Codes
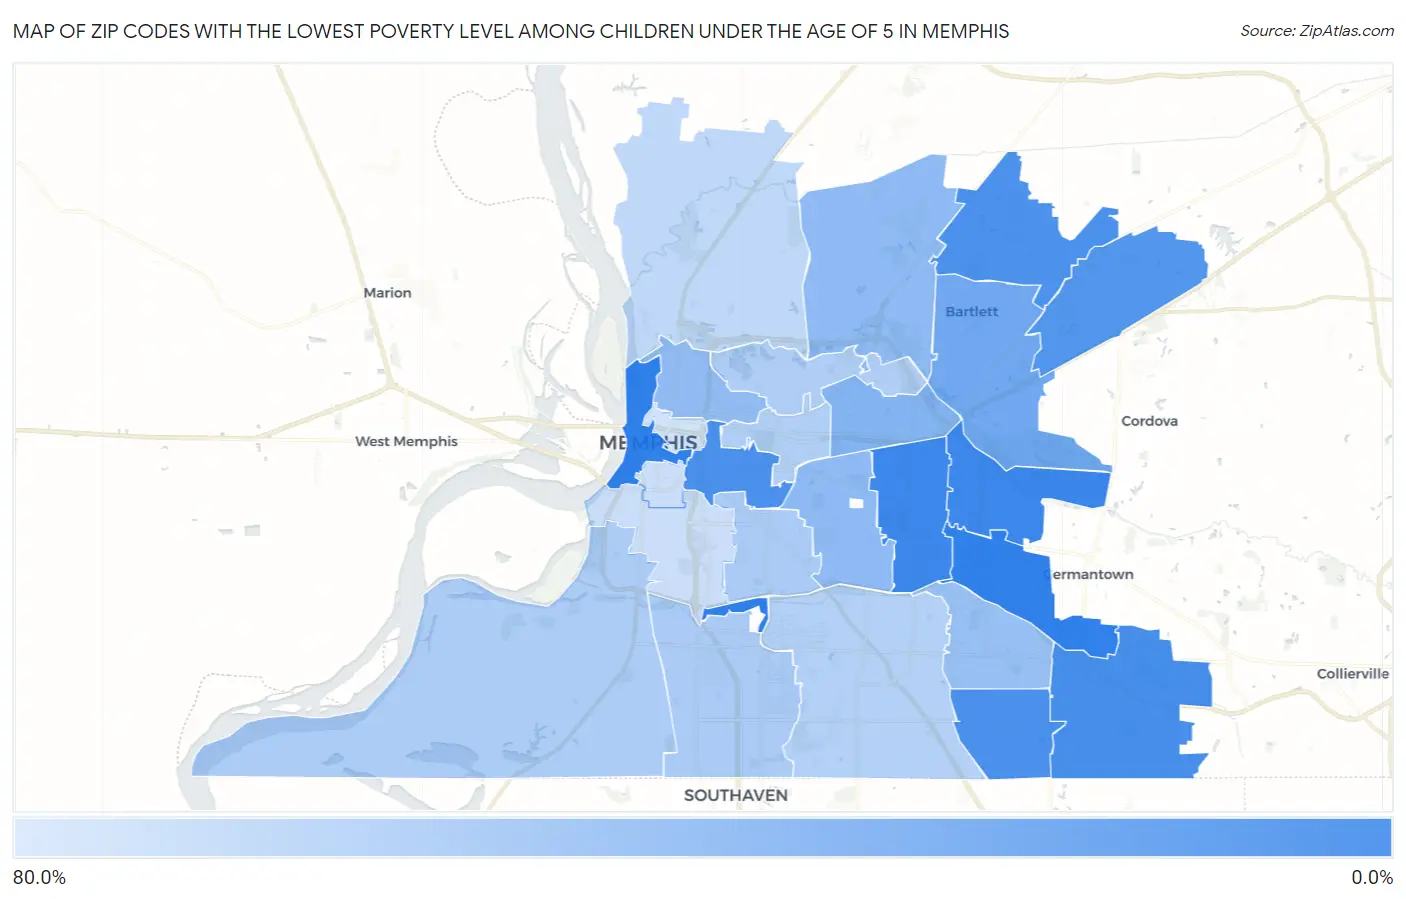
Map of Zip Codes with the Lowest Poverty Level Among Children Under the Age of 5 in Memphis
76.4%
1.6%
Zip Codes with the Lowest Poverty Level Among Children Under the Age of 5 in Memphis, TN
| Zip Code | Child Poverty | vs State | vs National | |
| 1. | 38117 | 1.6% | 21.4%(-19.8)#13 | 18.1%(-16.5)#596 |
| 2. | 38120 | 1.7% | 21.4%(-19.7)#14 | 18.1%(-16.4)#621 |
| 3. | 38125 | 5.9% | 21.4%(-15.5)#59 | 18.1%(-12.1)#3,543 |
| 4. | 38104 | 6.5% | 21.4%(-14.9)#69 | 18.1%(-11.6)#3,922 |
| 5. | 38141 | 7.2% | 21.4%(-14.2)#80 | 18.1%(-10.9)#4,412 |
| 6. | 38135 | 7.8% | 21.4%(-13.6)#90 | 18.1%(-10.3)#4,792 |
| 7. | 38133 | 11.0% | 21.4%(-10.3)#123 | 18.1%(-7.02)#6,860 |
| 8. | 38134 | 23.8% | 21.4%(+2.37)#265 | 18.1%(+5.69)#13,205 |
| 9. | 38122 | 32.6% | 21.4%(+11.2)#346 | 18.1%(+14.5)#15,974 |
| 10. | 38128 | 37.8% | 21.4%(+16.5)#372 | 18.1%(+19.8)#17,233 |
| 11. | 38111 | 38.3% | 21.4%(+16.9)#373 | 18.1%(+20.3)#17,334 |
| 12. | 38107 | 38.9% | 21.4%(+17.5)#378 | 18.1%(+20.9)#17,450 |
| 13. | 38115 | 42.9% | 21.4%(+21.5)#394 | 18.1%(+24.8)#18,150 |
| 14. | 38116 | 52.1% | 21.4%(+30.7)#418 | 18.1%(+34.0)#19,337 |
| 15. | 38114 | 52.3% | 21.4%(+30.9)#419 | 18.1%(+34.2)#19,349 |
| 16. | 38109 | 53.7% | 21.4%(+32.3)#429 | 18.1%(+35.6)#19,495 |
| 17. | 38108 | 55.7% | 21.4%(+34.3)#435 | 18.1%(+37.6)#19,658 |
| 18. | 38112 | 56.9% | 21.4%(+35.5)#441 | 18.1%(+38.8)#19,752 |
| 19. | 38118 | 57.6% | 21.4%(+36.3)#445 | 18.1%(+39.6)#19,818 |
| 20. | 38127 | 66.9% | 21.4%(+45.5)#453 | 18.1%(+48.8)#20,398 |
| 21. | 38106 | 71.4% | 21.4%(+50.0)#455 | 18.1%(+53.4)#20,575 |
| 22. | 38126 | 72.4% | 21.4%(+51.0)#456 | 18.1%(+54.3)#20,602 |
| 23. | 38105 | 76.4% | 21.4%(+55.0)#459 | 18.1%(+58.4)#20,758 |
1
Common Questions
What are the Top 10 Zip Codes with the Lowest Poverty Level Among Children Under the Age of 5 in Memphis, TN?
Top 10 Zip Codes with the Lowest Poverty Level Among Children Under the Age of 5 in Memphis, TN are:
What zip code has the Lowest Poverty Level Among Children Under the Age of 5 in Memphis, TN?
38117 has the Lowest Poverty Level Among Children Under the Age of 5 in Memphis, TN with 1.6%.
What is the Poverty Level Among Children Under the Age of 5 in Memphis, TN?
Poverty Level Among Children Under the Age of 5 in Memphis is 40.5%.
What is the Poverty Level Among Children Under the Age of 5 in Tennessee?
Poverty Level Among Children Under the Age of 5 in Tennessee is 21.4%.
What is the Poverty Level Among Children Under the Age of 5 in the United States?
Poverty Level Among Children Under the Age of 5 in the United States is 18.1%.