Zip Codes with the Highest Percentage of Households with Income Below $10,000 in Franklin, TN
RELATED REPORTS & OPTIONS
Household Income | $0-10k
Franklin
Compare Zip Codes
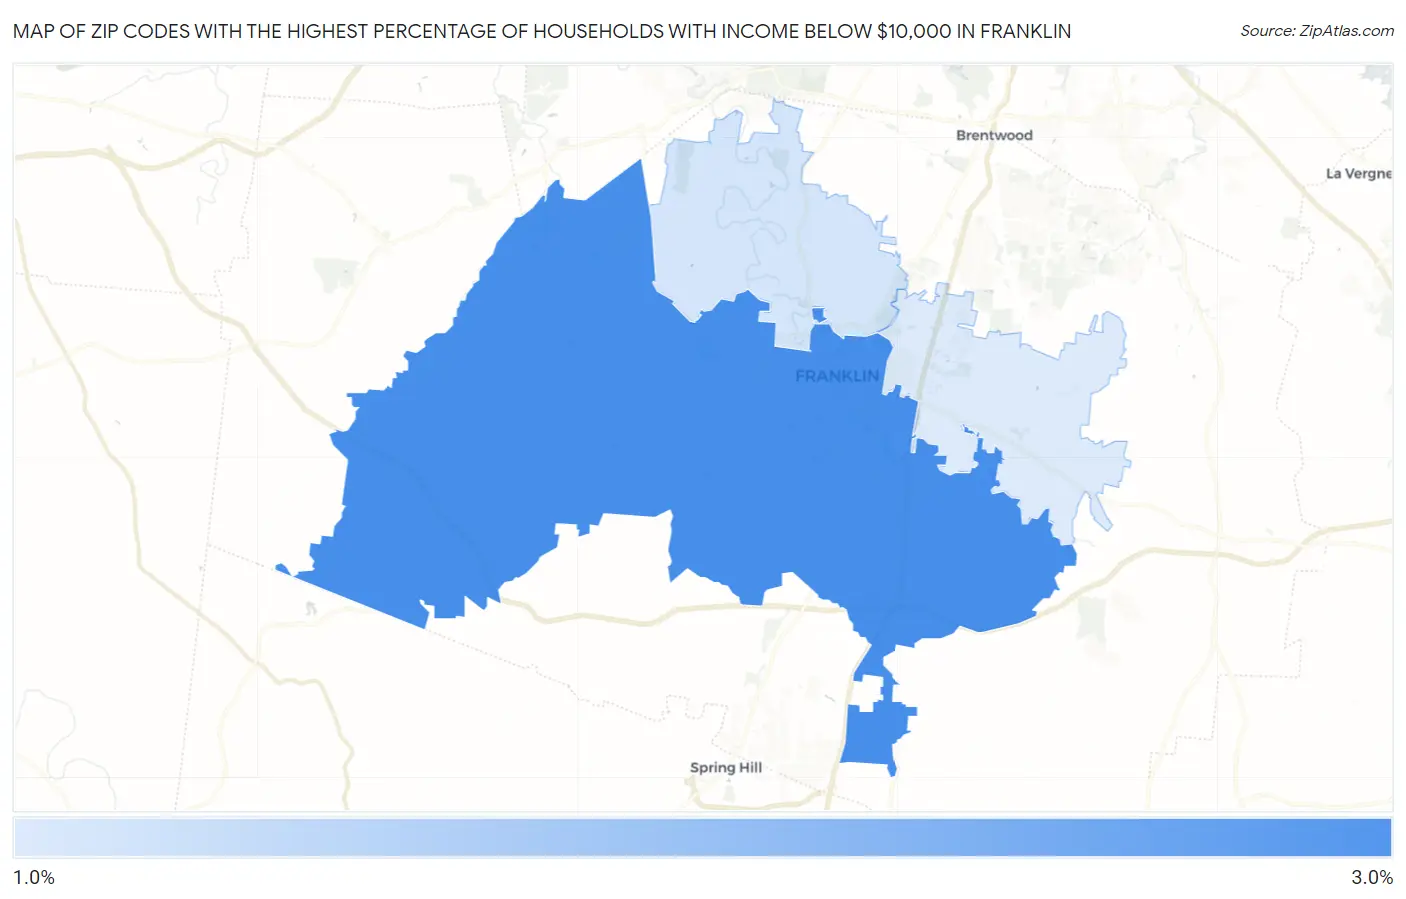
Map of Zip Codes with the Highest Percentage of Households with Income Below $10,000 in Franklin
1.0%
2.8%
Zip Codes with the Highest Percentage of Households with Income Below $10,000 in Franklin, TN
| Zip Code | Households with Income < $10k | vs State | vs National | |
| 1. | 37064 | 2.8% | 5.3%(-2.50)#454 | 4.9%(-2.10)#20,213 |
| 2. | 37069 | 1.1% | 5.3%(-4.20)#536 | 4.9%(-3.80)#26,535 |
| 3. | 37067 | 1.0% | 5.3%(-4.30)#543 | 4.9%(-3.90)#26,779 |
1
Common Questions
What are the Top Zip Codes with the Highest Percentage of Households with Income Below $10,000 in Franklin, TN?
Top Zip Codes with the Highest Percentage of Households with Income Below $10,000 in Franklin, TN are:
What zip code has the Highest Percentage of Households with Income Below $10,000 in Franklin, TN?
37064 has the Highest Percentage of Households with Income Below $10,000 in Franklin, TN with 2.8%.
What is the Percentage of Households with Income Below $10,000 in Franklin, TN?
Percentage of Households with Income Below $10,000 in Franklin is 2.1%.
What is the Percentage of Households with Income Below $10,000 in Tennessee?
Percentage of Households with Income Below $10,000 in Tennessee is 5.3%.
What is the Percentage of Households with Income Below $10,000 in the United States?
Percentage of Households with Income Below $10,000 in the United States is 4.9%.