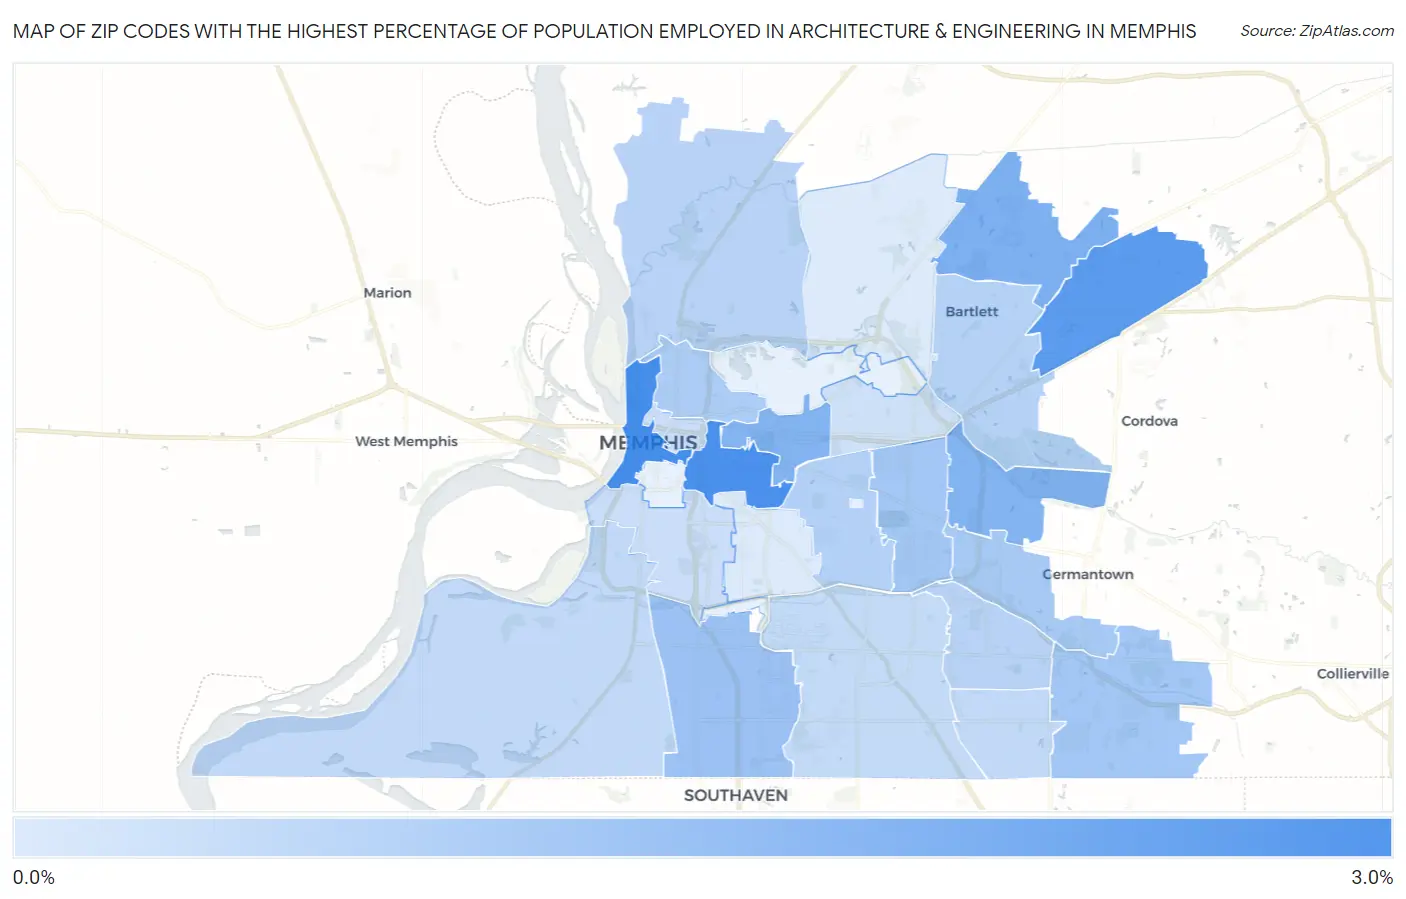
Zip Codes with the Highest Percentage of Population Employed in Architecture & Engineering in Memphis, TN
RELATED REPORTS & OPTIONS
Architecture & Engineering
Memphis
Compare Zip Codes
Map of Zip Codes with the Highest Percentage of Population Employed in Architecture & Engineering in Memphis
0.088%
3.0%
Zip Codes with the Highest Percentage of Population Employed in Architecture & Engineering in Memphis, TN
| Zip Code | % Employed | vs State | vs National | |
| 1. | 38103 | 3.0% | 1.7%(+1.33)#73 | 2.1%(+0.845)#5,075 |
| 2. | 38104 | 3.0% | 1.7%(+1.30)#78 | 2.1%(+0.820)#5,165 |
| 3. | 38133 | 2.6% | 1.7%(+0.897)#106 | 2.1%(+0.415)#6,725 |
| 4. | 38135 | 1.9% | 1.7%(+0.270)#173 | 2.1%(-0.212)#9,996 |
| 5. | 38112 | 1.8% | 1.7%(+0.167)#195 | 2.1%(-0.314)#10,634 |
| 6. | 38120 | 1.8% | 1.7%(+0.134)#201 | 2.1%(-0.347)#10,811 |
| 7. | 38116 | 1.4% | 1.7%(-0.279)#265 | 2.1%(-0.760)#13,672 |
| 8. | 38125 | 1.2% | 1.7%(-0.469)#298 | 2.1%(-0.950)#15,084 |
| 9. | 38117 | 1.2% | 1.7%(-0.481)#301 | 2.1%(-0.963)#15,192 |
| 10. | 38119 | 1.1% | 1.7%(-0.580)#312 | 2.1%(-1.06)#15,964 |
| 11. | 38107 | 1.0% | 1.7%(-0.658)#331 | 2.1%(-1.14)#16,532 |
| 12. | 38111 | 0.88% | 1.7%(-0.788)#360 | 2.1%(-1.27)#17,534 |
| 13. | 38134 | 0.82% | 1.7%(-0.845)#368 | 2.1%(-1.33)#17,965 |
| 14. | 38115 | 0.81% | 1.7%(-0.861)#369 | 2.1%(-1.34)#18,077 |
| 15. | 38127 | 0.78% | 1.7%(-0.883)#371 | 2.1%(-1.36)#18,245 |
| 16. | 38141 | 0.62% | 1.7%(-1.04)#397 | 2.1%(-1.52)#19,441 |
| 17. | 38109 | 0.60% | 1.7%(-1.07)#402 | 2.1%(-1.55)#19,609 |
| 18. | 38118 | 0.57% | 1.7%(-1.10)#408 | 2.1%(-1.58)#19,862 |
| 19. | 38105 | 0.44% | 1.7%(-1.23)#422 | 2.1%(-1.71)#20,637 |
| 20. | 38106 | 0.44% | 1.7%(-1.23)#424 | 2.1%(-1.71)#20,697 |
| 21. | 38122 | 0.36% | 1.7%(-1.31)#433 | 2.1%(-1.79)#21,246 |
| 22. | 38114 | 0.10% | 1.7%(-1.56)#462 | 2.1%(-2.05)#22,373 |
| 23. | 38128 | 0.088% | 1.7%(-1.58)#464 | 2.1%(-2.06)#22,404 |
1
Common Questions
What are the Top 10 Zip Codes with the Highest Percentage of Population Employed in Architecture & Engineering in Memphis, TN?
Top 10 Zip Codes with the Highest Percentage of Population Employed in Architecture & Engineering in Memphis, TN are:
What zip code has the Highest Percentage of Population Employed in Architecture & Engineering in Memphis, TN?
38103 has the Highest Percentage of Population Employed in Architecture & Engineering in Memphis, TN with 3.0%.
What is the Percentage of Population Employed in Architecture & Engineering in Memphis, TN?
Percentage of Population Employed in Architecture & Engineering in Memphis is 1.1%.
What is the Percentage of Population Employed in Architecture & Engineering in Tennessee?
Percentage of Population Employed in Architecture & Engineering in Tennessee is 1.7%.
What is the Percentage of Population Employed in Architecture & Engineering in the United States?
Percentage of Population Employed in Architecture & Engineering in the United States is 2.1%.