Zip Codes with the Highest Percentage of Population Employed in Accommodation & Food Services in Memphis, TN
RELATED REPORTS & OPTIONS
Accommodation & Food Services
Memphis
Compare Zip Codes
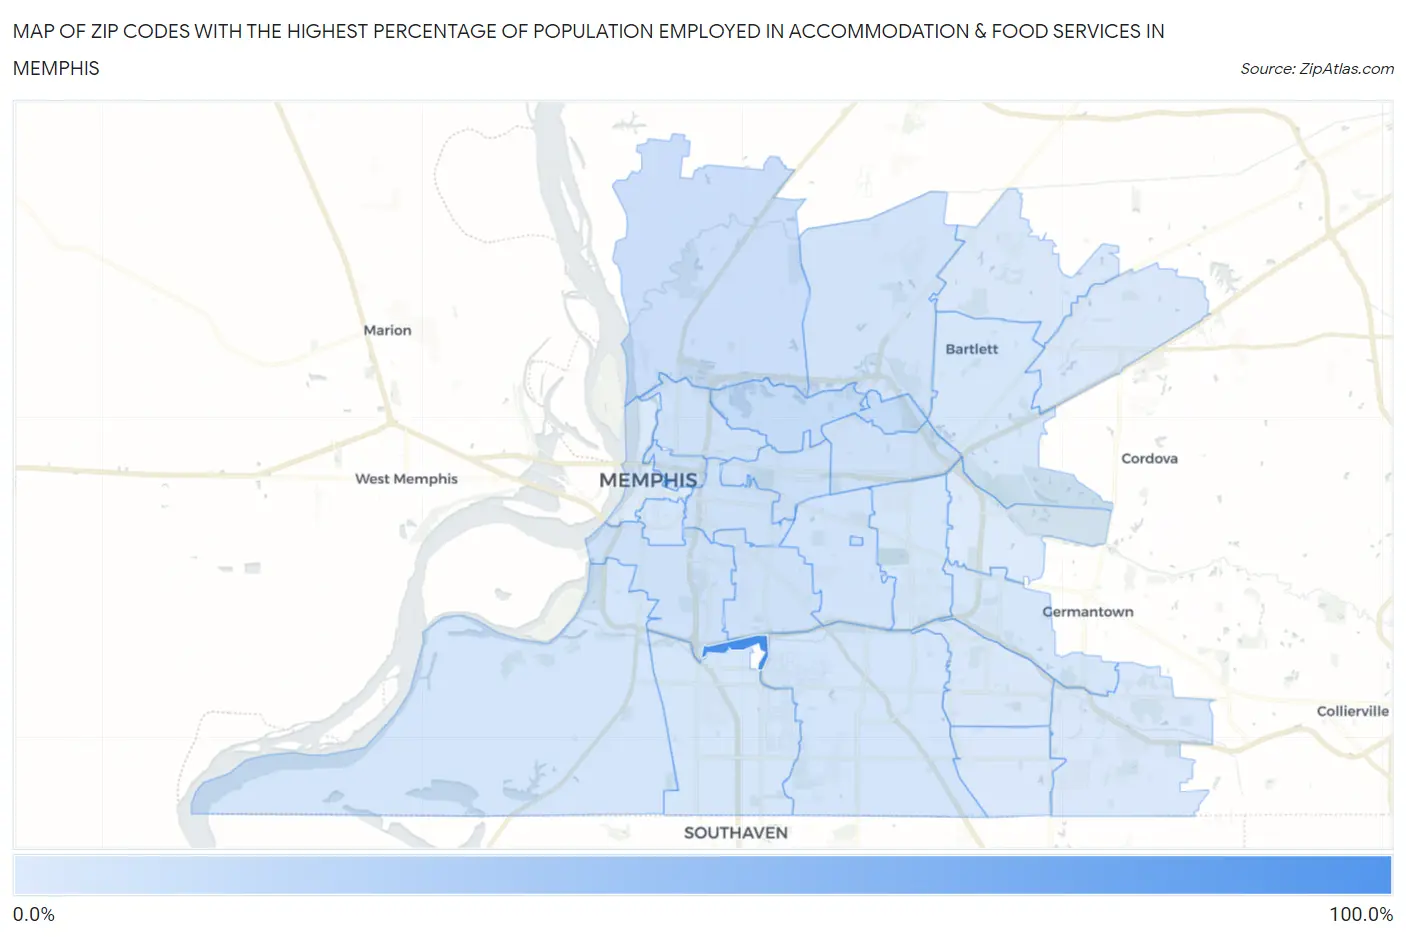
Map of Zip Codes with the Highest Percentage of Population Employed in Accommodation & Food Services in Memphis
3.6%
100.0%
Zip Codes with the Highest Percentage of Population Employed in Accommodation & Food Services in Memphis, TN
| Zip Code | % Employed | vs State | vs National | |
| 1. | 38132 | 100.0% | 7.4%(+92.6)#1 | 6.9%(+93.1)#16 |
| 2. | 38108 | 14.6% | 7.4%(+7.23)#31 | 6.9%(+7.74)#1,783 |
| 3. | 38152 | 13.3% | 7.4%(+5.94)#37 | 6.9%(+6.45)#2,213 |
| 4. | 38127 | 12.8% | 7.4%(+5.37)#40 | 6.9%(+5.88)#2,451 |
| 5. | 38112 | 11.2% | 7.4%(+3.77)#68 | 6.9%(+4.28)#3,424 |
| 6. | 38105 | 10.8% | 7.4%(+3.46)#73 | 6.9%(+3.97)#3,678 |
| 7. | 38107 | 10.6% | 7.4%(+3.22)#78 | 6.9%(+3.73)#3,866 |
| 8. | 38114 | 10.3% | 7.4%(+2.86)#87 | 6.9%(+3.37)#4,246 |
| 9. | 38104 | 10.1% | 7.4%(+2.67)#91 | 6.9%(+3.18)#4,449 |
| 10. | 38106 | 9.7% | 7.4%(+2.27)#100 | 6.9%(+2.78)#4,970 |
| 11. | 38122 | 9.6% | 7.4%(+2.26)#102 | 6.9%(+2.77)#4,995 |
| 12. | 38111 | 9.1% | 7.4%(+1.70)#125 | 6.9%(+2.21)#5,804 |
| 13. | 38128 | 8.6% | 7.4%(+1.18)#141 | 6.9%(+1.69)#6,691 |
| 14. | 38126 | 7.7% | 7.4%(+0.301)#177 | 6.9%(+0.811)#8,514 |
| 15. | 38118 | 7.6% | 7.4%(+0.188)#181 | 6.9%(+0.698)#8,792 |
| 16. | 38109 | 7.6% | 7.4%(+0.182)#183 | 6.9%(+0.693)#8,799 |
| 17. | 38117 | 7.2% | 7.4%(-0.228)#221 | 6.9%(+0.282)#9,894 |
| 18. | 38119 | 6.9% | 7.4%(-0.448)#236 | 6.9%(+0.062)#10,489 |
| 19. | 38134 | 6.8% | 7.4%(-0.547)#243 | 6.9%(-0.036)#10,739 |
| 20. | 38116 | 6.5% | 7.4%(-0.871)#268 | 6.9%(-0.360)#11,781 |
| 21. | 38133 | 6.2% | 7.4%(-1.16)#290 | 6.9%(-0.650)#12,696 |
| 22. | 38135 | 5.8% | 7.4%(-1.56)#306 | 6.9%(-1.05)#13,991 |
| 23. | 38115 | 5.4% | 7.4%(-2.01)#332 | 6.9%(-1.50)#15,465 |
| 24. | 38141 | 5.1% | 7.4%(-2.27)#348 | 6.9%(-1.76)#16,378 |
| 25. | 38125 | 4.6% | 7.4%(-2.83)#385 | 6.9%(-2.32)#18,278 |
| 26. | 38103 | 4.0% | 7.4%(-3.35)#417 | 6.9%(-2.84)#20,025 |
| 27. | 38120 | 3.6% | 7.4%(-3.81)#449 | 6.9%(-3.30)#21,533 |
1
Common Questions
What are the Top 10 Zip Codes with the Highest Percentage of Population Employed in Accommodation & Food Services in Memphis, TN?
Top 10 Zip Codes with the Highest Percentage of Population Employed in Accommodation & Food Services in Memphis, TN are:
What zip code has the Highest Percentage of Population Employed in Accommodation & Food Services in Memphis, TN?
38132 has the Highest Percentage of Population Employed in Accommodation & Food Services in Memphis, TN with 100.0%.
What is the Percentage of Population Employed in Accommodation & Food Services in Memphis, TN?
Percentage of Population Employed in Accommodation & Food Services in Memphis is 8.0%.
What is the Percentage of Population Employed in Accommodation & Food Services in Tennessee?
Percentage of Population Employed in Accommodation & Food Services in Tennessee is 7.4%.
What is the Percentage of Population Employed in Accommodation & Food Services in the United States?
Percentage of Population Employed in Accommodation & Food Services in the United States is 6.9%.