Zip Codes with the Highest Percentage of Households with Income Below $10,000 in Kingsport, TN
RELATED REPORTS & OPTIONS
Household Income | $0-10k
Kingsport
Compare Zip Codes
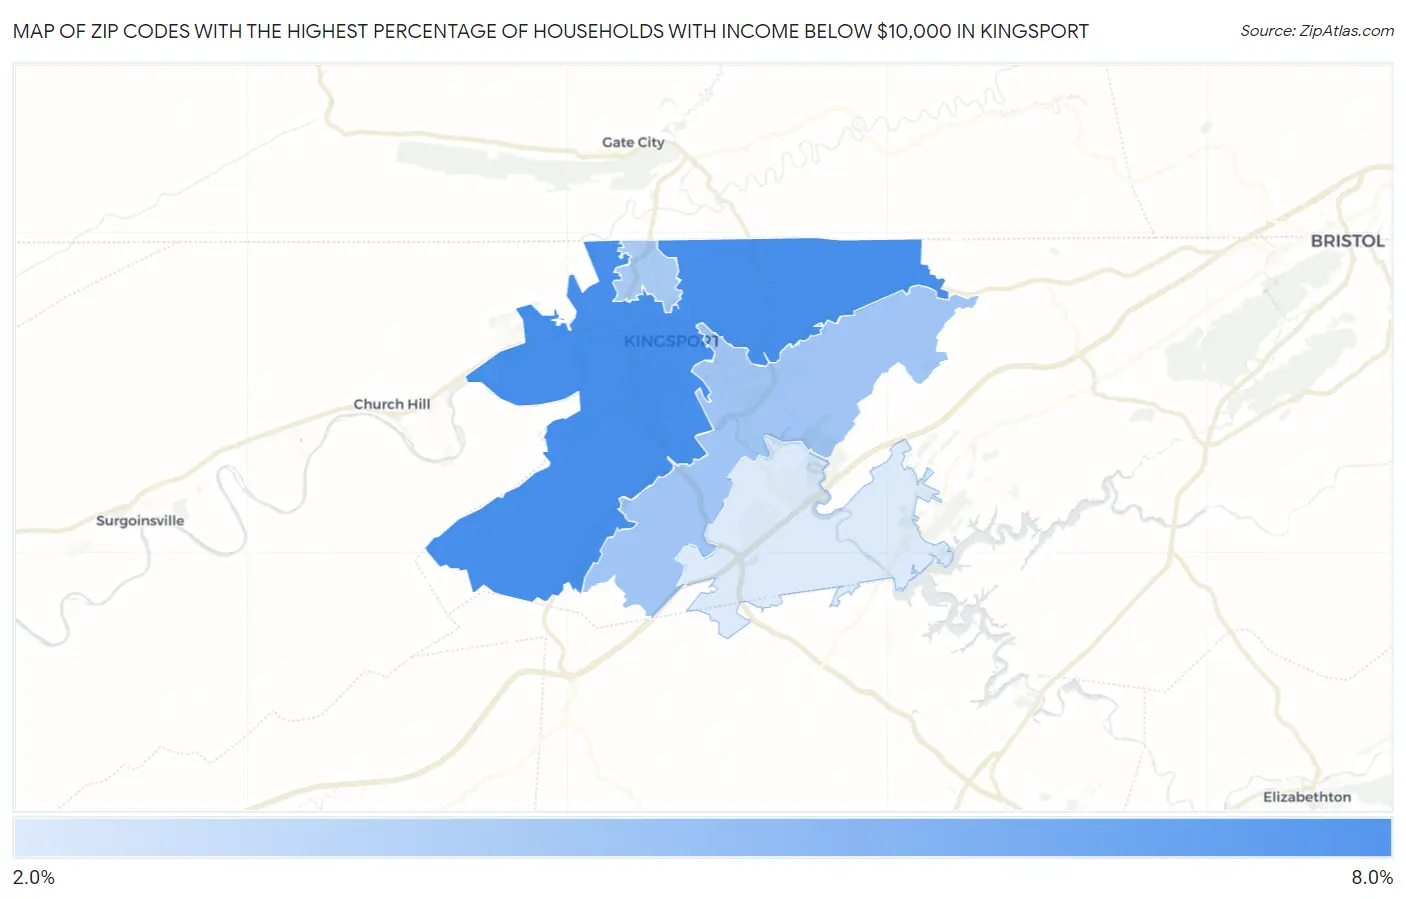
Map of Zip Codes with the Highest Percentage of Households with Income Below $10,000 in Kingsport
2.2%
7.9%
Zip Codes with the Highest Percentage of Households with Income Below $10,000 in Kingsport, TN
| Zip Code | Households with Income < $10k | vs State | vs National | |
| 1. | 37660 | 7.9% | 5.3%(+2.60)#145 | 4.9%(+3.00)#5,670 |
| 2. | 37664 | 4.4% | 5.3%(-0.900)#322 | 4.9%(-0.500)#13,708 |
| 3. | 37665 | 4.2% | 5.3%(-1.10)#336 | 4.9%(-0.700)#14,610 |
| 4. | 37663 | 2.2% | 5.3%(-3.10)#495 | 4.9%(-2.70)#22,928 |
1
Common Questions
What are the Top 3 Zip Codes with the Highest Percentage of Households with Income Below $10,000 in Kingsport, TN?
Top 3 Zip Codes with the Highest Percentage of Households with Income Below $10,000 in Kingsport, TN are:
What zip code has the Highest Percentage of Households with Income Below $10,000 in Kingsport, TN?
37660 has the Highest Percentage of Households with Income Below $10,000 in Kingsport, TN with 7.9%.
What is the Percentage of Households with Income Below $10,000 in Kingsport, TN?
Percentage of Households with Income Below $10,000 in Kingsport is 6.4%.
What is the Percentage of Households with Income Below $10,000 in Tennessee?
Percentage of Households with Income Below $10,000 in Tennessee is 5.3%.
What is the Percentage of Households with Income Below $10,000 in the United States?
Percentage of Households with Income Below $10,000 in the United States is 4.9%.