Zip Codes with the Highest Percentage of Population Employed in Life, Physical & Social Science in Memphis, TN
RELATED REPORTS & OPTIONS
Life, Physical & Social Science
Memphis
Compare Zip Codes
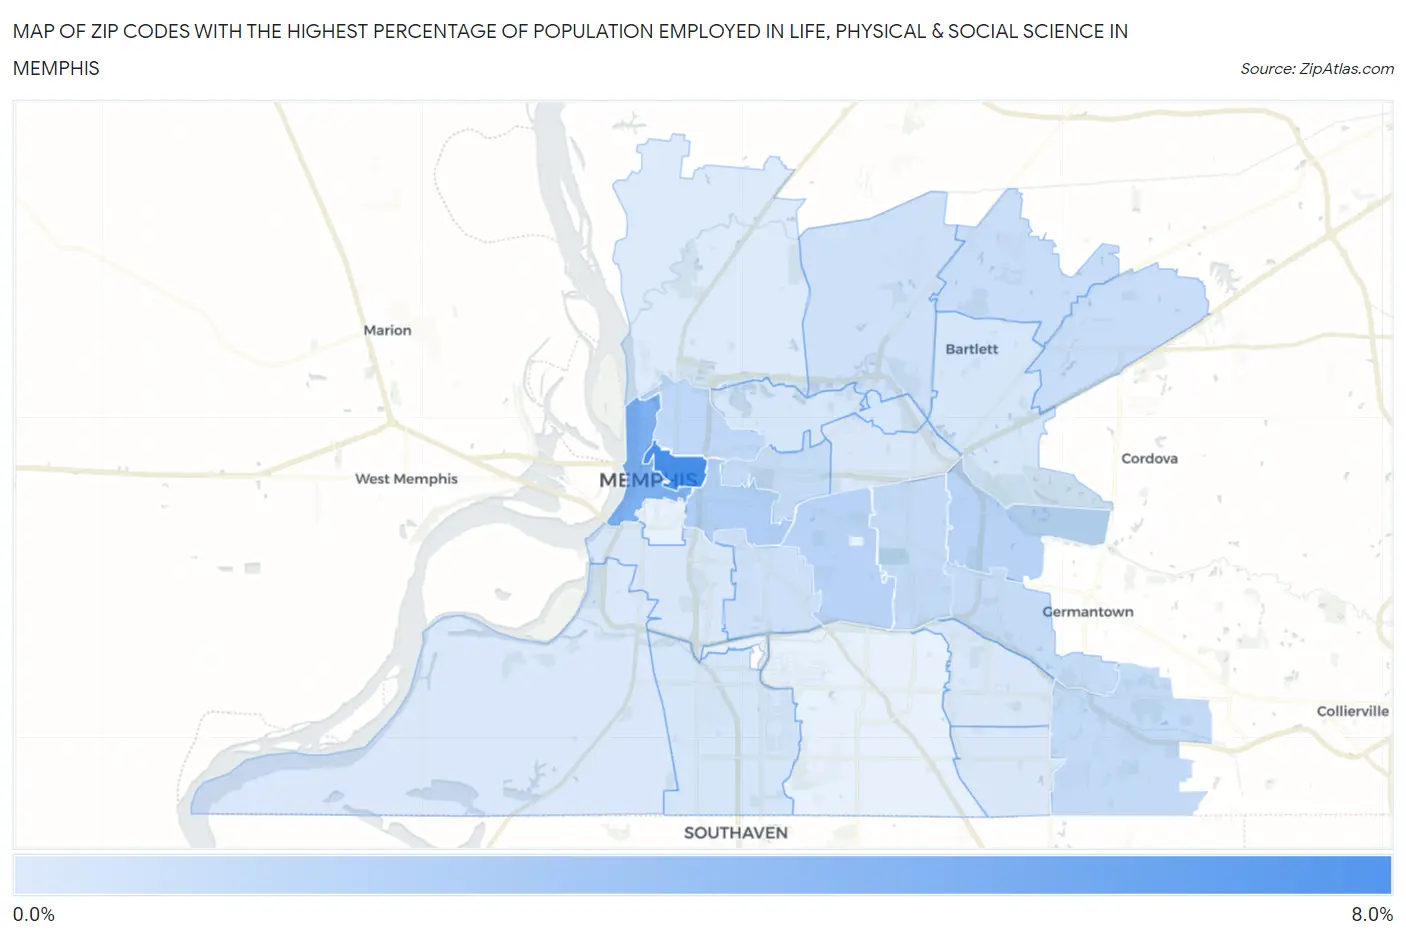
Map of Zip Codes with the Highest Percentage of Population Employed in Life, Physical & Social Science in Memphis
0.071%
6.5%
Zip Codes with the Highest Percentage of Population Employed in Life, Physical & Social Science in Memphis, TN
| Zip Code | % Employed | vs State | vs National | |
| 1. | 38105 | 6.5% | 0.83%(+5.63)#5 | 1.1%(+5.37)#481 |
| 2. | 38103 | 4.1% | 0.83%(+3.27)#9 | 1.1%(+3.01)#1,100 |
| 3. | 38104 | 1.9% | 0.83%(+1.10)#56 | 1.1%(+0.839)#3,889 |
| 4. | 38120 | 1.6% | 0.83%(+0.749)#73 | 1.1%(+0.489)#5,252 |
| 5. | 38111 | 1.6% | 0.83%(+0.739)#74 | 1.1%(+0.479)#5,294 |
| 6. | 38107 | 1.3% | 0.83%(+0.471)#97 | 1.1%(+0.212)#6,786 |
| 7. | 38125 | 1.1% | 0.83%(+0.279)#124 | 1.1%(+0.019)#8,153 |
| 8. | 38117 | 1.1% | 0.83%(+0.268)#125 | 1.1%(+0.008)#8,223 |
| 9. | 38112 | 0.99% | 0.83%(+0.155)#147 | 1.1%(-0.105)#9,169 |
| 10. | 38119 | 0.99% | 0.83%(+0.154)#148 | 1.1%(-0.106)#9,181 |
| 11. | 38133 | 0.95% | 0.83%(+0.119)#156 | 1.1%(-0.141)#9,492 |
| 12. | 38135 | 0.94% | 0.83%(+0.108)#160 | 1.1%(-0.151)#9,577 |
| 13. | 38114 | 0.63% | 0.83%(-0.198)#212 | 1.1%(-0.458)#12,871 |
| 14. | 38128 | 0.62% | 0.83%(-0.215)#220 | 1.1%(-0.475)#13,094 |
| 15. | 38134 | 0.35% | 0.83%(-0.478)#285 | 1.1%(-0.738)#16,372 |
| 16. | 38116 | 0.34% | 0.83%(-0.489)#288 | 1.1%(-0.748)#16,497 |
| 17. | 38108 | 0.33% | 0.83%(-0.500)#293 | 1.1%(-0.760)#16,654 |
| 18. | 38115 | 0.25% | 0.83%(-0.577)#315 | 1.1%(-0.836)#17,588 |
| 19. | 38106 | 0.25% | 0.83%(-0.580)#317 | 1.1%(-0.840)#17,623 |
| 20. | 38122 | 0.23% | 0.83%(-0.603)#324 | 1.1%(-0.863)#17,886 |
| 21. | 38141 | 0.21% | 0.83%(-0.617)#328 | 1.1%(-0.877)#18,035 |
| 22. | 38109 | 0.19% | 0.83%(-0.637)#331 | 1.1%(-0.897)#18,256 |
| 23. | 38127 | 0.071% | 0.83%(-0.760)#360 | 1.1%(-1.02)#19,242 |
1
Common Questions
What are the Top 10 Zip Codes with the Highest Percentage of Population Employed in Life, Physical & Social Science in Memphis, TN?
Top 10 Zip Codes with the Highest Percentage of Population Employed in Life, Physical & Social Science in Memphis, TN are:
What zip code has the Highest Percentage of Population Employed in Life, Physical & Social Science in Memphis, TN?
38105 has the Highest Percentage of Population Employed in Life, Physical & Social Science in Memphis, TN with 6.5%.
What is the Percentage of Population Employed in Life, Physical & Social Science in Memphis, TN?
Percentage of Population Employed in Life, Physical & Social Science in Memphis is 0.89%.
What is the Percentage of Population Employed in Life, Physical & Social Science in Tennessee?
Percentage of Population Employed in Life, Physical & Social Science in Tennessee is 0.83%.
What is the Percentage of Population Employed in Life, Physical & Social Science in the United States?
Percentage of Population Employed in Life, Physical & Social Science in the United States is 1.1%.