Zip Codes with the Highest Percentage of Households Without a Vehicle in Memphis, TN
RELATED REPORTS & OPTIONS
Households without a Cars
Memphis
Compare Zip Codes
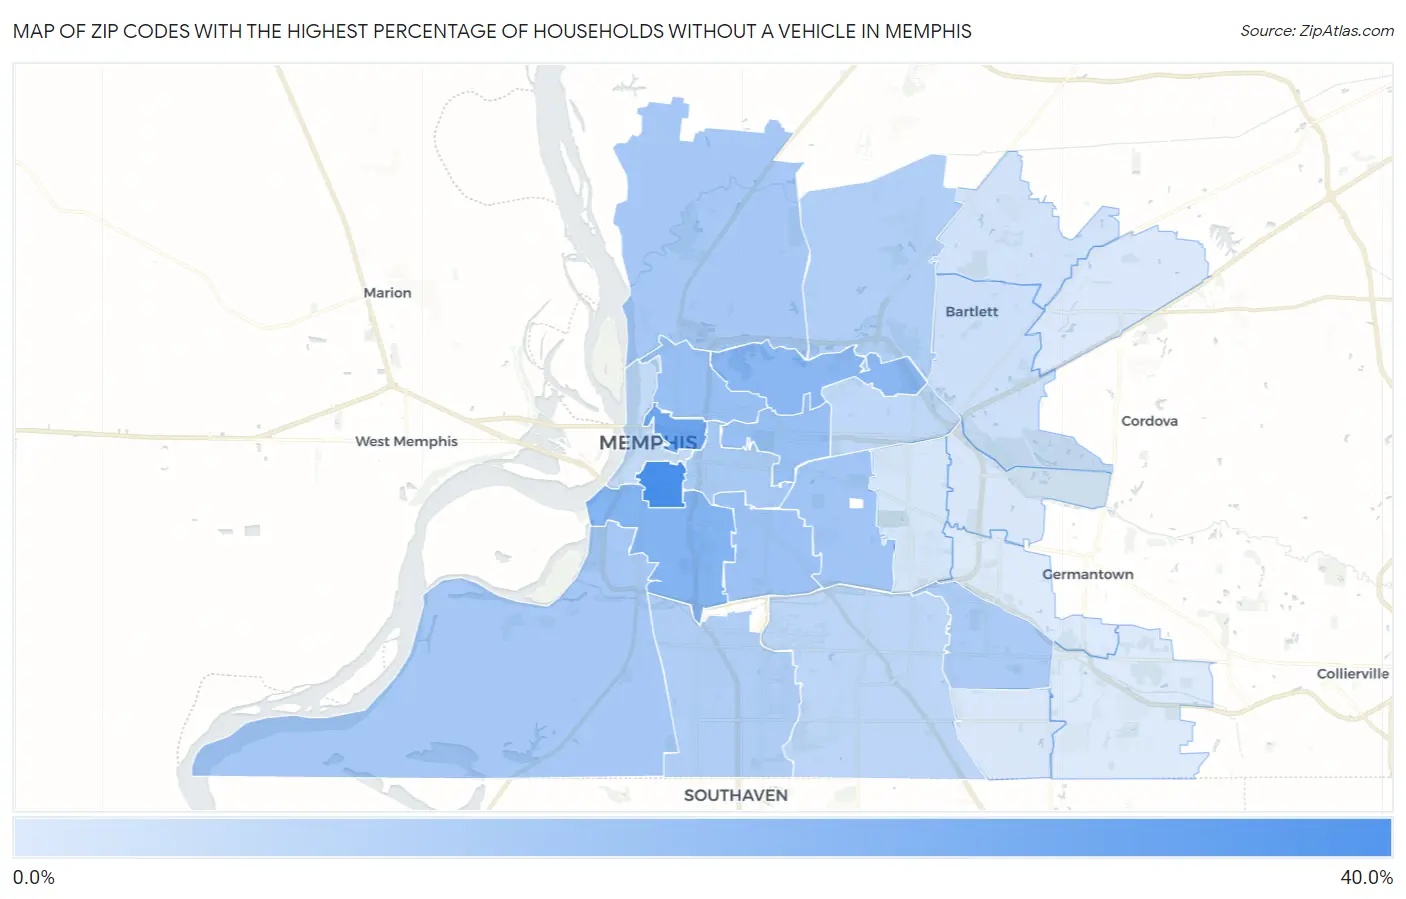
Map of Zip Codes with the Highest Percentage of Households Without a Vehicle in Memphis
1.6%
36.5%
Zip Codes with the Highest Percentage of Households Without a Vehicle in Memphis, TN
| Zip Code | Housholds Without a Car | vs State | vs National | |
| 1. | 38126 | 36.5% | 5.3%(+31.2)#5 | 8.3%(+28.2)#605 |
| 2. | 38105 | 26.9% | 5.3%(+21.6)#10 | 8.3%(+18.6)#950 |
| 3. | 38106 | 21.1% | 5.3%(+15.8)#11 | 8.3%(+12.8)#1,378 |
| 4. | 38108 | 19.7% | 5.3%(+14.4)#15 | 8.3%(+11.4)#1,543 |
| 5. | 38112 | 16.6% | 5.3%(+11.3)#23 | 8.3%(+8.30)#2,040 |
| 6. | 38107 | 16.5% | 5.3%(+11.2)#25 | 8.3%(+8.20)#2,056 |
| 7. | 38114 | 15.6% | 5.3%(+10.3)#30 | 8.3%(+7.30)#2,235 |
| 8. | 38111 | 14.3% | 5.3%(+9.00)#32 | 8.3%(+6.00)#2,585 |
| 9. | 38127 | 13.4% | 5.3%(+8.10)#39 | 8.3%(+5.10)#2,914 |
| 10. | 38109 | 13.2% | 5.3%(+7.90)#41 | 8.3%(+4.90)#3,001 |
| 11. | 38104 | 12.8% | 5.3%(+7.50)#44 | 8.3%(+4.50)#3,181 |
| 12. | 38115 | 12.4% | 5.3%(+7.10)#47 | 8.3%(+4.10)#3,360 |
| 13. | 38116 | 11.1% | 5.3%(+5.80)#57 | 8.3%(+2.80)#4,069 |
| 14. | 38128 | 10.7% | 5.3%(+5.40)#63 | 8.3%(+2.40)#4,301 |
| 15. | 38118 | 8.5% | 5.3%(+3.20)#95 | 8.3%(+0.200)#6,307 |
| 16. | 38122 | 7.9% | 5.3%(+2.60)#111 | 8.3%(-0.400)#7,103 |
| 17. | 38103 | 6.9% | 5.3%(+1.60)#149 | 8.3%(-1.40)#8,739 |
| 18. | 38134 | 5.1% | 5.3%(-0.200)#229 | 8.3%(-3.20)#12,584 |
| 19. | 38135 | 3.7% | 5.3%(-1.60)#318 | 8.3%(-4.60)#16,667 |
| 20. | 38117 | 3.0% | 5.3%(-2.30)#368 | 8.3%(-5.30)#19,080 |
| 21. | 38141 | 2.4% | 5.3%(-2.90)#417 | 8.3%(-5.90)#21,064 |
| 22. | 38120 | 2.4% | 5.3%(-2.90)#419 | 8.3%(-5.90)#21,105 |
| 23. | 38133 | 2.1% | 5.3%(-3.20)#438 | 8.3%(-6.20)#22,090 |
| 24. | 38125 | 1.7% | 5.3%(-3.60)#469 | 8.3%(-6.60)#23,435 |
| 25. | 38119 | 1.6% | 5.3%(-3.70)#477 | 8.3%(-6.70)#23,784 |
1
Common Questions
What are the Top 10 Zip Codes with the Highest Percentage of Households Without a Vehicle in Memphis, TN?
Top 10 Zip Codes with the Highest Percentage of Households Without a Vehicle in Memphis, TN are:
What zip code has the Highest Percentage of Households Without a Vehicle in Memphis, TN?
38126 has the Highest Percentage of Households Without a Vehicle in Memphis, TN with 36.5%.
What is the Percentage of Households Without a Vehicle in Memphis, TN?
Percentage of Households Without a Vehicle in Memphis is 10.7%.
What is the Percentage of Households Without a Vehicle in Tennessee?
Percentage of Households Without a Vehicle in Tennessee is 5.3%.
What is the Percentage of Households Without a Vehicle in the United States?
Percentage of Households Without a Vehicle in the United States is 8.3%.