Zip Codes with the Highest Percentage of Households with Income Below $10,000 in Cookeville, TN
RELATED REPORTS & OPTIONS
Household Income | $0-10k
Cookeville
Compare Zip Codes
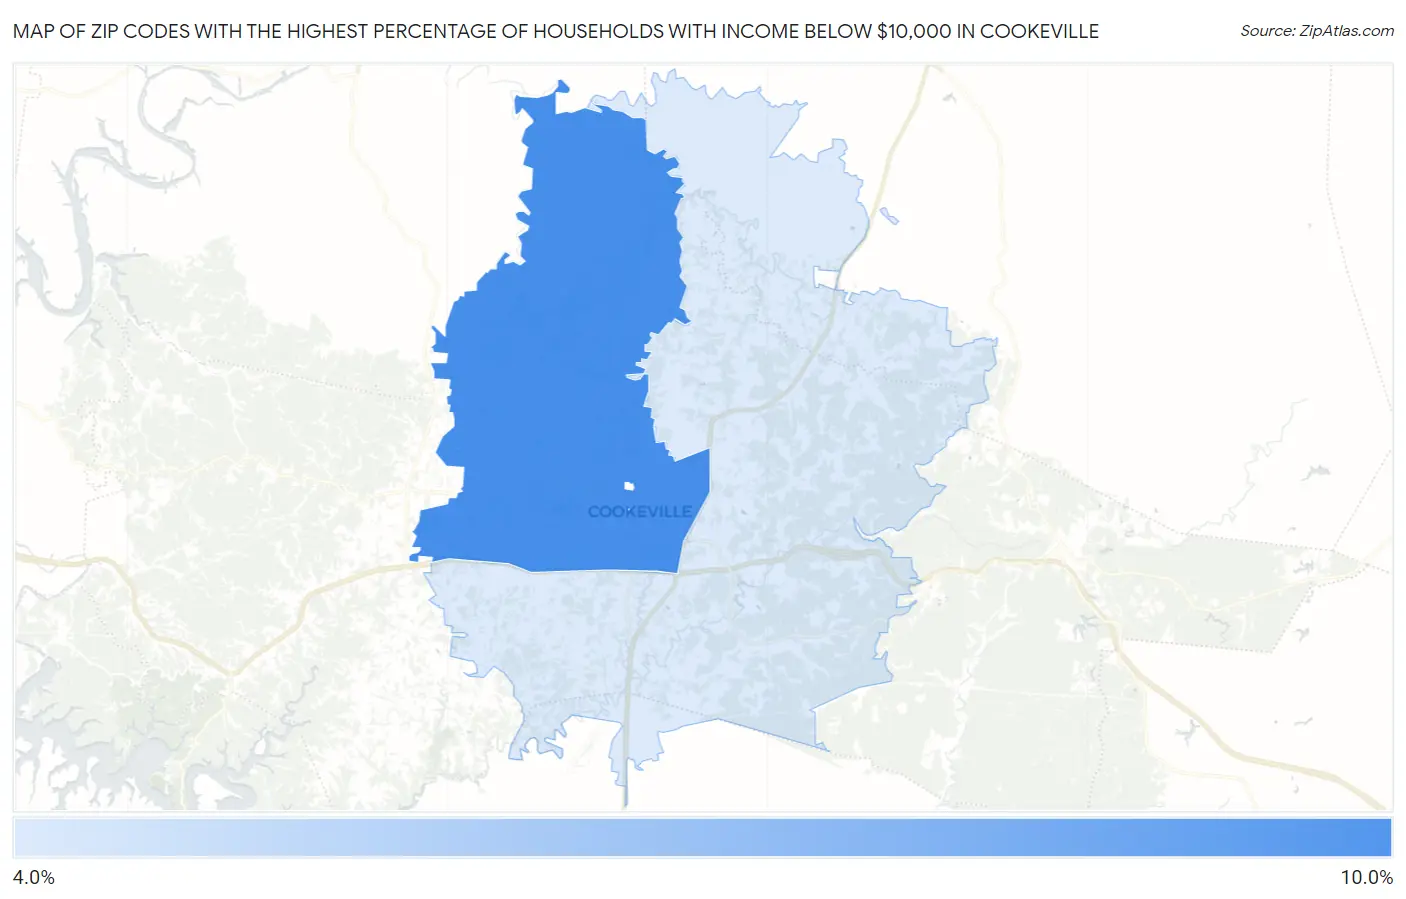
Map of Zip Codes with the Highest Percentage of Households with Income Below $10,000 in Cookeville
4.2%
8.3%
Zip Codes with the Highest Percentage of Households with Income Below $10,000 in Cookeville, TN
| Zip Code | Households with Income < $10k | vs State | vs National | |
| 1. | 38501 | 8.3% | 5.3%(+3.00)#129 | 4.9%(+3.40)#5,154 |
| 2. | 38506 | 4.2% | 5.3%(-1.10)#334 | 4.9%(-0.700)#14,497 |
1
Common Questions
What are the Top Zip Codes with the Highest Percentage of Households with Income Below $10,000 in Cookeville, TN?
Top Zip Codes with the Highest Percentage of Households with Income Below $10,000 in Cookeville, TN are:
What zip code has the Highest Percentage of Households with Income Below $10,000 in Cookeville, TN?
38501 has the Highest Percentage of Households with Income Below $10,000 in Cookeville, TN with 8.3%.
What is the Percentage of Households with Income Below $10,000 in Cookeville, TN?
Percentage of Households with Income Below $10,000 in Cookeville is 8.9%.
What is the Percentage of Households with Income Below $10,000 in Tennessee?
Percentage of Households with Income Below $10,000 in Tennessee is 5.3%.
What is the Percentage of Households with Income Below $10,000 in the United States?
Percentage of Households with Income Below $10,000 in the United States is 4.9%.