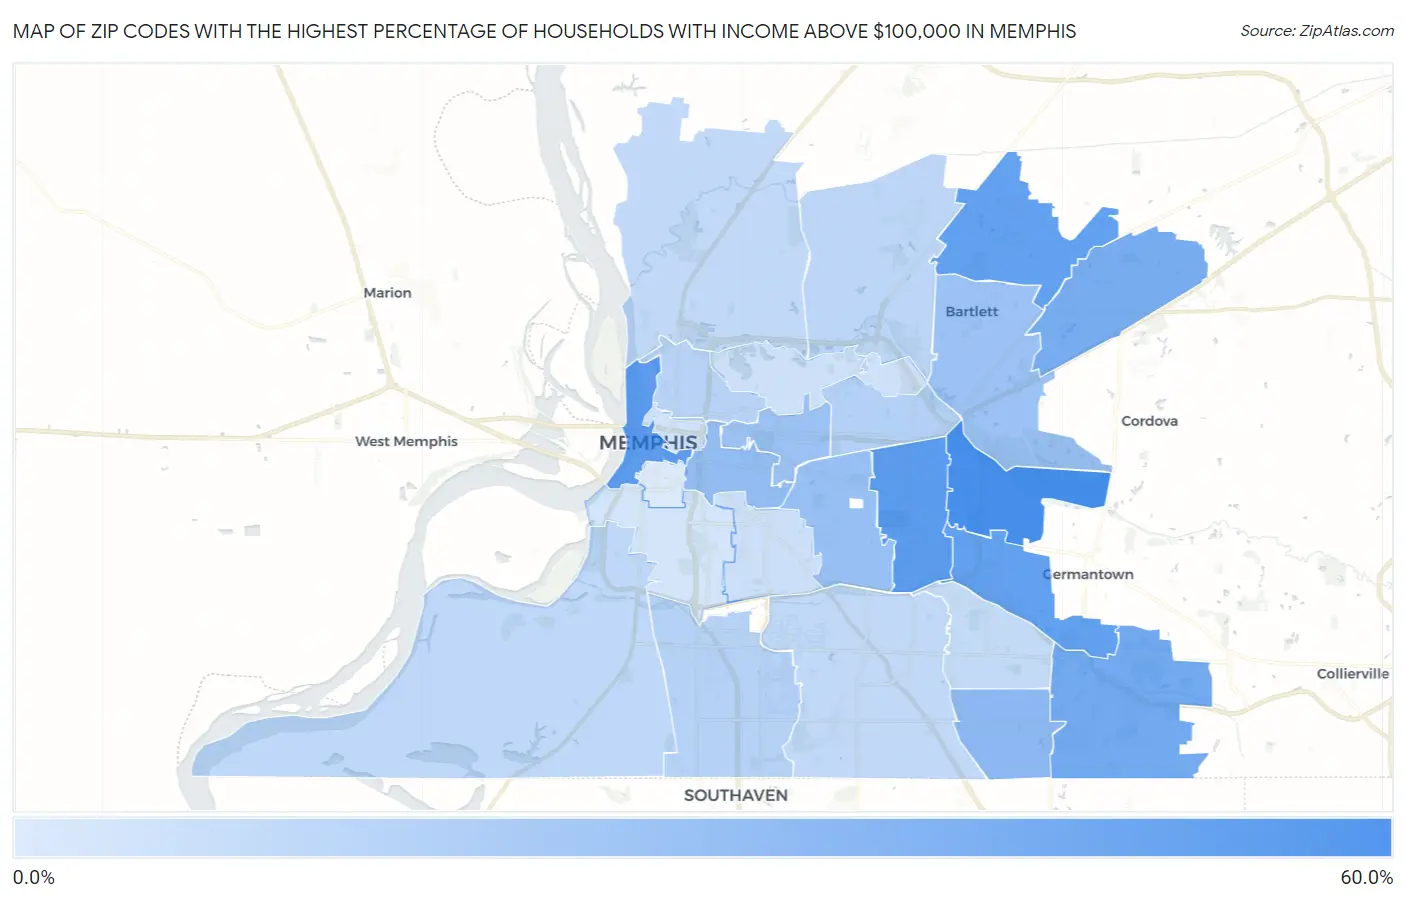
Zip Codes with the Highest Percentage of Households with Income Above $100,000 in Memphis, TN
RELATED REPORTS & OPTIONS
Household Income | $100k+
Memphis
Compare Zip Codes
Map of Zip Codes with the Highest Percentage of Households with Income Above $100,000 in Memphis
2.6%
55.1%
Zip Codes with the Highest Percentage of Households with Income Above $100,000 in Memphis, TN
| Zip Code | Households with Income > $100k | vs State | vs National | |
| 1. | 38120 | 55.1% | 29.7%(+25.4)#24 | 37.3%(+17.8)#3,434 |
| 2. | 38117 | 46.8% | 29.7%(+17.1)#42 | 37.3%(+9.50)#5,906 |
| 3. | 38103 | 45.6% | 29.7%(+15.9)#46 | 37.3%(+8.30)#6,371 |
| 4. | 38119 | 43.9% | 29.7%(+14.2)#55 | 37.3%(+6.60)#7,048 |
| 5. | 38135 | 43.5% | 29.7%(+13.8)#58 | 37.3%(+6.20)#7,199 |
| 6. | 38125 | 37.5% | 29.7%(+7.80)#94 | 37.3%(+0.200)#10,247 |
| 7. | 38133 | 35.5% | 29.7%(+5.80)#112 | 37.3%(-1.80)#11,446 |
| 8. | 38141 | 27.8% | 29.7%(-1.90)#207 | 37.3%(-9.50)#17,298 |
| 9. | 38104 | 25.6% | 29.7%(-4.10)#238 | 37.3%(-11.7)#19,217 |
| 10. | 38111 | 23.8% | 29.7%(-5.90)#282 | 37.3%(-13.5)#20,817 |
| 11. | 38112 | 23.4% | 29.7%(-6.30)#296 | 37.3%(-13.9)#21,224 |
| 12. | 38134 | 23.0% | 29.7%(-6.70)#304 | 37.3%(-14.3)#21,553 |
| 13. | 38122 | 15.4% | 29.7%(-14.3)#482 | 37.3%(-21.9)#27,302 |
| 14. | 38116 | 14.3% | 29.7%(-15.4)#500 | 37.3%(-23.0)#27,926 |
| 15. | 38107 | 13.3% | 29.7%(-16.4)#518 | 37.3%(-24.0)#28,440 |
| 16. | 38128 | 12.4% | 29.7%(-17.3)#530 | 37.3%(-24.9)#28,846 |
| 17. | 38109 | 11.3% | 29.7%(-18.4)#546 | 37.3%(-26.0)#29,316 |
| 18. | 38127 | 10.8% | 29.7%(-18.9)#552 | 37.3%(-26.5)#29,518 |
| 19. | 38118 | 10.7% | 29.7%(-19.0)#553 | 37.3%(-26.6)#29,560 |
| 20. | 38115 | 10.2% | 29.7%(-19.5)#559 | 37.3%(-27.1)#29,745 |
| 21. | 38114 | 7.5% | 29.7%(-22.2)#581 | 37.3%(-29.8)#30,559 |
| 22. | 38108 | 6.5% | 29.7%(-23.2)#587 | 37.3%(-30.8)#30,769 |
| 23. | 38105 | 5.7% | 29.7%(-24.0)#593 | 37.3%(-31.6)#30,917 |
| 24. | 38106 | 5.5% | 29.7%(-24.2)#594 | 37.3%(-31.8)#30,965 |
| 25. | 38126 | 2.6% | 29.7%(-27.1)#598 | 37.3%(-34.7)#31,373 |
1
Common Questions
What are the Top 10 Zip Codes with the Highest Percentage of Households with Income Above $100,000 in Memphis, TN?
Top 10 Zip Codes with the Highest Percentage of Households with Income Above $100,000 in Memphis, TN are:
What zip code has the Highest Percentage of Households with Income Above $100,000 in Memphis, TN?
38120 has the Highest Percentage of Households with Income Above $100,000 in Memphis, TN with 55.1%.
What is the Percentage of Households with Income Above $100,000 in Memphis, TN?
Percentage of Households with Income Above $100,000 in Memphis is 21.1%.
What is the Percentage of Households with Income Above $100,000 in Tennessee?
Percentage of Households with Income Above $100,000 in Tennessee is 29.7%.
What is the Percentage of Households with Income Above $100,000 in the United States?
Percentage of Households with Income Above $100,000 in the United States is 37.3%.