Zip Codes with the Highest Percentage of Population with a Degree in Computers and Mathematics in Memphis, TN
RELATED REPORTS & OPTIONS
Computers and Mathematics
Memphis
Compare Zip Codes
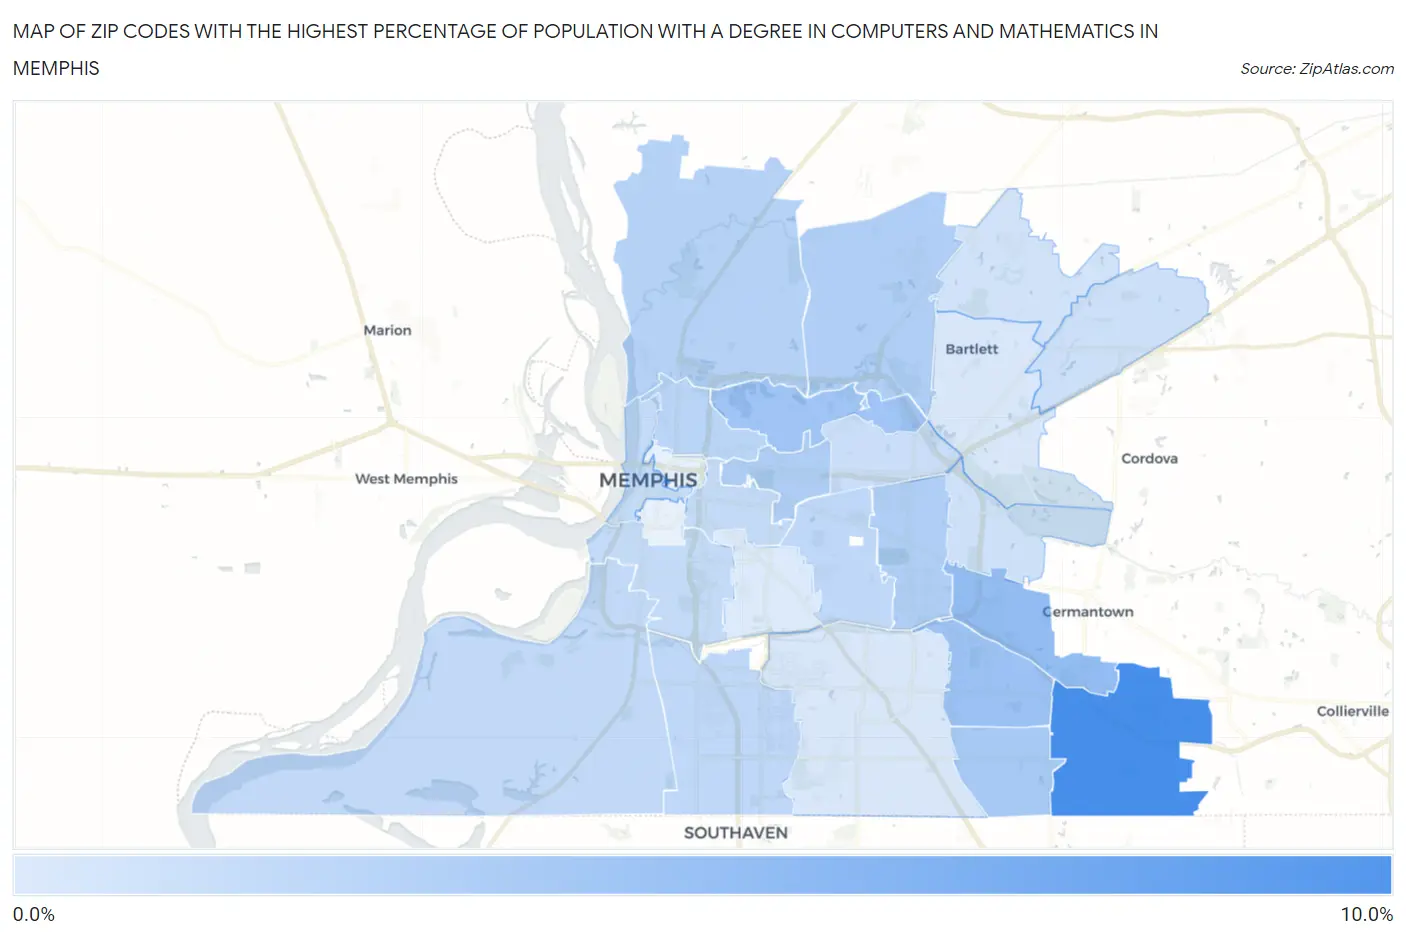
Map of Zip Codes with the Highest Percentage of Population with a Degree in Computers and Mathematics in Memphis
1.2%
9.2%
Zip Codes with the Highest Percentage of Population with a Degree in Computers and Mathematics in Memphis, TN
| Zip Code | % Graduates | vs State | vs National | |
| 1. | 38125 | 9.2% | 3.7%(+5.51)#34 | 4.9%(+4.30)#2,119 |
| 2. | 38119 | 5.0% | 3.7%(+1.32)#105 | 4.9%(+0.109)#7,440 |
| 3. | 38115 | 4.6% | 3.7%(+0.969)#121 | 4.9%(-0.246)#8,436 |
| 4. | 38108 | 4.3% | 3.7%(+0.654)#138 | 4.9%(-0.562)#9,421 |
| 5. | 38141 | 3.9% | 3.7%(+0.256)#167 | 4.9%(-0.959)#10,669 |
| 6. | 38112 | 3.6% | 3.7%(-0.084)#190 | 4.9%(-1.30)#11,909 |
| 7. | 38117 | 3.5% | 3.7%(-0.211)#204 | 4.9%(-1.43)#12,416 |
| 8. | 38128 | 3.5% | 3.7%(-0.222)#205 | 4.9%(-1.44)#12,455 |
| 9. | 38127 | 3.2% | 3.7%(-0.470)#223 | 4.9%(-1.69)#13,356 |
| 10. | 38107 | 2.9% | 3.7%(-0.737)#239 | 4.9%(-1.95)#14,279 |
| 11. | 38111 | 2.8% | 3.7%(-0.905)#255 | 4.9%(-2.12)#14,895 |
| 12. | 38116 | 2.7% | 3.7%(-0.989)#259 | 4.9%(-2.20)#15,204 |
| 13. | 38109 | 2.6% | 3.7%(-1.10)#270 | 4.9%(-2.31)#15,602 |
| 14. | 38106 | 2.6% | 3.7%(-1.12)#273 | 4.9%(-2.34)#15,705 |
| 15. | 38104 | 2.5% | 3.7%(-1.19)#280 | 4.9%(-2.41)#15,964 |
| 16. | 38103 | 2.4% | 3.7%(-1.28)#284 | 4.9%(-2.49)#16,260 |
| 17. | 38122 | 2.1% | 3.7%(-1.55)#299 | 4.9%(-2.77)#17,200 |
| 18. | 38133 | 2.0% | 3.7%(-1.71)#318 | 4.9%(-2.93)#17,739 |
| 19. | 38120 | 1.9% | 3.7%(-1.73)#321 | 4.9%(-2.95)#17,791 |
| 20. | 38135 | 1.8% | 3.7%(-1.89)#335 | 4.9%(-3.10)#18,261 |
| 21. | 38134 | 1.5% | 3.7%(-2.21)#357 | 4.9%(-3.43)#19,246 |
| 22. | 38118 | 1.4% | 3.7%(-2.27)#359 | 4.9%(-3.48)#19,399 |
| 23. | 38114 | 1.2% | 3.7%(-2.49)#368 | 4.9%(-3.70)#20,026 |
1
Common Questions
What are the Top 10 Zip Codes with the Highest Percentage of Population with a Degree in Computers and Mathematics in Memphis, TN?
Top 10 Zip Codes with the Highest Percentage of Population with a Degree in Computers and Mathematics in Memphis, TN are:
What zip code has the Highest Percentage of Population with a Degree in Computers and Mathematics in Memphis, TN?
38125 has the Highest Percentage of Population with a Degree in Computers and Mathematics in Memphis, TN with 9.2%.
What is the Percentage of Population with a Degree in Computers and Mathematics in Memphis, TN?
Percentage of Population with a Degree in Computers and Mathematics in Memphis is 3.1%.
What is the Percentage of Population with a Degree in Computers and Mathematics in Tennessee?
Percentage of Population with a Degree in Computers and Mathematics in Tennessee is 3.7%.
What is the Percentage of Population with a Degree in Computers and Mathematics in the United States?
Percentage of Population with a Degree in Computers and Mathematics in the United States is 4.9%.