Zip Codes with the Highest Percentage of Population with a Degree in Science and Engineering in Crossville, TN
RELATED REPORTS & OPTIONS
Science and Engineering
Crossville
Compare Zip Codes
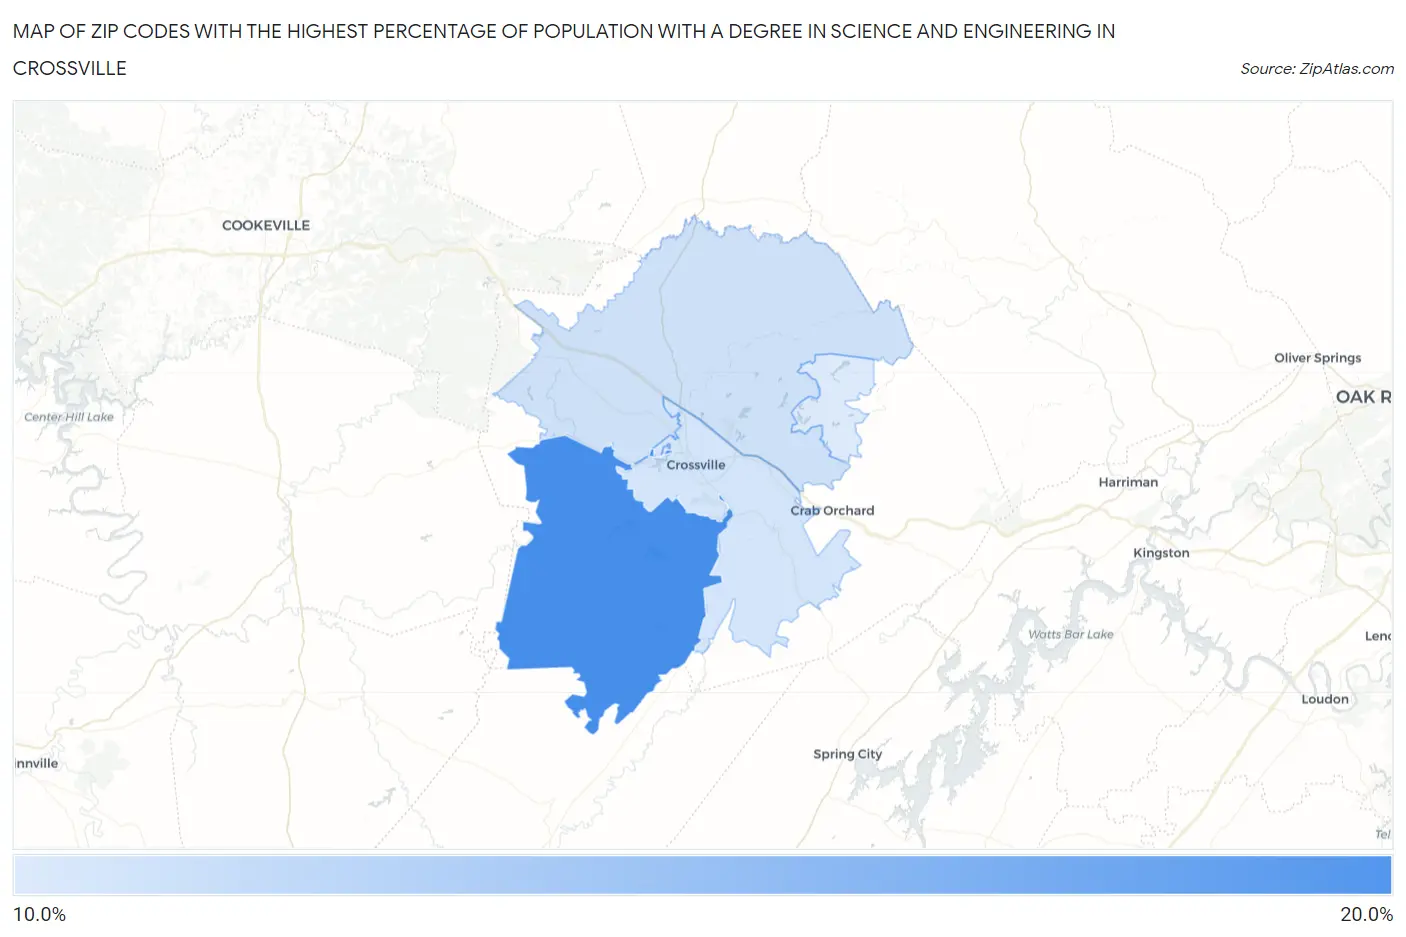
Map of Zip Codes with the Highest Percentage of Population with a Degree in Science and Engineering in Crossville
11.1%
18.7%
Zip Codes with the Highest Percentage of Population with a Degree in Science and Engineering in Crossville, TN
| Zip Code | % Graduates | vs State | vs National | |
| 1. | 38572 | 18.7% | 10.9%(+7.82)#80 | 9.8%(+8.96)#3,925 |
| 2. | 38571 | 11.8% | 10.9%(+0.866)#241 | 9.8%(+2.00)#11,301 |
| 3. | 38555 | 11.6% | 10.9%(+0.688)#248 | 9.8%(+1.83)#11,645 |
| 4. | 38558 | 11.1% | 10.9%(+0.189)#273 | 9.8%(+1.33)#12,663 |
1
Common Questions
What are the Top 3 Zip Codes with the Highest Percentage of Population with a Degree in Science and Engineering in Crossville, TN?
Top 3 Zip Codes with the Highest Percentage of Population with a Degree in Science and Engineering in Crossville, TN are:
What zip code has the Highest Percentage of Population with a Degree in Science and Engineering in Crossville, TN?
38572 has the Highest Percentage of Population with a Degree in Science and Engineering in Crossville, TN with 18.7%.
What is the Percentage of Population with a Degree in Science and Engineering in Crossville, TN?
Percentage of Population with a Degree in Science and Engineering in Crossville is 9.9%.
What is the Percentage of Population with a Degree in Science and Engineering in Tennessee?
Percentage of Population with a Degree in Science and Engineering in Tennessee is 10.9%.
What is the Percentage of Population with a Degree in Science and Engineering in the United States?
Percentage of Population with a Degree in Science and Engineering in the United States is 9.8%.