Zip Codes with the Highest Percentage of Population with a Degree in Visual and Performing Arts in Crossville, TN
RELATED REPORTS & OPTIONS
Visual and Performing Arts
Crossville
Compare Zip Codes
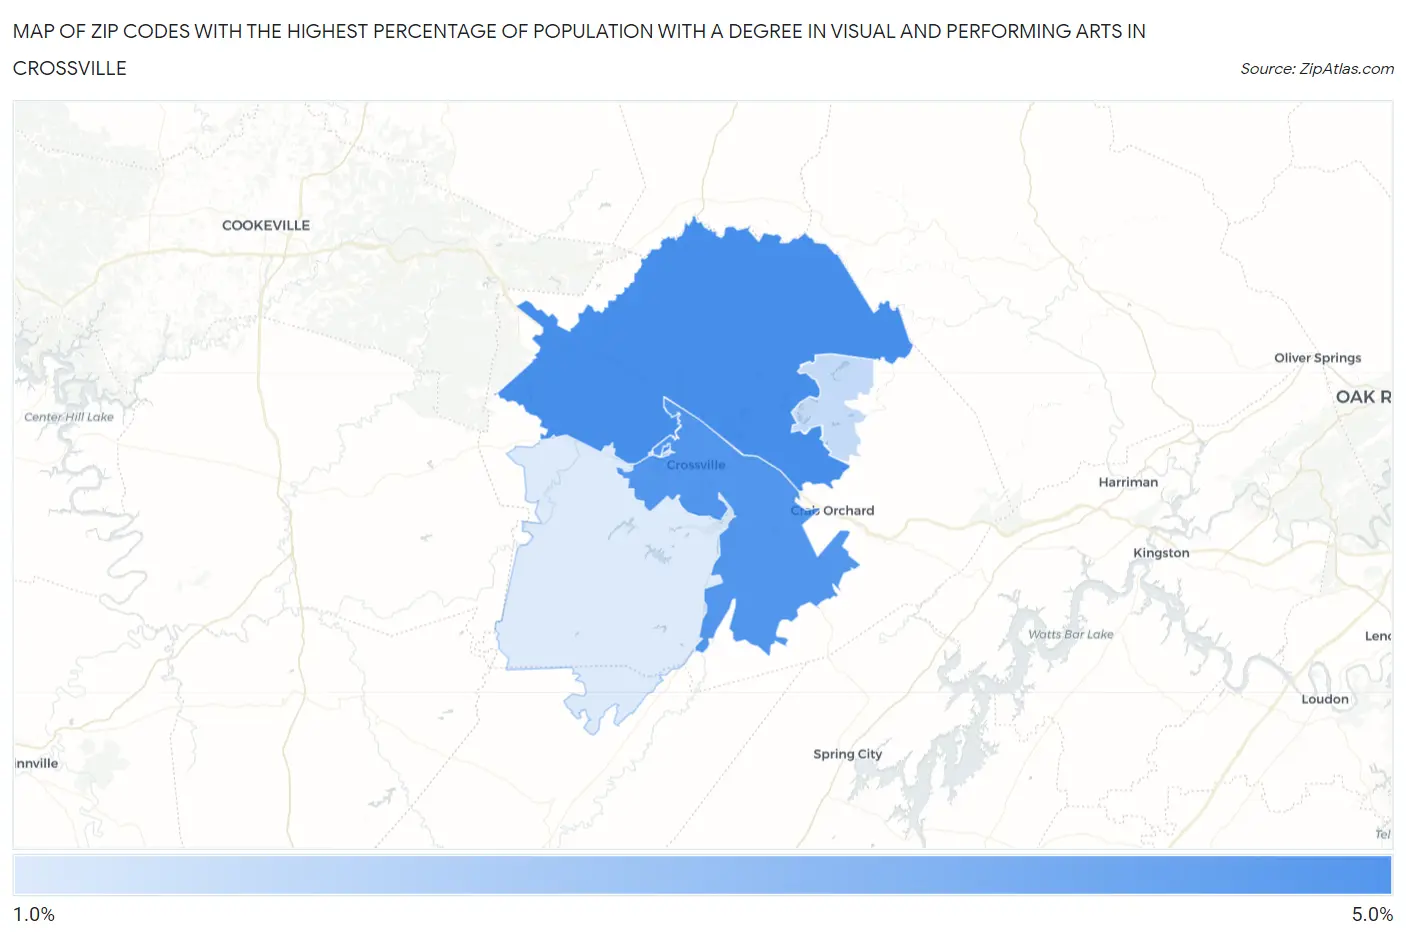
Map of Zip Codes with the Highest Percentage of Population with a Degree in Visual and Performing Arts in Crossville
2.0%
5.0%
Zip Codes with the Highest Percentage of Population with a Degree in Visual and Performing Arts in Crossville, TN
| Zip Code | % Graduates | vs State | vs National | |
| 1. | 38571 | 5.0% | 4.1%(+0.921)#137 | 4.3%(+0.734)#6,683 |
| 2. | 38555 | 4.8% | 4.1%(+0.688)#150 | 4.3%(+0.501)#7,186 |
| 3. | 38558 | 2.5% | 4.1%(-1.57)#263 | 4.3%(-1.75)#14,629 |
| 4. | 38572 | 2.0% | 4.1%(-2.08)#297 | 4.3%(-2.26)#16,496 |
1
Common Questions
What are the Top 3 Zip Codes with the Highest Percentage of Population with a Degree in Visual and Performing Arts in Crossville, TN?
Top 3 Zip Codes with the Highest Percentage of Population with a Degree in Visual and Performing Arts in Crossville, TN are:
What zip code has the Highest Percentage of Population with a Degree in Visual and Performing Arts in Crossville, TN?
38571 has the Highest Percentage of Population with a Degree in Visual and Performing Arts in Crossville, TN with 5.0%.
What is the Percentage of Population with a Degree in Visual and Performing Arts in Crossville, TN?
Percentage of Population with a Degree in Visual and Performing Arts in Crossville is 3.7%.
What is the Percentage of Population with a Degree in Visual and Performing Arts in Tennessee?
Percentage of Population with a Degree in Visual and Performing Arts in Tennessee is 4.1%.
What is the Percentage of Population with a Degree in Visual and Performing Arts in the United States?
Percentage of Population with a Degree in Visual and Performing Arts in the United States is 4.3%.