Zip Codes with the Highest Percentage of Population with a Degree in Arts and Humanities in Crossville, TN
RELATED REPORTS & OPTIONS
Arts and Humanities
Crossville
Compare Zip Codes
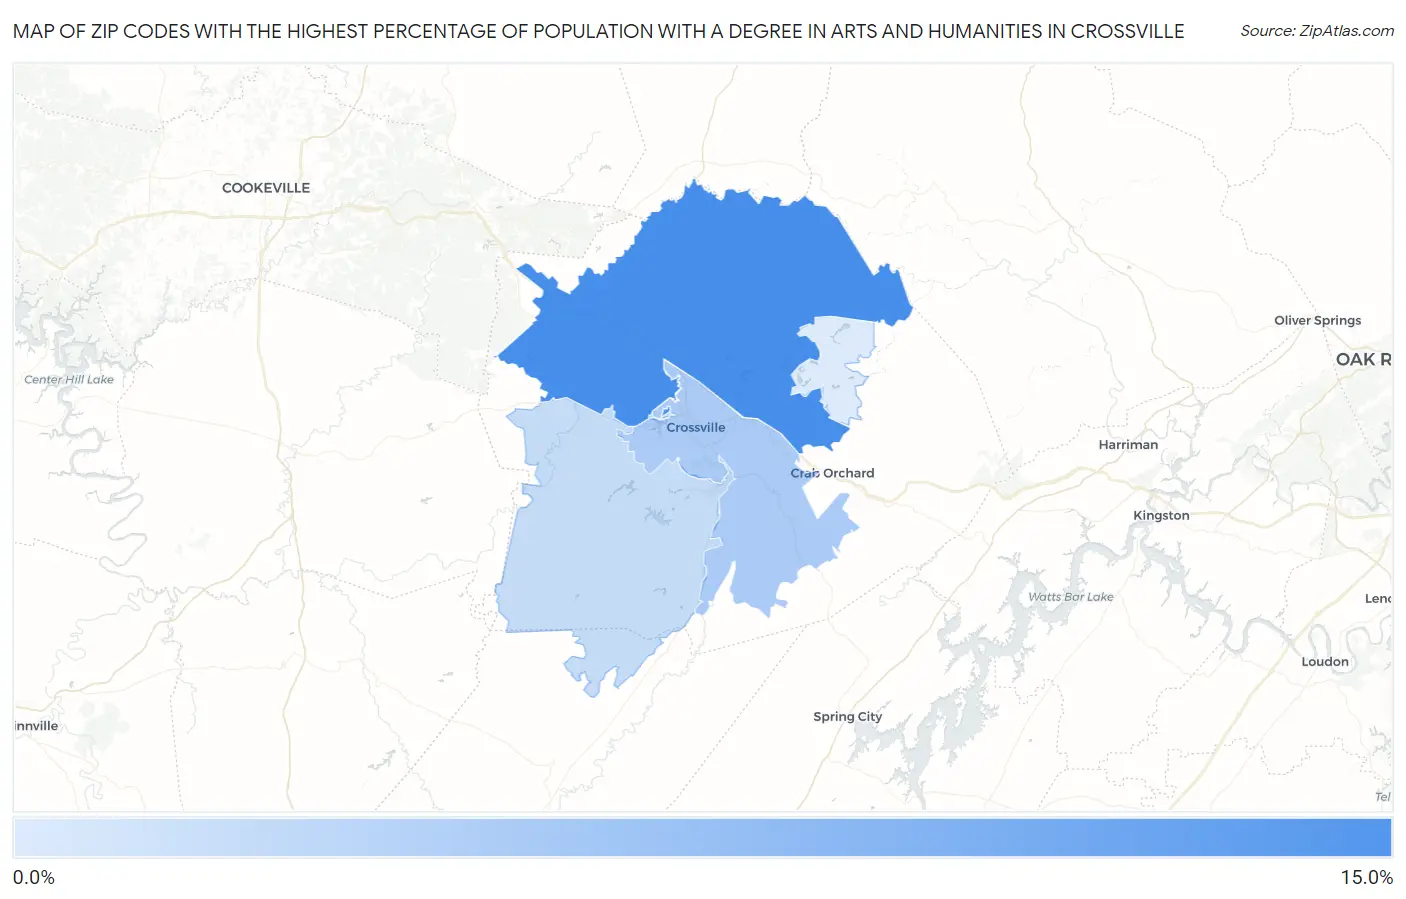
Map of Zip Codes with the Highest Percentage of Population with a Degree in Arts and Humanities in Crossville
4.8%
11.0%
Zip Codes with the Highest Percentage of Population with a Degree in Arts and Humanities in Crossville, TN
| Zip Code | % Graduates | vs State | vs National | |
| 1. | 38571 | 11.0% | 7.0%(+4.06)#100 | 6.0%(+5.05)#5,102 |
| 2. | 38555 | 6.9% | 7.0%(-0.057)#256 | 6.0%(+0.931)#12,153 |
| 3. | 38572 | 5.7% | 7.0%(-1.23)#322 | 6.0%(-0.247)#15,379 |
| 4. | 38558 | 4.8% | 7.0%(-2.16)#383 | 6.0%(-1.17)#18,111 |
1
Common Questions
What are the Top 3 Zip Codes with the Highest Percentage of Population with a Degree in Arts and Humanities in Crossville, TN?
Top 3 Zip Codes with the Highest Percentage of Population with a Degree in Arts and Humanities in Crossville, TN are:
What zip code has the Highest Percentage of Population with a Degree in Arts and Humanities in Crossville, TN?
38571 has the Highest Percentage of Population with a Degree in Arts and Humanities in Crossville, TN with 11.0%.
What is the Percentage of Population with a Degree in Arts and Humanities in Crossville, TN?
Percentage of Population with a Degree in Arts and Humanities in Crossville is 11.8%.
What is the Percentage of Population with a Degree in Arts and Humanities in Tennessee?
Percentage of Population with a Degree in Arts and Humanities in Tennessee is 7.0%.
What is the Percentage of Population with a Degree in Arts and Humanities in the United States?
Percentage of Population with a Degree in Arts and Humanities in the United States is 6.0%.