Zip Codes with the Highest Percentage of Population with a Degree in Computers and Mathematics in Crossville, TN
RELATED REPORTS & OPTIONS
Computers and Mathematics
Crossville
Compare Zip Codes
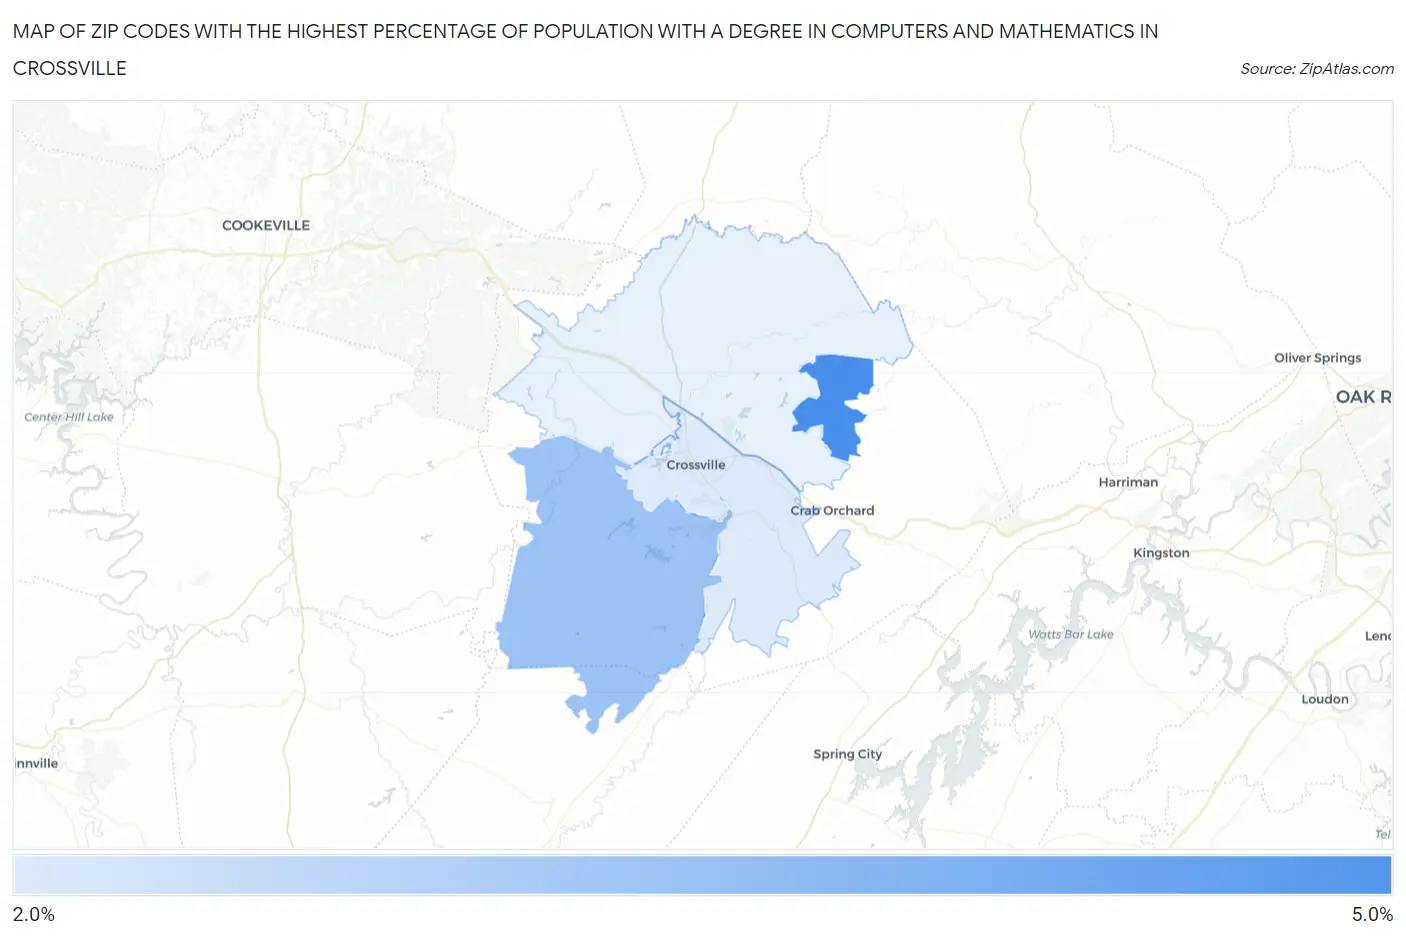
Map of Zip Codes with the Highest Percentage of Population with a Degree in Computers and Mathematics in Crossville
2.6%
4.5%
Zip Codes with the Highest Percentage of Population with a Degree in Computers and Mathematics in Crossville, TN
| Zip Code | % Graduates | vs State | vs National | |
| 1. | 38558 | 4.5% | 3.7%(+0.834)#129 | 4.9%(-0.382)#8,834 |
| 2. | 38572 | 3.4% | 3.7%(-0.272)#209 | 4.9%(-1.49)#12,641 |
| 3. | 38555 | 2.6% | 3.7%(-1.10)#271 | 4.9%(-2.31)#15,612 |
1
Common Questions
What are the Top 3 Zip Codes with the Highest Percentage of Population with a Degree in Computers and Mathematics in Crossville, TN?
Top 3 Zip Codes with the Highest Percentage of Population with a Degree in Computers and Mathematics in Crossville, TN are:
What zip code has the Highest Percentage of Population with a Degree in Computers and Mathematics in Crossville, TN?
38558 has the Highest Percentage of Population with a Degree in Computers and Mathematics in Crossville, TN with 4.5%.
What is the Percentage of Population with a Degree in Computers and Mathematics in Crossville, TN?
Percentage of Population with a Degree in Computers and Mathematics in Crossville is 2.4%.
What is the Percentage of Population with a Degree in Computers and Mathematics in Tennessee?
Percentage of Population with a Degree in Computers and Mathematics in Tennessee is 3.7%.
What is the Percentage of Population with a Degree in Computers and Mathematics in the United States?
Percentage of Population with a Degree in Computers and Mathematics in the United States is 4.9%.