Zip Codes with the Highest Percentage of Population Employed in Real Estate, Rental & Leasing in Crossville, TN
RELATED REPORTS & OPTIONS
Real Estate, Rental & Leasing
Crossville
Compare Zip Codes
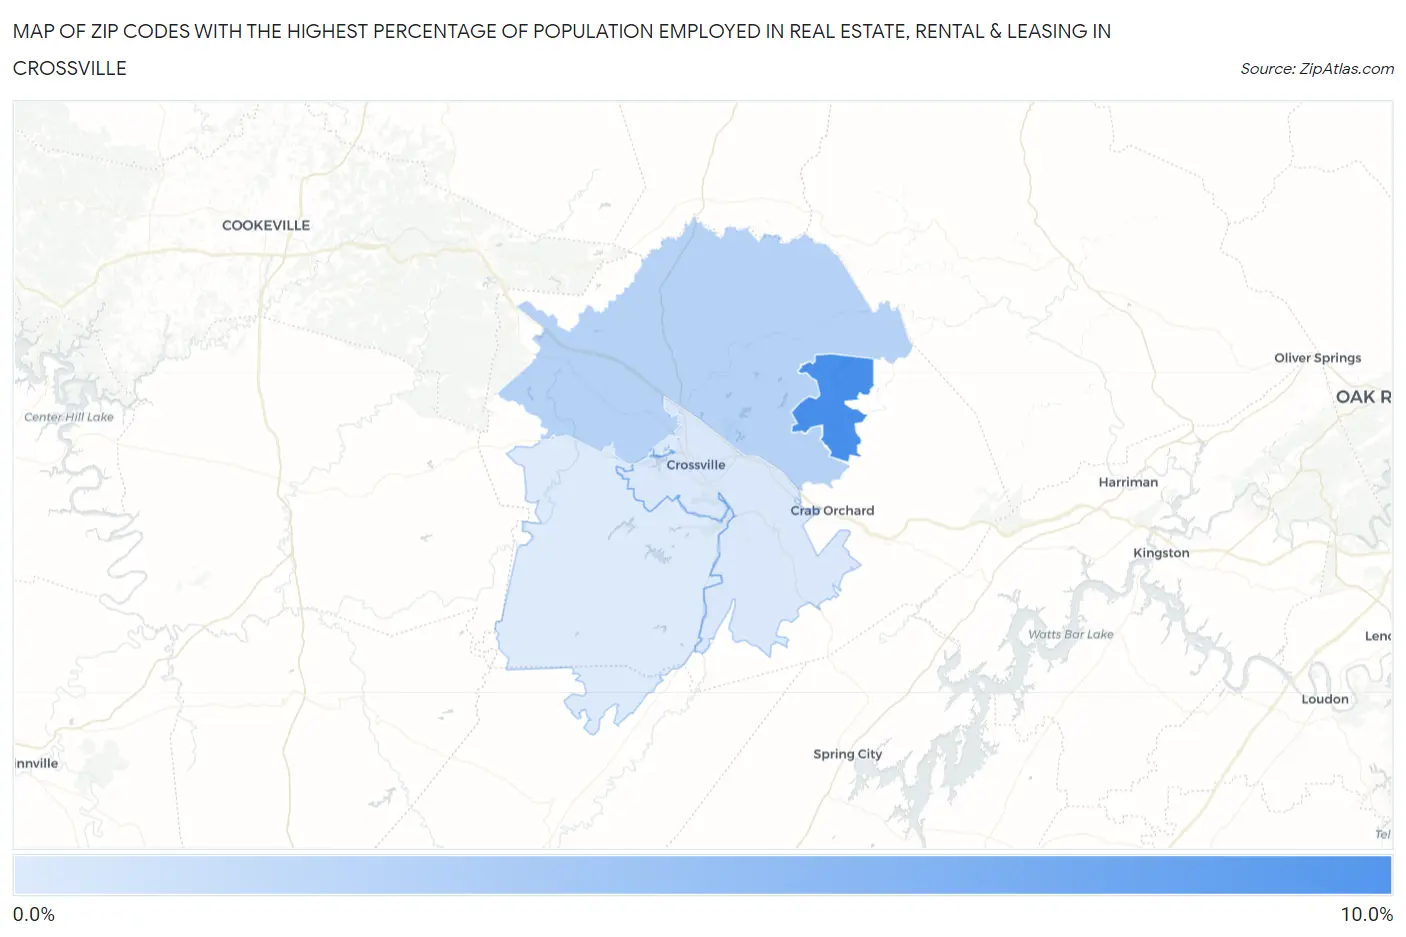
Map of Zip Codes with the Highest Percentage of Population Employed in Real Estate, Rental & Leasing in Crossville
0.95%
9.9%
Zip Codes with the Highest Percentage of Population Employed in Real Estate, Rental & Leasing in Crossville, TN
| Zip Code | % Employed | vs State | vs National | |
| 1. | 38558 | 9.9% | 1.7%(+8.12)#4 | 1.9%(+7.96)#390 |
| 2. | 38571 | 3.2% | 1.7%(+1.49)#48 | 1.9%(+1.34)#3,355 |
| 3. | 38555 | 1.1% | 1.7%(-0.611)#269 | 1.9%(-0.768)#14,074 |
| 4. | 38572 | 0.95% | 1.7%(-0.780)#297 | 1.9%(-0.937)#15,526 |
1
Common Questions
What are the Top 3 Zip Codes with the Highest Percentage of Population Employed in Real Estate, Rental & Leasing in Crossville, TN?
Top 3 Zip Codes with the Highest Percentage of Population Employed in Real Estate, Rental & Leasing in Crossville, TN are:
What zip code has the Highest Percentage of Population Employed in Real Estate, Rental & Leasing in Crossville, TN?
38558 has the Highest Percentage of Population Employed in Real Estate, Rental & Leasing in Crossville, TN with 9.9%.
What is the Percentage of Population Employed in Real Estate, Rental & Leasing in Crossville, TN?
Percentage of Population Employed in Real Estate, Rental & Leasing in Crossville is 1.8%.
What is the Percentage of Population Employed in Real Estate, Rental & Leasing in Tennessee?
Percentage of Population Employed in Real Estate, Rental & Leasing in Tennessee is 1.7%.
What is the Percentage of Population Employed in Real Estate, Rental & Leasing in the United States?
Percentage of Population Employed in Real Estate, Rental & Leasing in the United States is 1.9%.