Zip Codes with the Highest Percentage of Immigrants from Southern Europe in Crossville, TN
RELATED REPORTS & OPTIONS
Southern Europe
Crossville
Compare Zip Codes
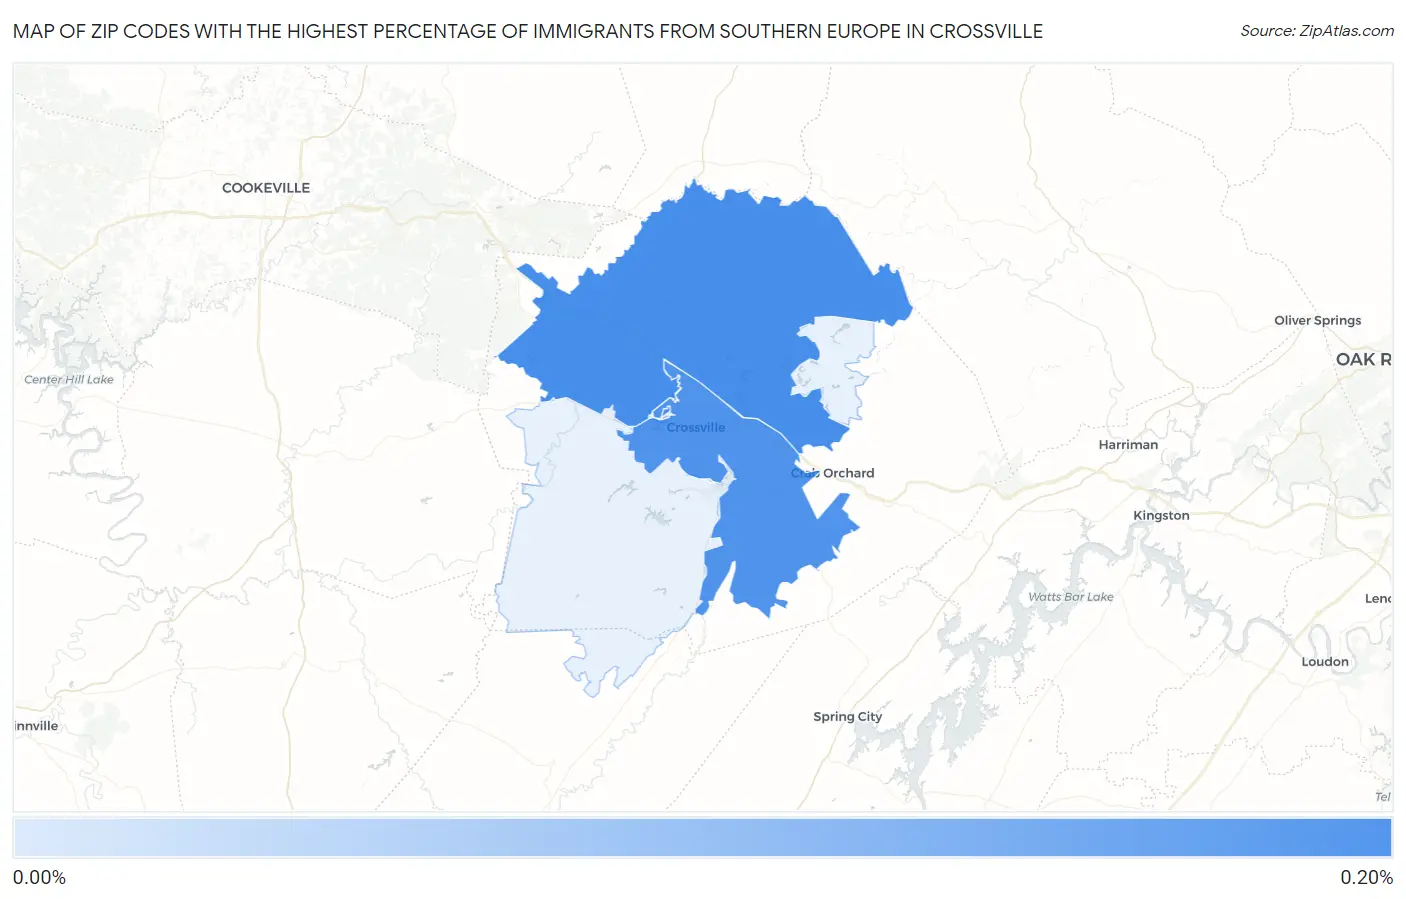
Map of Zip Codes with the Highest Percentage of Immigrants from Southern Europe in Crossville
0.18%
0.18%
Zip Codes with the Highest Percentage of Immigrants from Southern Europe in Crossville, TN
| Zip Code | Southern Europe | vs State | vs National | |
| 1. | 38571 | 0.18% | 0.042%(+0.141)#26 | 0.22%(-0.037)#4,565 |
| 2. | 38555 | 0.18% | 0.042%(+0.133)#28 | 0.22%(-0.044)#4,682 |
1
Common Questions
What are the Top 3 Zip Codes with the Highest Percentage of Immigrants from Southern Europe in Crossville, TN?
Top 3 Zip Codes with the Highest Percentage of Immigrants from Southern Europe in Crossville, TN are:
What zip code has the Highest Percentage of Immigrants from Southern Europe in Crossville, TN?
38571 has the Highest Percentage of Immigrants from Southern Europe in Crossville, TN with 0.18%.
What is the Percentage of Immigrants from Southern Europe in Crossville, TN?
Percentage of Immigrants from Southern Europe in Crossville is 0.31%.
What is the Percentage of Immigrants from Southern Europe in Tennessee?
Percentage of Immigrants from Southern Europe in Tennessee is 0.042%.
What is the Percentage of Immigrants from Southern Europe in the United States?
Percentage of Immigrants from Southern Europe in the United States is 0.22%.