Zip Codes with the Highest Percentage of Families with Income Below $10,000 in Crossville, TN
RELATED REPORTS & OPTIONS
Family Income | $0-10k
Crossville
Compare Zip Codes
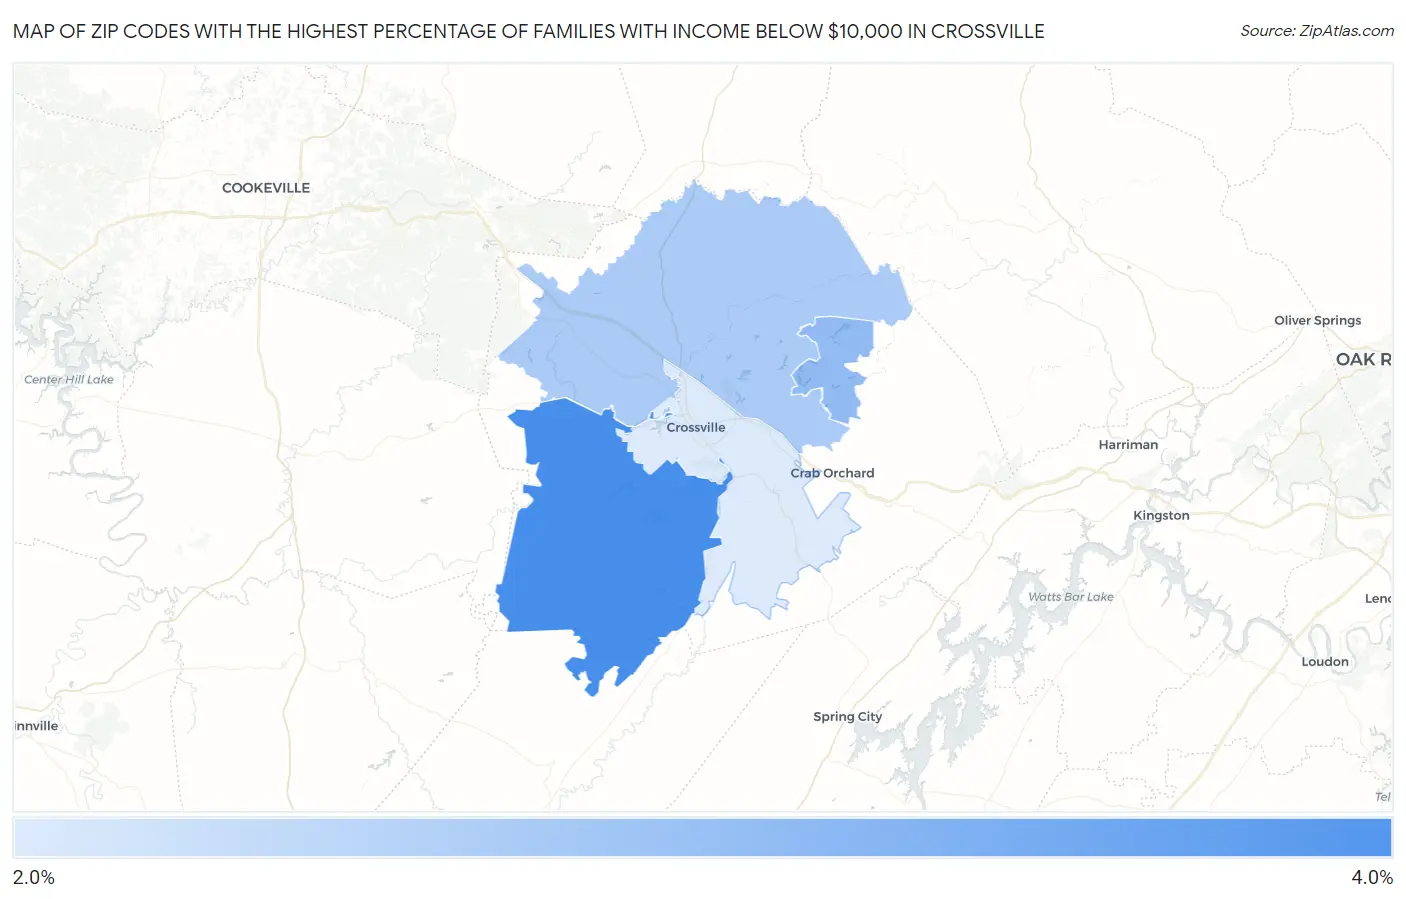
Map of Zip Codes with the Highest Percentage of Families with Income Below $10,000 in Crossville
2.1%
3.3%
Zip Codes with the Highest Percentage of Families with Income Below $10,000 in Crossville, TN
| Zip Code | Families with Income < $10k | vs State | vs National | |
| 1. | 38572 | 3.3% | 3.5%(-0.200)#252 | 3.1%(+0.200)#10,223 |
| 2. | 38558 | 2.7% | 3.5%(-0.800)#300 | 3.1%(-0.400)#12,392 |
| 3. | 38571 | 2.5% | 3.5%(-1.00)#319 | 3.1%(-0.600)#13,178 |
| 4. | 38555 | 2.1% | 3.5%(-1.40)#358 | 3.1%(-1.000)#14,900 |
1
Common Questions
What are the Top 3 Zip Codes with the Highest Percentage of Families with Income Below $10,000 in Crossville, TN?
Top 3 Zip Codes with the Highest Percentage of Families with Income Below $10,000 in Crossville, TN are:
What zip code has the Highest Percentage of Families with Income Below $10,000 in Crossville, TN?
38572 has the Highest Percentage of Families with Income Below $10,000 in Crossville, TN with 3.3%.
What is the Percentage of Families with Income Below $10,000 in Crossville, TN?
Percentage of Families with Income Below $10,000 in Crossville is 2.8%.
What is the Percentage of Families with Income Below $10,000 in Tennessee?
Percentage of Families with Income Below $10,000 in Tennessee is 3.5%.
What is the Percentage of Families with Income Below $10,000 in the United States?
Percentage of Families with Income Below $10,000 in the United States is 3.1%.