Zip Codes with the Highest Percentage of Population Employed in Business & Financial in Crossville, TN
RELATED REPORTS & OPTIONS
Business & Financial
Crossville
Compare Zip Codes
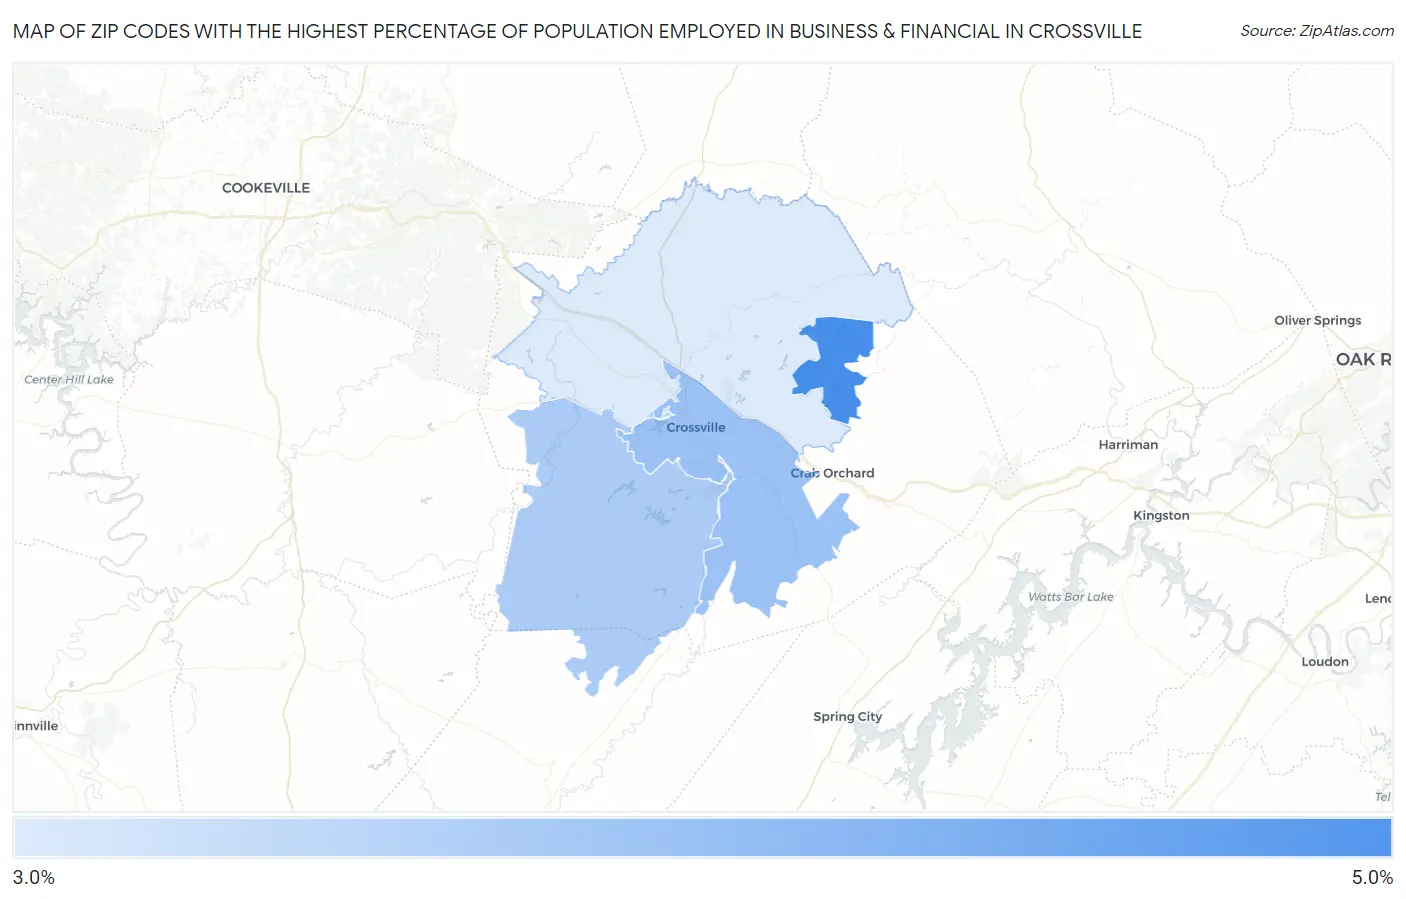
Map of Zip Codes with the Highest Percentage of Population Employed in Business & Financial in Crossville
3.7%
4.9%
Zip Codes with the Highest Percentage of Population Employed in Business & Financial in Crossville, TN
| Zip Code | % Employed | vs State | vs National | |
| 1. | 38558 | 4.9% | 5.0%(-0.157)#171 | 5.8%(-0.898)#10,861 |
| 2. | 38555 | 4.2% | 5.0%(-0.838)#231 | 5.8%(-1.58)#13,185 |
| 3. | 38572 | 4.1% | 5.0%(-0.954)#236 | 5.8%(-1.69)#13,602 |
| 4. | 38571 | 3.7% | 5.0%(-1.37)#278 | 5.8%(-2.11)#15,210 |
1
Common Questions
What are the Top 3 Zip Codes with the Highest Percentage of Population Employed in Business & Financial in Crossville, TN?
Top 3 Zip Codes with the Highest Percentage of Population Employed in Business & Financial in Crossville, TN are:
What zip code has the Highest Percentage of Population Employed in Business & Financial in Crossville, TN?
38558 has the Highest Percentage of Population Employed in Business & Financial in Crossville, TN with 4.9%.
What is the Percentage of Population Employed in Business & Financial in Crossville, TN?
Percentage of Population Employed in Business & Financial in Crossville is 4.9%.
What is the Percentage of Population Employed in Business & Financial in Tennessee?
Percentage of Population Employed in Business & Financial in Tennessee is 5.0%.
What is the Percentage of Population Employed in Business & Financial in the United States?
Percentage of Population Employed in Business & Financial in the United States is 5.8%.